💡Don't miss the great buy opportunity in HOTUSDTTrading suggestion:
". There is a possibility of temporary retracement to the suggested support line (0.004835).
. if so, traders can set orders based on Price Action and expect to reach short-term targets."
Technical analysis:
. HOTUSDT is in a range bound, and the beginning of an uptrend is expected.
. The price is above the 21-Day WEMA, which acts as a dynamic support.
. The RSI is at 71.
Take Profits:
TP1= @ 0.005328
TP2= @ 0.005794
TP3= @ 0.006197
TP4= @ 0.006633
TP5= @ 0.007166
SL= Break below S2
❤️ If you find this helpful and want more FREE forecasts in TradingView
. . . . . Please show your support back,
. . . . . . . . Hit the 👍 LIKE button,
. . . . . . . . . . Drop some feedback below in the comment!
❤️ Your support is very much 🙏 appreciated! ❤️
💎 Want us to help you become a better Forex / Crypto trader ?
Now, It's your turn !
Be sure to leave a comment; let us know how you see this opportunity and forecast.
Trade well, ❤️
ForecastCity English Support Team ❤️
HOTUSDT trade ideas


HOT descending triangle bullish breakoutWe can see that holo is breaking out of a diagonal resistance, if it closes above the line it is very bullish for this coin.

$HOT 4H LOOK$HOT is looking great now, the green area has been a heavy resistance before and now turns to a support, I bought some here, stop lose below the green area

HOTUSDTAccumulation from current price 0.0048 to 0.0043 with stop breaking down 0.004 .
The big target is 0.0245 , the blue areas are strong resistance for take profit .
Breaking out the red area at 0.0067 is a good signal to hit the targets .
Good luck and plz control your risk management .

Holo (HOT) Is Offering Cool Discount- Market retraces since April 2021
- And now it has hit Weekly Inside Bar support,
- And then forming engulfing candlestick pattern. Low of the engulfing formed another support. Which can also be our stoploss level.
- Market breaks the Resistance 1 quite desicively.
- And then broke Resistance 2 as well.
- This indicates that the Bulls are now back in charge. The trend is about to change.
- Good buy range is anywhere from the Engulfing pattern up to Resistance 1 break.
- Chaikin Money Flow indicator is also below 0 line, signaling it's ok to buy.
This is not investing advice. Please do your own research about the project.


BUY HOT for now or never!Hot is at a retest position and potentially bullish after breaking the symmetrical triangle pattern. Be aware that at 0.007, the resistance is so strong. Now, this is a good place to take a long position. Don't be greedy and always manage your risk.

HOT/USDT Buy step by step in supports.
🔴Supports $0.0055 & $0.0045 & $0.0035
🔵Resistance Zone $0.0067 & $0.0075
🟢Target: $0.0086 & $0.01 & $0.0125
Like and comment please ❤


LONG HOT/USDT
HTF bullish consolidation, we break it with consolidation look for entry.
RISK = 1 %
HTF:
LTF :

Hot hot hot 🔥🔥🔥Upside breakout could bring 0.011 are. Waiting under the resistance.
I believe we are gonna see some nice moves soon.


HOLO currency ended the previous two trading weeks that herald tHOLO currency ended the previous two trading weeks that herald the beginning of a strong rise, the extent of its strength will be confirmed by the end of trading this week, with price behavior and trading volumes confirming each other, just as they confirmed each other's behavior in the previous rise.

🔥 HOT Massive 1-Year Bull-FlagEver since HOT topped last year April, HOT has been in a dominantly bearish trend downward. During this period, a bull-flag pattern has emerged on the chart.
Classically, bull-flag patterns are bullish continuation patterns, so that's where we will be looking at.
Looking at the chart, HOT definitely has more upside potential. The first main resistance will be the top of the flag-pattern. From thereon, we will either reverse back towards the bottom support of the pattern, or we will break out bullish.
Assuming that BTC will remain bullish and continue its path towards >$50k, the bullish break out option will be the most likely.
Happy trading!

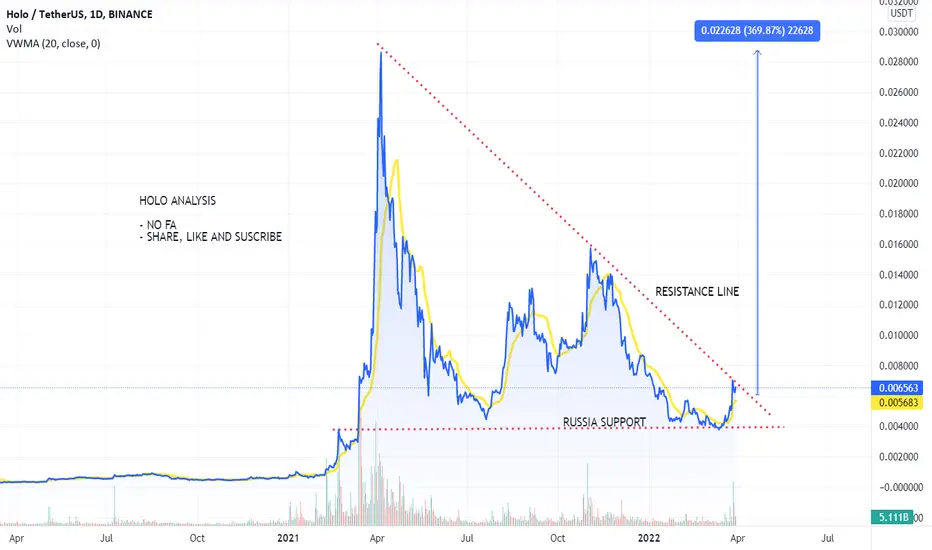
HOLO CHART BULLISH SCENARIO
Hello everybody,
As you all can see
I expect a rise to the high when we breakout of the resistance line.
With this inflation currently going on i expect a nice bullrun coming months to come
Feel free to share,like and suscribe
Stay safe and have a great day out there
HOLO CHART BULLISH SCENARIO ( I FEEL LIKE WE ALMOST THERE)Expect breakout around 0.007133 level.
When we break that resistance i expect a huge rise to the high not only for Holo but for many other crypto's to
we all got our favorites right.
''Stay safe out there and take care of your family and friends''
HOTUSDT: FALLING WEDGE, RAISE OF ALTCOINS BULL RUN?Hello Fellow HOLO Investor/Trader!
HOTUSDT rebound on the bullish trendline . Recently, HOTUSDT is also breaking out of the falling wedge pattern. The breakout accompanies with increasing volume which indicates a potential bullish bias ahead.
*All Explanation is presented on the chart*
The roadmap will be invalid after reaching the target/ support area .
"Disclaimer: This is only an outlook, not a recommendation to buy/sell cryptocurrency."
*SUPPORT THE CHANNEL BY SMASHING THE LIKE BUTTON AND SHARE YOUR OPINION BELOWS, SEE YA ON THE NEXT ROADMAP*

HOLO CHART BULLISH SCENARIO (update)Creating a strong bullish sructure on the 4hourly chart.
- Stay safe everybody
- Feel free to share, like and suscribe

Holo Going Bullish these days it's a clear BULLISH PENNANT
First Target could be 13%
Second one 30% ,

HOT bullish flag ideawe can see a nice bullish flag forming on hot, if it breaks out we can expect a target of 0.008

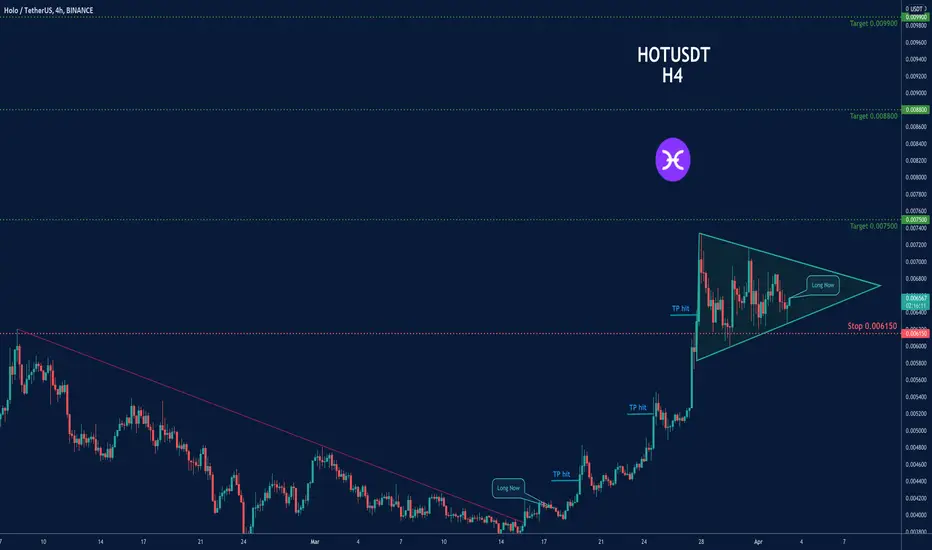
Trading opportunity in HOTUSDT- Symmetrical Triangle PatternBased on technical factors (Symmetrical Triangle Pattern ) there is a long position in :
📊 HOTUSDT
🔵 Long Now 0.006575
🧯 Stop loss 0.006150
🏹 Target 1 0.007500
🏹 Target 2 0.008800
🏹 Target 3 0.009900
💸Capital : 1%
We hope it is profitable for you ❤️
Please support our activity with your likes👍 and comments📝
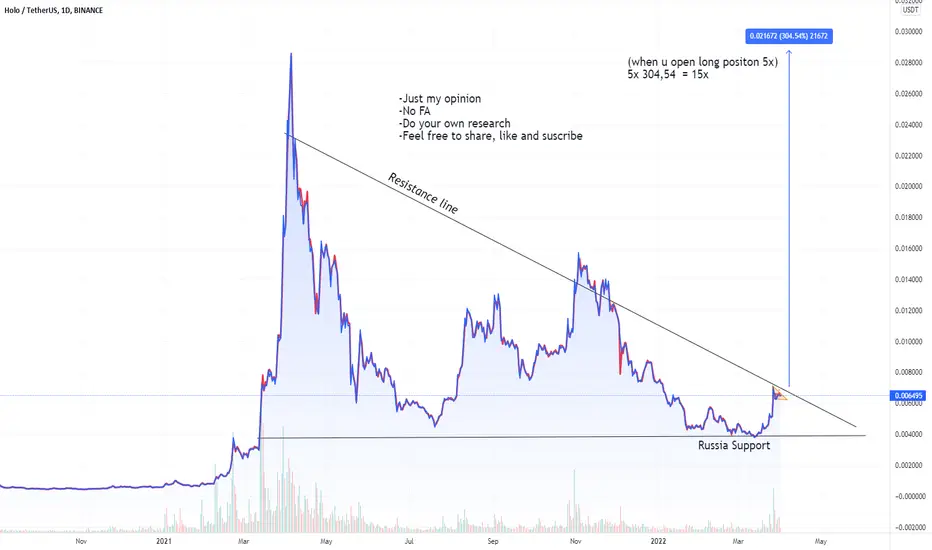
HOLO CHART BULLISH SCENARIO (UPDATE)In my previous chart i made my longterm expectation for HOLO.
Today i made a shorterm expectation because,
i feel like we are almost breaking out of that resistance.
