HOTUSDT trade ideas

HOT is gonna explode All is stated in the chart. The basic idea however is that the decending triangle is very bullish and will pop up

Holochain in the shadowsA big dump happened. But we are touching the support level. And rhis hapened a few times ago. When we finish this movement we will see a moon shot.
Indicators: support resistance

HOTUSDTCurrently going up after completing wave A. Would open a short position on confirmation of B wave end.

BUY BUY BUYForecasts suggest that it has a potential of hitting 1 dollar by this year, and looking at the nature of the coin, it is more than possible, this is the best time to buy!
Sitting on a resistance, as supported by 4h candle, buy buy buy


Holo should bounce off of this levelwe could bounce and consolidate, I am doubtful of a further leg down.

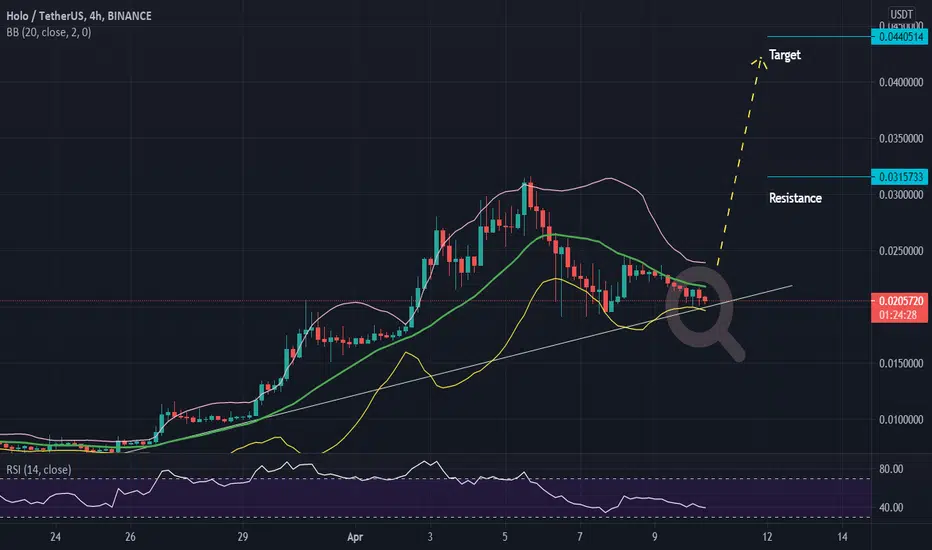
Don't miss this buy opportuniy for HOTafter breakout of flag pattern we can see a pullback and this is a oppotunity for buying HOT in support zone , We can expect the price moving up to 0.031 at least (what I think)
anyway you decide yourselves and comment your opinion

HOT is testing support reversal comingHolo could find support at the 0.019-0.20 zone. Once the market has turned bullish on the 4hr and 1hr timeframes I will be going long with good risk to reward. If you appreciate this analysis please drop a like.

$HOT in for a regulation before another bullish attempt$Hot has been having a great time and has managed to get on board with the current alt season. It is now having some rest testing the prices at 0.02$ and due to the appearance of a inverted ( bearish ) cup and handle pattern, it may break this psychological support and head for the demand zone at around 0.017$. Over there, there would be a stop in bearish movement and decide whether it will ascend towards the current ATH and new ones or it will keep pushing downwards to the next demand zone .
NOTE: Not an economical advice or signal. Just a guy who loves crypto, thinking out loud. : )


It's gonna get hotThis chart has been created for education & entertainment and this is not a trading advice.
HOT Double Buttom & XABCD HOT still in a bullish trend, $0.019 & $0.020 will be the best buying zone for this period.
If it's break, 0.016 /0.017 will be safe, for HODL just be patience
Please do research and know your risk
Good luck!

+250% in HOTUSDTEverytime HOT formed a triangle it went +250% upward in 10 days . It's the third time that it's going to form another triangle.
There is convincing demand at the bottom of the triangle. So technically it can't go lower. You can buy at the bottom of the triangle(the gray line).
The red line should be your stop loss and the green line is the possible target based on chart's prior behavior.
Notice: everytime after breaking up the triangle there was a consolidation phase. So if price form a ressianstance after breaking up the triangle, just wait and don't panic. At that time you can change your stop loss to under low of the consolidation phase.
Another Notice: I doubt the triangle is formed now. I think there should be another test to diameter of the triangle and another rebound to the bottom. So You Can Wait or just take the risk.


2 Weeks of Strong Bull RunBTC slowly moves to 65k and HOT to 0.6
PPO very little trend up for HOT and trend down for BTC.

