HYPE/USDT – Bullish Setup Towards $52.30Hello guys!
Pattern Formation: HYPE has completed a head and shoulders pattern, signaling a bullish reversal after the recent downtrend.
Trend Structure: At the same time, the price is moving within an ascending channel, confirming higher lows and higher highs, which strengthens the bullish case.
Target: The measured move from the pattern points toward $52.30, aligning with the channel’s upper boundary.
Risk Factor: If price breaks below the channel’s lower trendline, the bullish outlook would weaken and the setup could be invalidated.
HYPEUSDT.3S trade ideas


Hypeliquid (HYPE): Expecting Bullish CME To Be Filled HYPE confirmed a BOS after reclaiming the EMAs and holding a successful re-test.
With momentum now on buyers’ side, the first magnet is the big unfilled CME gap above, which often acts as a natural target. Once that’s filled, we shift focus toward the $56 major target and $60 secondary.
Swallow Academy

HYPE | Technical & Fundamental OutlookDescription:
HYPE shows strong market activity with increasing interest in the crypto sector. On the technical side, the chart highlights key support and resistance levels, potential breakout zones, and momentum shifts that traders are closely monitoring. From a fundamental perspective, HYPE positions itself as an innovative project with growing community attention and expanding ecosystem utility.
This outlook is for educational purposes only and should not be considered financial advice. Always do your own research and manage risk responsibly before making any investment decisions.
#HYPE #Crypto #TechnicalAnalysis #Trading #Blockchain #MarketUpdate #Altcoins #CryptoTrading #PriceAction #ChartAnalysis

HYPE Holds $45 Support as Bulls Eye New All-Time HighHYPECOIN has shown strong resilience after rebounding from the $40 daily support, a zone backed by VWAP confluence from a prior swing low. The structure now points toward the potential start of a powerful wave-3 impulse if the $45 region continues to hold.
HYPECOIN’s recent price behavior highlights a textbook reaction from a high-confluence support cluster. Following a decisive rebound off $40, price has re-entered value acceptance and is preparing for a possible expansion phase. Market structure remains intact, and current consolidation may represent a healthy corrective phase before another impulsive leg to the upside.
Key Technical Points
- Support Region: $45 daily level aligns with VWAP and 0.618 Fibonacci retracement.
- Structure: Potential wave-2 correction setting up for wave-3 continuation.
- Target Zone: Next major objective sits near $2.90, representing previous swing-high extension.
After defending $40, HYPECOIN reclaimed the lower value area, confirming strong market participation from bulls. This move coincided with a VWAP recovery pulled from the prior low, signaling volume-backed strength at structural support. The ongoing retest at $45 is a crucial technical checkpoint.
This region not only coincides with the local VWAP pool but also aligns with the 0.618 Fibonacci level, creating a dense confluence cluster that typically serves as a foundation for continuation rallies. Price action maintaining above $45 confirms the wave-2 correction thesis and builds the setup for a broader wave-3 impulse move.
Volume distribution patterns show balanced accumulation with an emerging equilibrium around the point of control (POC). Such equilibrium phases often precede volatility expansion, suggesting that HYPECOIN could be gearing up for another leg higher.
What to Expect in the Coming Price Action
As long as HYPECOIN holds above the $45 support confluence, the market remains primed for a continuation toward $2.90 and potentially new all-time highs. Sustained volume influx and higher-timeframe closes above VWAP will be key confirmations of a breakout in progress.

HyperLiquid Bounces From Key Fibonacci Level, Targets $53–$59HyperLiquid has defended its $42 support zone, showing strong confluence with the 0.618 Fibonacci retracement and daily structure. Momentum suggests higher targets may be in play.
Introduction: Following a sharp correction, HyperLiquid (HLP) has stabilized near $42, which has acted as both Fibonacci and structural support. This bullish reaction now sets the stage for continuation higher.
Key Technical Points:
- Strong bounce off $42 confluence zone.
- Bullish retest confirmed after multiple defenses of support.
- Next upside targets are $53 and $59.
The $42 marker has been defended multiple times, providing confirmation of a high-confluence region. Price action reclaiming momentum from this level suggests a bullish retest is complete.
With trend structure holding, immediate upside objectives sit at $53 and possibly $59, provided the larger value area low is reclaimed. Lower timeframe structure remains constructive, showing higher lows forming, which adds strength to the bullish case.
What to Expect in the Coming Price Action:
If buyers maintain momentum, continuation toward $53 is likely. A stronger rally could push extension targets to $59, but losing $42 would shift bias back to bearish.
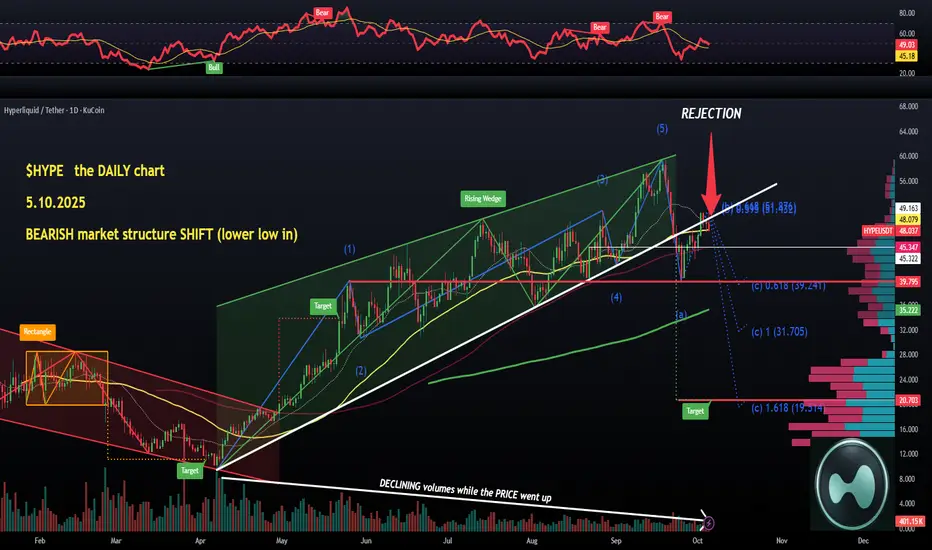
$HYPE (1-D): BEARISH market structure shift, RISING WEDGE retestGETTEX:HYPE is just looking like a disaster waiting to happen, I have been very bearish on it ever since $ASTER stepped into the DEX game, you know that if you read my analyses regularly.
I called for a crash at $55-56 due to the RISING WEDGE accompanied by recurring RSI bear divergences. I even shorted it after the pattern's BREAKDOWN and that was WAVE A, which played out perfectly dropping a touch below the $40 mark.
Then we obviously had WAVE B (which in Elliot's Wave Theory is a 'dead cat bounce', in most cases). That pushed the price above $50 briefly, bull-trapped a lot of people, and gave us a bearish retest of the RISING WEDGE breakdown.
WAVE A also established a lower low, and if the WAVE B is complete (lower high!), then we can call it a BEARISH market structure.
So now it would be a WAVE C which is a proper correction with the initial target of $39.25 (huge amounts of LIQUIDATIONS below $40, see the attached heatmap). Other targets are: $31.7 and $20 (which is also the WEDGE breakdown target, coincidence?).
I'm trying hard to find some positives about the DAILY chart, there is literally nothing. Even the volumes have been falling like a stone from April (when #hype started its uptrend from $9.3). I call that BEARISH volume divergence.
I'm not even gonna go into the upcoming unlocks again, or the impact of #aster and its crazy volumes and revenues.
The DAILY is just a disaster, and I'm really tempted to hunt for a short here. Not on Sunday, though.
Patience💙👽
HYPERLiquid – Support at $45 with Upside Targets at $45–$56HYPERLiquid is defending its $45 support zone after a steep corrective decline. Bulls are eyeing upside targets between $45 and $56 as momentum begins to stabilize.
Despite enduring a sharp downtrend, HYPERLiquid has found a crucial floor at $0.45. This level is now pivotal in determining whether a bottom can form, allowing for renewed bullish attempts toward major resistance zones.
Key Technical Points:
- Critical support established at $45.
- Upside targets include $45 and $53, with $56 acting as a liquidity magnet.
- Point of control sits above current levels, reinforcing $56 as a key destination.
The recent decline in HYPERLiquid has been both steep and corrective, leaving the market searching for stability. Support at $45 represents a line in the sand for buyers. Holding this level opens the door to significant upside rotations, with $45 as the first major target. Above this, the $53 resistance level presents a tougher barrier, while the $56 point of control remains a magnet for price action.
Liquidity pools above current levels suggest that buyers will likely attempt to drive the asset higher once downside pressure eases. Failure to hold $45, however, would undermine the bullish case and expose deeper retracement zones.
What to Expect in the Coming Price Action:
As long as $45 holds, the probability favors a recovery into $45–$56. A clean break above $53 with strong volume could accelerate this move. Loss of $0.45 would signal further corrective downside.
HYPEGETTEX:HYPE has proven its resilience — despite the recent FUD, price has successfully reclaimed the ascending channel structure. This shows strong underlying demand and market confidence in what I believe is a truly decentralized exchange. My near-term target sits around $65, aligning with the upper boundary of the channel.


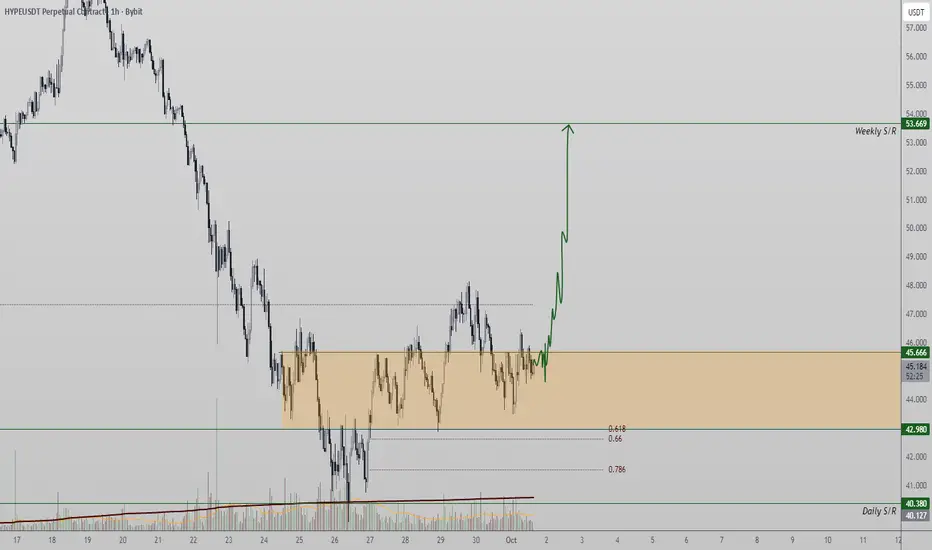
Hypecoin long to $53.6sl: 48.2
tp: 53.6
Conservative long. Hypecoin likely to retest weekly resistance around $53.6
Trend trade

HYPEUSDT.P - September 24, 2025Price has retraced from recent highs and is currently hovering near support around 42.787–39.796 after a sharp pullback. Structure remains bullish overall, with a strong accumulation zone forming above 39.796, suggesting potential for a rebound. Entry is set at 39.796, looking for continuation.
Entry Price: 39.796
Profit Level: 65.025
Stop Level: 29.980
This setup carries low risk and high probability, supported by a clean support base, bullish market structure, and a favorable risk-to-reward ratio.
This is not financial advice. Trading involves risk, and you should always do your own research before making any investment decisions. Manage your risk properly and never trade with money you cannot afford to lose.

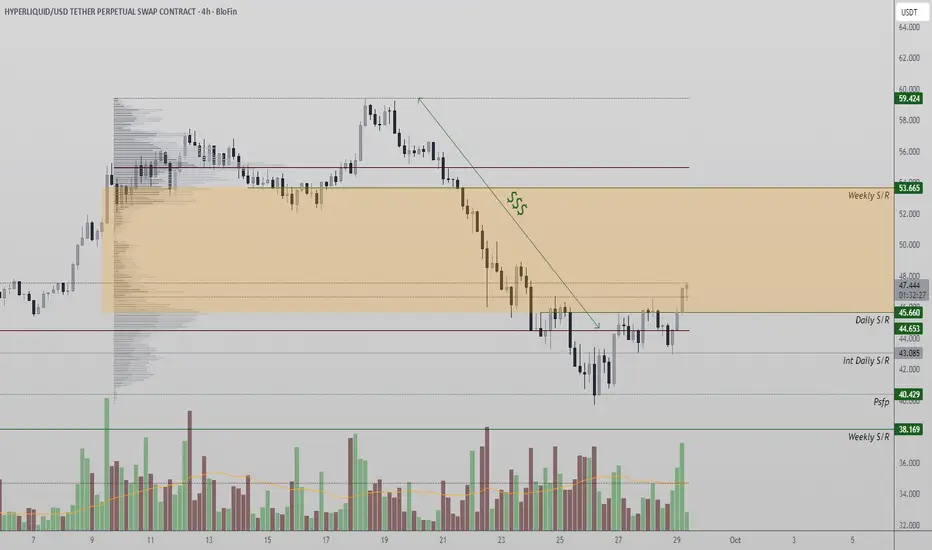
$HYPE has got a TEXT-BOOK BEARISH FLAG (4-hr)GETTEX:HYPE in danger of falling to $25, which would be a projected BEARISH FLAG target, which is fully formed on the 4-HOUR chart.
The lower trendline of the flag around $44.3, so a short trigger order at $43.3 makes sense. And we had a DEATH CROSS too last Friday.
There is nothing bullish about neither the DAILY or this 4-hour chart. Apart from the RSI momentum which has been healthy after a couple of BULL DIVERGENCES last week.
So for entry, I would need some BEAR rsi divergences first, even if the flags starts breaking out nicely.
👽💙

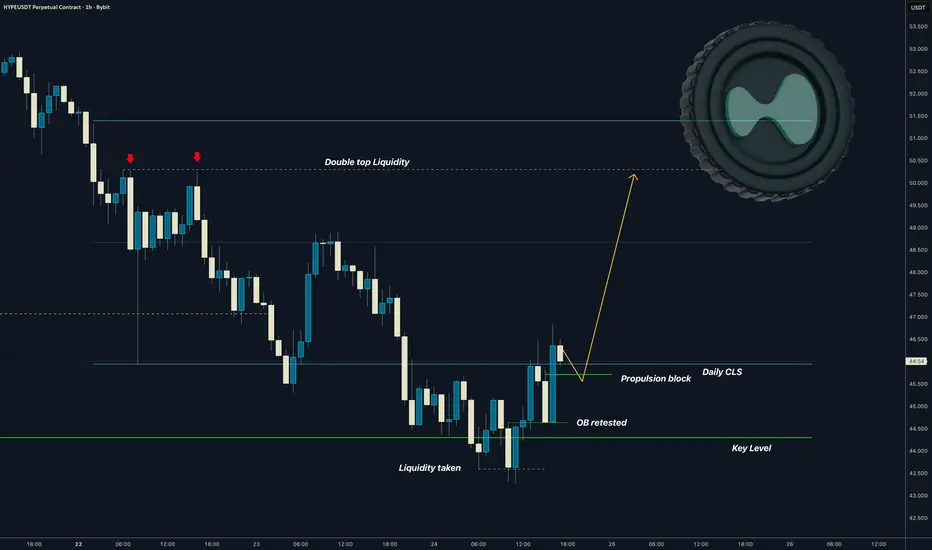
HYPE I Daily Range, Manipulated - Followed by OB - expansionNice manipulation of the daily CLS range. Followed by the change in the order flow.
We are also back in the range. I see a potential to the the 50% of the CLS range.
Then full range.
Everything looks good with the market context and price is in the discount.
I have explained the discounts here
We also have confirmed change in order flow in other words order block to learn more about it visit the thread below
Also liquidity aligns with the setup as I described in the post below
💊 Note: this is just a probability. Win rate of this method is above 70% if you trade it with the right market context.
“Adapt what is useful, reject what is useless, and add what is specifically your own.”
David Perk aka Dave FX Hunter ⚔
Is $HYPE dying off? RISING WEDGE breakdown retestedBad news for GETTEX:HYPE not only due to $ASTER competition but in many other aspects as well.
First of all, the LIQUIDATIONS heatmap from #hype DEX itself. A lot of Liquidity (as in, bull hunting season) trapped below in the last 3 months.
Mid $30s make sense next and that level coincides with the projected target for WAVE C. And all that makes sense due to the ongoing RISING WEDGE breakdown which has just been retested over the weekend.
So, no longs for me, this is just bearish, lower lower, now certainly a lower high, bear OBV and RSI divergences that confirmed/predicted the bearish market structure flip.
No longs, I would rather find a short position if BITCOIN dominance starts running above 59%.👽💙
GETTEX:HYPE is dying on the DAILY, this is just a fact

Hype LongThe trade thesis is to go long (buy) HYPEUSDT near the current price around $45.4, as the price holds above support within an established upward channel and at key Fibonacci retracement levels.
Take profit is set at $85, which aligns with a major Fibonacci extension (around 4.236) and the upper boundary of the channel, aiming for a strong upside move if the trend continues.
Stop loss is strictly placed at $41.08, just below the lower trendline and beneath important Fibonacci retracement support, to limit risk if momentum fails.
The trading plan benefits from confluence between the Fibonacci retracement/support zones and the channel structure, making it a technically robust setup with a favorable risk-reward ratio.

HYPE Analysis (12H)Before anything else, pay attention to the timeframe.
It seems we have a dual bullish phase on the chart, where the second phase is a triangle, and the price is likely to soon enter wave D of this second phase. The second phase is indeed a triangle.
Within the red-marked zone, we can look for sell/short setups.
You should aim for a reasonable profit target and manage your risk accordingly.
A daily candle close above the invalidation level will nullify this analysis.
For risk management, please don't forget stop loss and capital management
Comment if you have any questions
Thank You

BUY AND HOLDHello friends
You can see that the price is in an ascending channel and has made a fake breakout to remove short-term buyers, but in reality this is just a price correction and there is no need to worry, and in a price correction you can buy in steps with capital and risk management and move with it to the specified goals.
Note that the holding period is at least 3 months, so be patient and observe capital management.
*Trade safely with us*

HyperLiquid Bounces from Key Confluence Zone, Eyes $53 UpsideHyperLiquid (HYPE/USDT) has recently displayed a strong reaction at a high-confluence support level, drawing the attention of traders and technical analysts. The market structure suggests that this region could provide the foundation for another bullish phase if defended on a closing basis. The combination of Fibonacci retracement and VWAP SR provides credibility to the support zone and raises the probability of continuation to the upside.
Key Technical Points
- Confluence Support: The 0.618 Fibonacci retracement and VWAP SR overlap to create a strong
technical base.
- Upside Target: A bullish rotation could extend toward $53if the level holds.
- Closing Basis Crucial: Sustained closes above support are needed to validate the bullish
scenario.
HyperLiquid’s price action showed clear respect for historical support, with buyers stepping in decisively at the 0.618 Fibonacci zone. This area often signals exhaustion of a bearish move, and the market’s immediate reaction reinforces its technical importance. Coupled with the VWAP SR, this support now acts as a pivot that could shape short-term momentum.
From a structural standpoint, the rebound highlights a shift in control back toward buyers. The $53 level has been identified as the near-term bullish objective, aligning with prior supply zones. If momentum strengthens, it could act as a magnet for price action in the coming sessions. However, the technical setup is conditional: a sustained close below this support would invalidate the bullish thesis and expose deeper liquidity levels.
Volume analysis will be critical in determining the validity of this move. An uptick in demand alongside this bounce would reinforce the bullish case, signaling that buyers are committed to defending the level. Without this confirmation, the move risks being a short-lived relief rally rather than the start of a new leg higher.
What to Expect in the Coming Price Action
If HyperLiquid maintains support above the 0.618 Fibonacci and VWAP SR, the probability of a rally toward $53 increases significantly. Traders will be watching for confirmation through volume and higher closes. Failure to hold this region would expose the market to further downside, but the current setup favors upside continuation.

HYPE/USDT - Daily Trendline Retest at Demand ZoneHYPE has pulled back into a confluence support: the rising daily trendline + a prior demand box (~40–42). The selloff has been sharp, but structure still prints higher lows since June. A hold/reclaim of this zone would set up a relief leg toward the mid-range and previous swing highs.
Trade idea (swing)
Bias: Long, expecting a bounce from the trendline/demand.
Entry: 41.0–42.5 (spot or staged); add on a liquidity sweep into 39.5–40.5 if wicks appear and price reclaims 41.
Invalidation: Daily close below 36.0–36.5 (break of trendline+demand = exit).
Targets: 46 → 49.5 → 52.5 → 56–57 → 61–62
Risk: Size small (1–2% risk). If invalidated, step aside and reassess at 34–35.
Why I like it
Confluence of support (trendline + demand box).
Aggressive selloff into support increases chance of a reflex bounce.
Clear invalidation below the box keeps RR attractive.
Notes
I’m not chasing; I want confirmation (4H reclaim of 42 or strong wick rejection) before adding.
This is not financial advice. Manage risk and respect your stop.

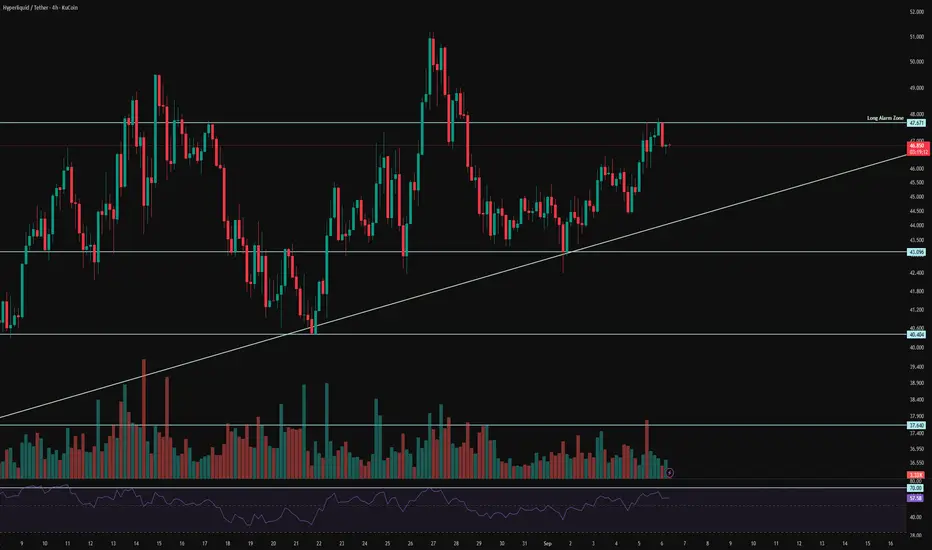
HYPE 4H Analysis - Key Triggers Ahead💀 Hey , how's it going ? Come over here — Satoshi got something for you !
⏰ We’re analyzing HYPE on the 4-Hour timeframe .
👀 On the 4H timeframe for HyperLiquid coin, we can see that the project is managed by the decentralized HyperLiquid exchange, which has become one of the notable platforms these days and has strong backing. Shortly after the news, the coin started moving toward its resistance but got rejected with a whale 4H candle from the $4,767 zone. Compared to other coins, this one has held up quite well and hasn’t gone through a deep correction. Yesterday’s rejection zone after the NFP news serves as a solid trigger point and even gives us a tight stop-loss setup.
⚙️ The key RSI level for HyperLiquid is around 70, which is the Overbought threshold. If RSI pushes beyond this zone, HyperLiquid could continue upward. Another point is that the coin’s recent price action has been moving along a trendline and has held well above the 50 level for several days.
🕯 The volume and size of HyperLiquid’s green candles have increased, showing strong upward momentum. Each time it forms a higher low, buyers respect the level and push in more volume. Based on this behavior and the previous leg up, the coin is now close to its all-time high, and with market strength, it has the potential to break that level and move higher.
📊 Looking at HyperLiquid vs. Bitcoin, there isn’t a chart available on TradingView, but you can see it on CoinMarketCap. HyperLiquid is a whale-favorite coin and has shown strong bullish performance against Bitcoin, moving steadily upward.
🔔 The alert zone for HYPE is at $47.67. If this level breaks, the coin could start a strong bullish move and head toward its all-time high.
❤️ Disclaimer : This analysis is purely based on my personal opinion and I only trade if the stated triggers are activated .
Hyperliquid Eyes 13% Surge, Targeting Strong $65 ResistantHello✌️
Let’s analyze Hyperliquid’s price action both technically and fundamentally 📈.
🔍Fundamental analysis:
Approval of USDH on Hyperliquid could lock $6.1B daily stablecoin volume into HYPE’s ecosystem, boosting fees and token demand. Monthly buybacks remove ~1.76M HYPE, adding scarcity. 🔥
📊Technical analysis:
Hyperliquid is trading within a strong ascending channel, sitting near key support and the daily trendline. The setup suggests a potential upside of around 13%, targeting $65. 🔥
📈Using My Analysis to Open Your Position:
You can use my fundamental and technical insights along with the chart. The red and green arrows on the left help you set entry, take-profit, and stop-loss levels, serving as clear signals for your trades.⚡️ Also, please review the TradingView disclaimer carefully.🛡
✨We put love into every post!
Your support inspires us 💛 Drop a comment we’d love to hear from you! Thanks, Mad Whale

HYPE price analysisYesterday we looked at the possible prospects of #Aster, and today let’s dive into the chart of #Hype 📉
🔥 5 consecutive red daily candles on OKX:HYPEUSDT.P — something we haven’t seen for a long time.
And there are plenty of reasons for that. We’ll name just a few, and you can add more in the comments 👇
📉 Start of a broader correction on the crypto market
⚡️ #HYPE with 300x leverage on Aster DEX, while on Hyperliquid there’s only 3x leverage for their native token — a massive imbalance attracting big arbitrage volumes that push the price down
📰 A strong media campaign “Why Aster is better than Hype” → a clear example of dirty play by big money
💡 That’s why a bounce of #HYPE from $40 shows there’s still powder in the barrels.
From $36 — also fine, a retest of the first ATH.
But a potential fall to $29–30 would trigger a full stop-loss hunt on longs accumulated over the past six months.
❓Where do you think #HYPE will find support — $40, $36, or will it slip to $30?
______________
◆ Follow us ❤️ for daily crypto insights & updates!
🚀 Don’t miss out on important market moves
🧠 DYOR | This is not financial advice, just thinking out loud.
