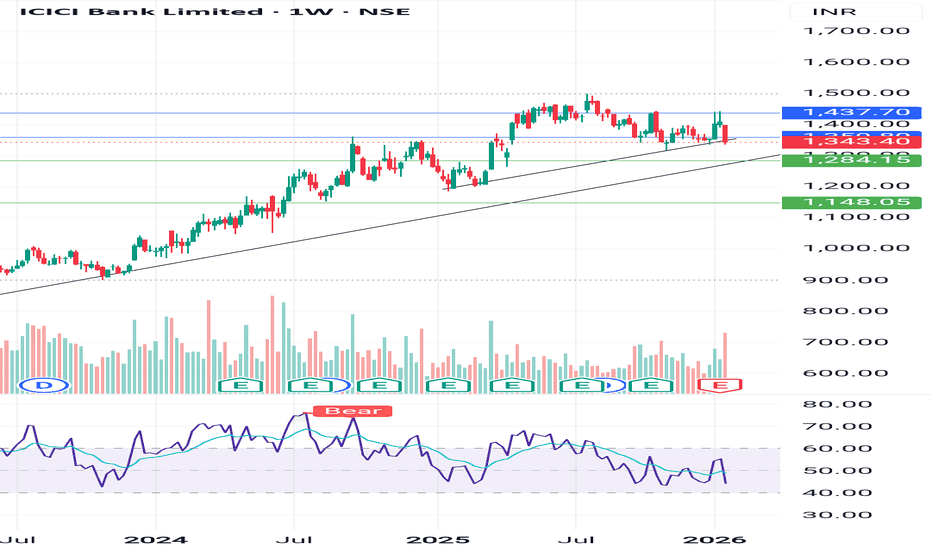
NSE – NIFTY 750 | ICICI Bank | 05 Feb 2026Intro:
Monthly structure overview of ICICI Bank as part of the NIFTY 750 Structure Census.
Structure:
Long-term impulse structure intact
Rising structural support held across major cycles
Current phase: higher-level consolidation near trend highs
Disclaimer:
This is a structural update
ICICI Bank Limited Sponsored ADR
No trades
Next report date
—
Report period
—
EPS estimate
—
Revenue estimate
—
1.71 USD
6.04 B USD
34.66 B USD
3.57 B
About ICICI Bank Limited
Sector
Industry
CEO
Sandeep Bakhshi
Website
Headquarters
Mumbai
Founded
1955
IPO date
Sep 24, 1997
Identifiers
3
ISIN US45104G1040
ICICI Bank Ltd. engages in the provision of banking and financial services, which includes retail banking, corporate banking, and treasury operations. It operates through the following segments: Retail Banking, Wholesale Banking, Treasury, Other Banking, Life Insurance, and Others. The Retail Banking segment includes exposures of the bank, which satisfy the four qualifying criteria of regulatory retail portfolio as stipulated by the Reserve Bank of India guidelines on the Basel III framework. The Wholesale Banking segment deals with all advances to trusts, partnership firms, companies, and statutory bodies, by the Bank which are not included in the Retail Banking segment. The Treasury segment handles the entire investment portfolio of the bank. The Other Banking segment comprises leasing operations and other items not attributable to any particular business segment of the bank. The Life Insurance segment represents results of ICICI Prudential Life Insurance Company Limited. The Others segment include ICICI Home Finance Company Limited, ICICI Venture, ICICI International Limited, ICICI Securities Primary Dealership Limited, ICICI Securities Limited, ICICI Securities Holdings Inc., ICICI Securities Inc., ICICI Prudential Asset Management Company Limited, ICICI Prudential Trust Limited, ICICI Investment Management Company Limited, ICICI Trusteeship Services Limited, and ICICI Prudential Pension Funds Management Company Limited. The company was founded in 1955 and is headquartered in Mumbai, India.
Related stocks
ICICI Bank - Support at Trendline & EMA Junction"While ICICI Bank remains in a long-term uptrend, several factors suggest caution in the short to medium term. The price is currently testing a major multi-month rising trendline, but the negative RSI divergence on the weekly timeframe is a significant red flag, indicating weakening bullish momentum
ICICI Bank | Gann Square of 9 Intraday Case Study | 06 Apr 2023This chart presents a classical WD Gann Square of 9 intraday setup, where price completed its normal capacity early in time, leading to a high-probability reversal.
On 06 April 2023, ICICI Bank started gaining upside momentum from the third 15-minute candle.
The intraday low at ₹875 was selected
ICICI Bank Ltd | Downtrend Breakout with Fibonacci SupportICICI Bank Ltd | Downtrend Breakout with Fibonacci Support
ICICI Bank Ltd has broken out of its prevailing downtrend, with price decisively crossing and sustaining above the descending trendline. The stock is also holding well above the 0.5 Fibonacci retracement level, which strengthens the bullish
ICICIBANK "W" Pattern Reversal at Multi-Week Support | Bullish SICICIBANK "W" Pattern Reversal at Multi-Week Support | Bullish Reversal Setup
━━━━━━━━━━━━━━━━━━━━━━━━━━━━━━━━━━━━━━━━━━━
📊 TECHNICAL SETUP
Current Price: 1,343.90 (+0.44%)
Timeframe: Weekly (1W)
Symbol: ICICIBANK (ICICI Bank Limited)
Exchange: NSE
Category: Stock / Banking Sector
━━━━━━━━━━━━━━━━━━
ICICI BANKICICI Bank Ltd., incorporated in the year 1994, is a banking company (having a market cap of Rs 9,93,046.55 Crore).
ICICI Bank Ltd. key Products/Revenue Segments include Interest & Discount on Advances & Bills, Income From Investment, Interest On Balances with RBI and Other Inter-Bank Funds and Inte
See all ideas
Summarizing what the indicators are suggesting.
Neutral
SellBuy
Strong sellStrong buy
Strong sellSellNeutralBuyStrong buy
Neutral
SellBuy
Strong sellStrong buy
Strong sellSellNeutralBuyStrong buy
Neutral
SellBuy
Strong sellStrong buy
Strong sellSellNeutralBuyStrong buy
An aggregate view of professional's ratings.
Neutral
SellBuy
Strong sellStrong buy
Strong sellSellNeutralBuyStrong buy
Neutral
SellBuy
Strong sellStrong buy
Strong sellSellNeutralBuyStrong buy
Neutral
SellBuy
Strong sellStrong buy
Strong sellSellNeutralBuyStrong buy
Displays a symbol's price movements over previous years to identify recurring trends.
I
75IHFCL30
ICICI Home Finance Co. Ltd. 7.5% 08-NOV-2030Yield to maturity
8.45%
Maturity date
Nov 8, 2030
I
802IHFCL30
ICICI Home Finance Co. Ltd. 8.02% 10-JUN-2030Yield to maturity
8.00%
Maturity date
Jun 10, 2030
I
725ICICI31
ICICI Home Finance Co. Ltd. 7.25% 12-AUG-2031Yield to maturity
7.34%
Maturity date
Aug 12, 2031
I
807IHFCL27
ICICI Home Finance Co. Ltd. 8.07% 01-OCT-2027Yield to maturity
6.35%
Maturity date
Oct 1, 2027
I
781IHFCL28
ICICI Home Finance Co. Ltd. 7.81% 12-APR-2028Yield to maturity
5.67%
Maturity date
Apr 12, 2028
I
802IHFC29
ICICI Home Finance Co. Ltd. 8.02% 19-APR-2029Yield to maturity
5.60%
Maturity date
Apr 19, 2029
I
US45112FAJ57
ICICI Bank Ltd. (Dubai Branch) 4.0% 18-MAR-2026Yield to maturity
4.36%
Maturity date
Mar 18, 2026
I
US45112FAM86
ICICI Bank Ltd. (Dubai Branch) 3.8% 14-DEC-2027Yield to maturity
4.32%
Maturity date
Dec 14, 2027
I
734IHFCL28
ICICI Home Finance Co. Ltd. 7.3388% 24-JUL-2028Yield to maturity
—
Maturity date
Jul 24, 2028
See all IBN bonds


