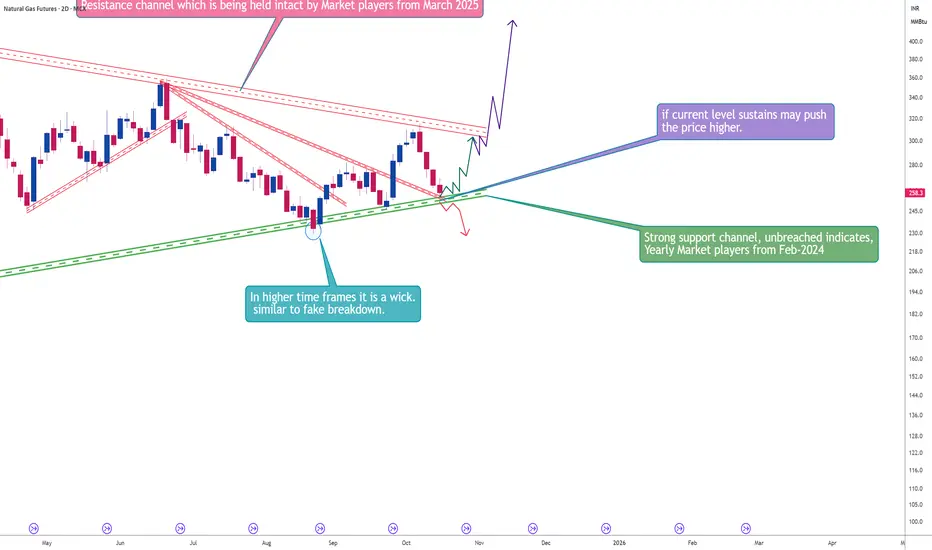
A Case Study : NaturalGas Probable price projectionMarket Participants play the role of
1. price discovery
2. shift in the trends and change of cycles
3. Value rotation among different asset classes
Market players like Yearly, Halfyearly, Quarterly, Monthly, weekly, Daily, Hourly, and Intraday participants who trade during certain time ranges.
Contract highlights
Related commodities
GASNatural Gas
- Double Top as an corrective pattern in Long Time Frame
- Change of Characteristics
- RSI - Divergence
- Resistance Level
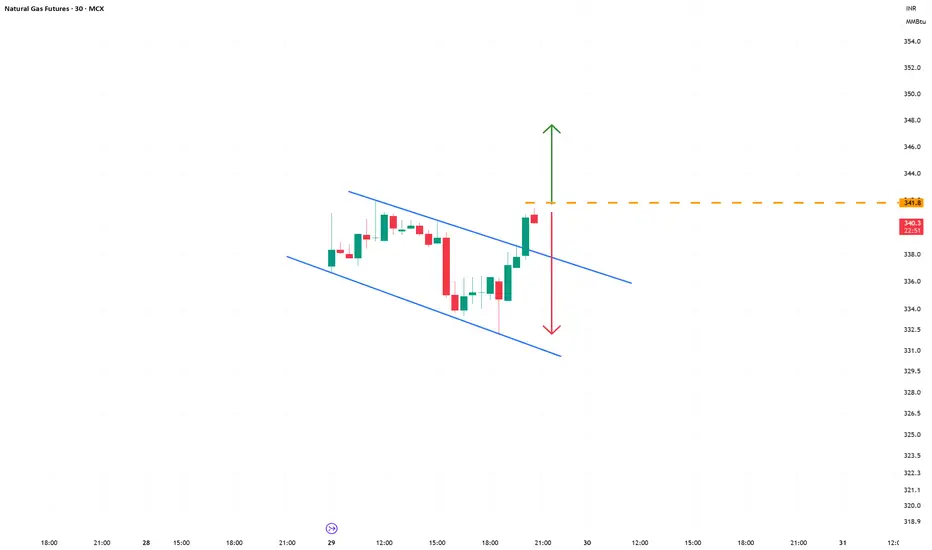
- Symmetrical Triangle in Short Time Frame

NATGAS CORRECTION AHEAD|SHORT|
✅NATGAS after rallying into a high-timeframe supply level, price shows signs of exhaustion and potential mitigation before retracement. Liquidity sits below the recent swing lows. Time Frame 5H.
SHORT🔥
✅Like and subscribe to never miss a new idea!✅

NG1!: Local Bearish Bias! Short!
My dear friends,
Today we will analyse NG1! together☺️
The market is at an inflection zone and price has now reached an area around 4.121 where previous reversals or breakouts have occurred.And a price reaction that we are seeing on multiple timeframes here could signal the next move down so we

Gold | Oil | Dollar | Silver | Natural Gas Price ForecastGold | Oil | Dollar | Silver | Natural Gas Price Forecast
NYMEX:NG1! COMEX:GC1! COMEX:SI1! AMEX:UNG

Gold | Oil | Dollar | Silver | Natural Gas Price ForecastGold | Oil | Dollar | Silver | Natural Gas Price Forecast
AMEX:BOIL AMEX:KOLD NYMEX:CL1! COMEX:GC1!

NATGAS Short From Supply Area! Sell!
b]Hello,Traders!
NATGAS is approaching a major horizontal supply area, where strong selling pressure may reappear. A rejection from this zone could trigger a short-term correction toward lower liquidity pools. Time Frame 5H.
Sell!
Comment and subscribe to help us grow!
Check out other forecasts

NG1!: Next Move Is Up! Long!
My dear friends,
Today we will analyse NG1! together☺️
The market is at an inflection zone and price has now reached an area around 3.348 where previous reversals or breakouts have occurred.And a price reaction that we are seeing on multiple timeframes here could signal the next move up so we
NATGAS: Short Trade Explained
NATGAS
- Classic bearish formation
- Our team expects pullback
SUGGESTED TRADE:
Swing Trade
Short NATGAS
Entry - 3.337
Sl - 3.372
Tp - 3.272
Our Risk - 1%
Start protection of your profits from lower levels
Disclosure: I am part of Trade Nation's Influencer program and receive a mont

See all ideas
Summarizing what the indicators are suggesting.
Neutral
SellBuy
Strong sellStrong buy
Strong sellSellNeutralBuyStrong buy
Neutral
SellBuy
Strong sellStrong buy
Strong sellSellNeutralBuyStrong buy
Neutral
SellBuy
Strong sellStrong buy
Strong sellSellNeutralBuyStrong buy
A representation of what an asset is worth today and what the market thinks it will be worth in the future.
Displays a symbol's price movements over previous years to identify recurring trends.
Frequently Asked Questions
The current price of Austrian CEGH VTP Natural Gas Futures is 27.855 EUR / MWH — it has risen 0.61% in the past 24 hours. Watch Austrian CEGH VTP Natural Gas Futures price in more detail on the chart.
Track more important stats on the Austrian CEGH VTP Natural Gas Futures chart.
The nearest expiration date for Austrian CEGH VTP Natural Gas Futures is May 30, 2028.
Traders prefer to sell futures contracts when they've already made money on the investment, but still have plenty of time left before the expiration date. Thus, many consider it a good option to sell Austrian CEGH VTP Natural Gas Futures before May 30, 2028.
Open interest is the number of contracts held by traders in active positions — they're not closed or expired. For Austrian CEGH VTP Natural Gas Futures this number is 0.00. You can use it to track a prevailing market trend and adjust your own strategy: declining open interest for Austrian CEGH VTP Natural Gas Futures shows that traders are closing their positions, which means a weakening trend.
Buying or selling futures contracts depends on many factors: season, underlying commodity, your own trading strategy. So mostly it's up to you, but if you look for some certain calculations to take into account, you can study technical analysis for Austrian CEGH VTP Natural Gas Futures. Today its technical rating is sell, but remember that market conditions change all the time, so it's always crucial to do your own research. See more of Austrian CEGH VTP Natural Gas Futures technicals for a more comprehensive analysis.