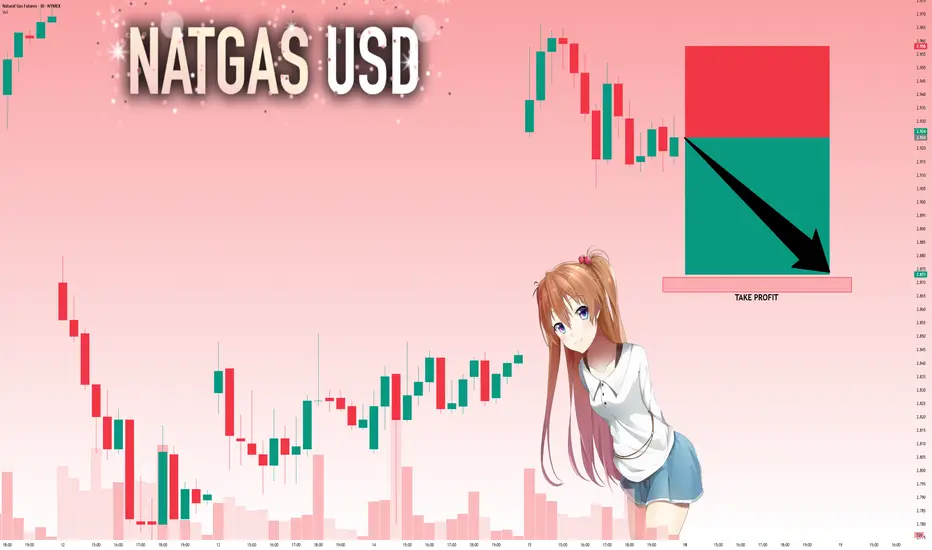
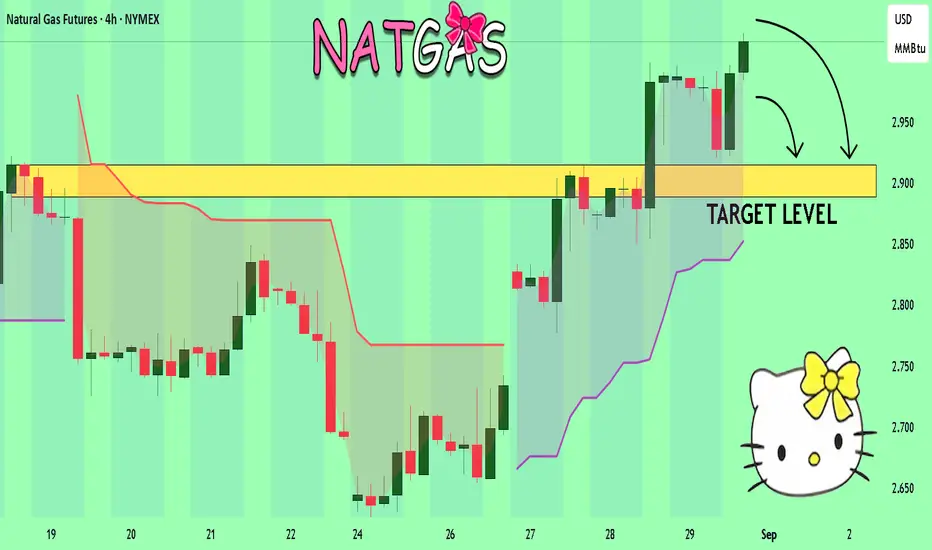
NATGAS SHORT FROM RESISTANCE|
✅NATGAS is set to retest a
Strong resistance level above at 2.945$
After a local bullish correction
Which makes a bearish pullback a likely scenario
With the target being a local support below at 2.80$
SHORT🔥
✅Like and subscribe to never miss a new idea!✅
AVMM2026 trade ideas

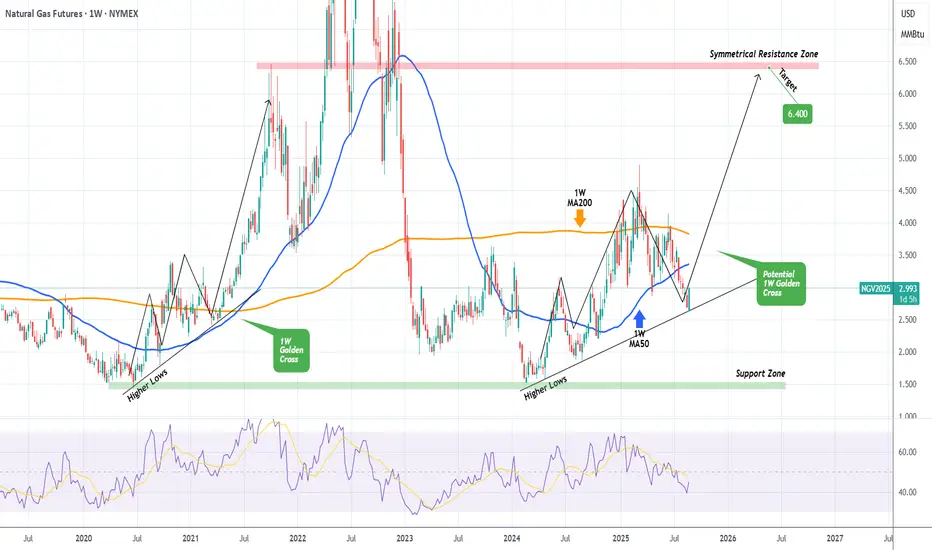
NATURAL GAS rebounding on a 1.5-year Support! Bullish.Natural Gas (NG1!) is having a strong green 1W candle, coming off a 2-month decline. It is highly likely that this correction has come to an end as the price hit this hit (and thus rebounding on) the Higher Lows trend-line that started all the way back since the February 20 2024 market bottom.
Technically the whole pattern from that day until now looks similar to the June 22 2020 - March 15 2021 sequence, which initiated a stronger 3rd Bullish Leg all the way to the Symmetrical Resistance Zone.
A potential 1W Golden Cross would confirm this upward break-out, just like it did on June 14 2021.
If that takes place, our long-term Target would be 6.400 (Symmetrical Resistance Zone).
-------------------------------------------------------------------------------
** Please LIKE 👍, FOLLOW ✅, SHARE 🙌 and COMMENT ✍ if you enjoy this idea! Also share your ideas and charts in the comments section below! This is best way to keep it relevant, support us, keep the content here free and allow the idea to reach as many people as possible. **
-------------------------------------------------------------------------------
💸💸💸💸💸💸
👇 👇 👇 👇 👇 👇
Nat Gas LongNG1! is now net long a regression break.
The roll on this commodity is (-0.008%) This might be good for a little move for a couple of days. Summer is ending today.
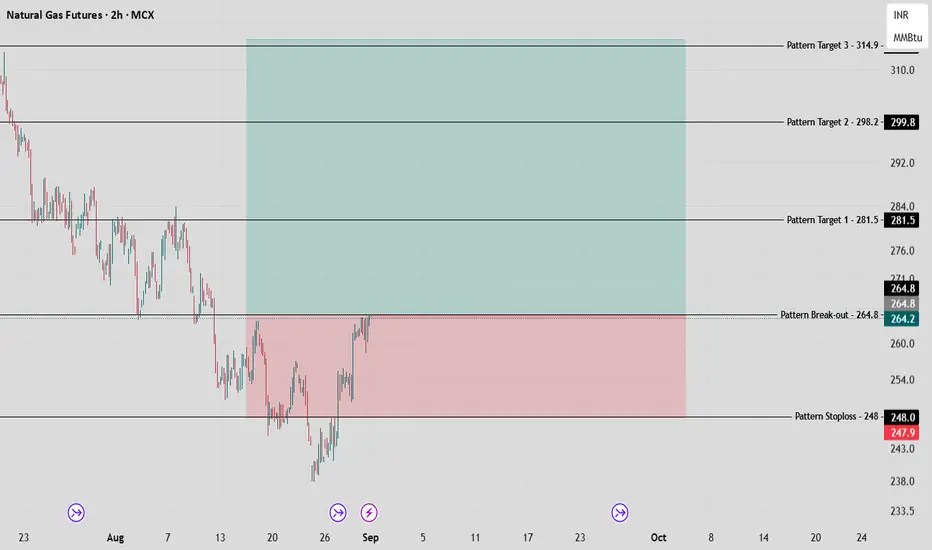
Natural Gas Positional Giant Lap Awaited in Coming Days! MCX:NATURALGAS1! Natural Gas Futures have printed a strong bullish engulfing pattern on the weekly chart, emerging after a prolonged downtrend—a classic sign that momentum may be shifting in favor of the bulls.
Pattern & Setup Analysis
The appearance of a large green candle fully engulfing the previous week's red candle signals growing buying pressure and potential trend reversal.
This move occurs at the end of a multi-week decline, making it a significant bullish reversal setup—especially when found after extended selling.
Trading Setup Logic
Traders watching this pattern often prepare for a trend change or a relief rally, with stops generally placed below the engulfing candle’s low to manage risk.
Upside targets may be set at prior resistance levels or previous swing highs as the price seeks to retrace portions of the earlier decline.
The highlighted box on the chart suggests a favorable risk–reward scenario: risk is limited by the recent lows, while potential reward stretches towards the next major resistance zone.
Strategy Consideration
Conservative participants may await further confirmation via higher weekly closes or a retest of the breakout zone before entering new long positions.
Aggressive traders could already be positioning long, betting on follow-through strength after a decisive reversal candle. Best Entry will be near to the stoploss, and it could come for retest on coming Tuesday, else day basis closing above 264.8 will also be an entry trigger considering the scenario.
Overall, the setup reflects a shift from heavy selling to growing buyer conviction—making the coming weeks critical for confirmation and follow-through on this bullish reversal signal
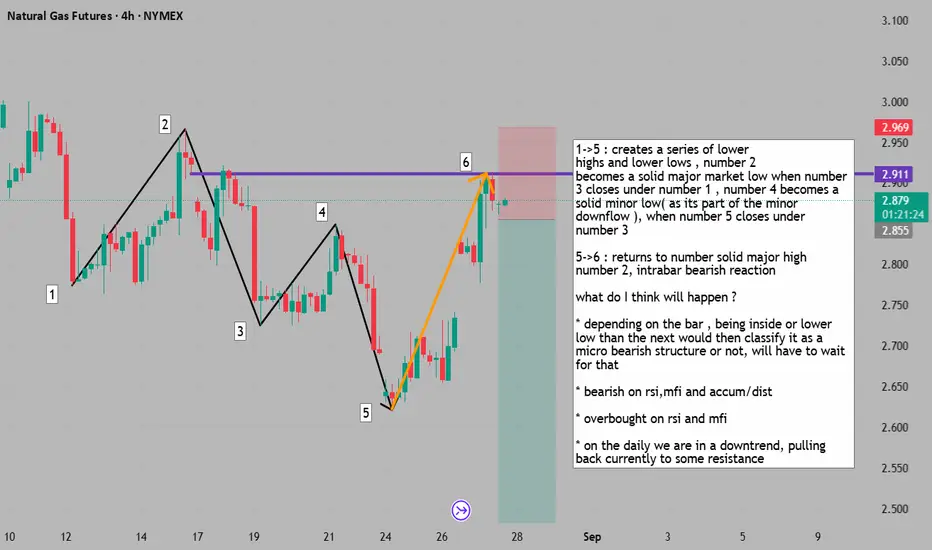
a return to solid major sellers presents a =SELLers world1->5 : creates a series of lower
highs and lower lows , number 2
becomes a solid major market low when number
3 closes under number 1 , number 4 becomes a solid minor low( as its part of the minor downflow ), when number 5 closes under number 3
5->6 : returns to number solid major high number 2, intrabar bearish reaction
what do I think will happen ?
* depending on the bar , being inside or lower low than the next would then classify it as a micro bearish structure or not, will have to wait for that
* bearish on rsi,mfi and accum/dist
* overbought on rsi and mfi
* on the daily we are in a downtrend, pulling back currently to some resistance
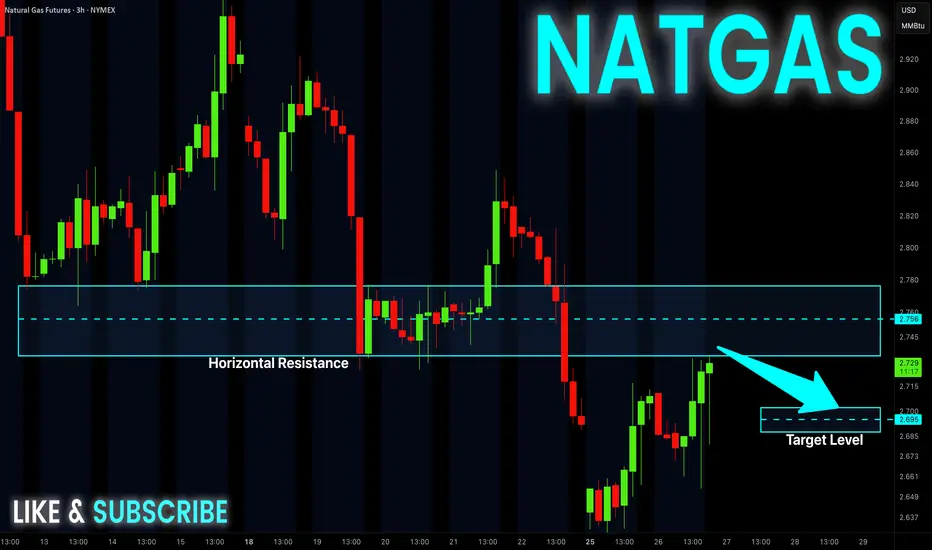
NATGAS Risky Short! Sell!
Hello,Traders!
NATGAS is trading in a
Downtrend and the price
Is making a local rebound
And will soon hit a horizontal
Resistance of 2.76$ from where
A local bearish correction
Is to be expected
Sell!
Comment and subscribe to help us grow!
Check out other forecasts below too!
Disclosure: I am part of Trade Nation's Influencer program and receive a monthly fee for using their TradingView charts in my analysis.
NG1!: Move Down Expected! Short!
My dear friends,
Today we will analyse NG1! together☺️
The market is at an inflection zone and price has now reached an area around 3.022 where previous reversals or breakouts have occurred.And a price reaction that we are seeing on multiple timeframes here could signal the next move down so we can enter on confirmation, and target the next key level of 2.981.Stop-loss is recommended beyond the inflection zone.
❤️Sending you lots of Love and Hugs❤️
Still waiting for 2.22This channel is not providing individualized trading or investment advice, nor is it a banking service, brokerage service, trading service, investment service or money management service

NATGAS: Bearish Forecast & Bearish Scenario
It is essential that we apply multitimeframe technical analysis and there is no better example of why that is the case than the current NATGAS chart which, if analyzed properly, clearly points in the downward direction.
Disclosure: I am part of Trade Nation's Influencer program and receive a monthly fee for using their TradingView charts in my analysis.
❤️ Please, support our work with like & comment! ❤️
NATGAS My Opinion! SELL!
My dear subscribers,
My technical analysis for NATGAS is below:
The price is coiling around a solid key level - 3.016
Bias - Bearish
Technical Indicators: Pivot Points Low anticipates a potential price reversal.
Super trend shows a clear sell, giving a perfect indicators' convergence.
Goal - 2.915
About Used Indicators:
By the very nature of the supertrend indicator, it offers firm support and resistance levels for traders to enter and exit trades. Additionally, it also provides signals for setting stop losses
Disclosure: I am part of Trade Nation's Influencer program and receive a monthly fee for using their TradingView charts in my analysis.
———————————
WISH YOU ALL LUCK
Gold | Oil | Dollar | Silver | Natural Gas Price Forecast Support & Resistance Guide
Natural Gas NYMEX:NG1! stock Bulls AMEX:UNG
USO NYMEX:CL1! Oil Stock price Forecast
DXY US dollar Stock analysis
Gold COMEX:GC1! XAUUSD Stock price Forecast
Silver XAGUSD stock analysis

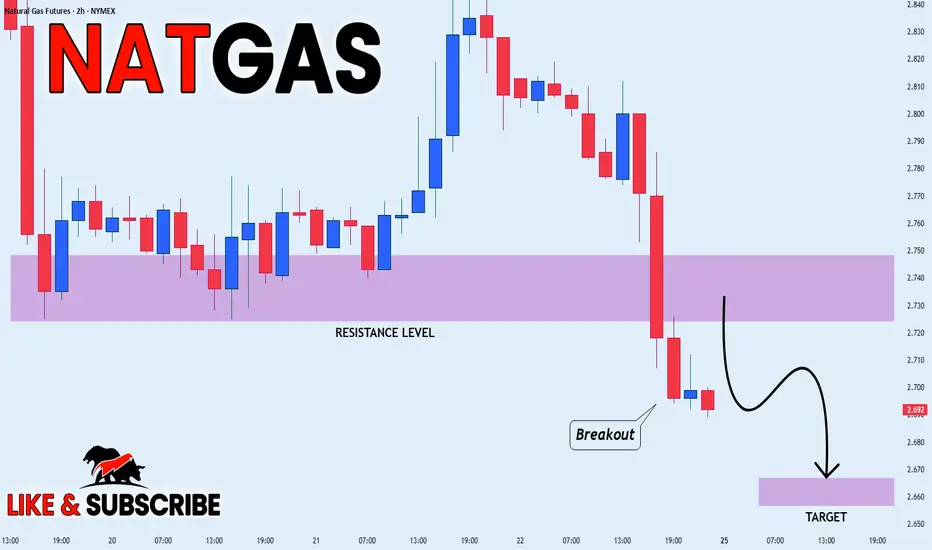
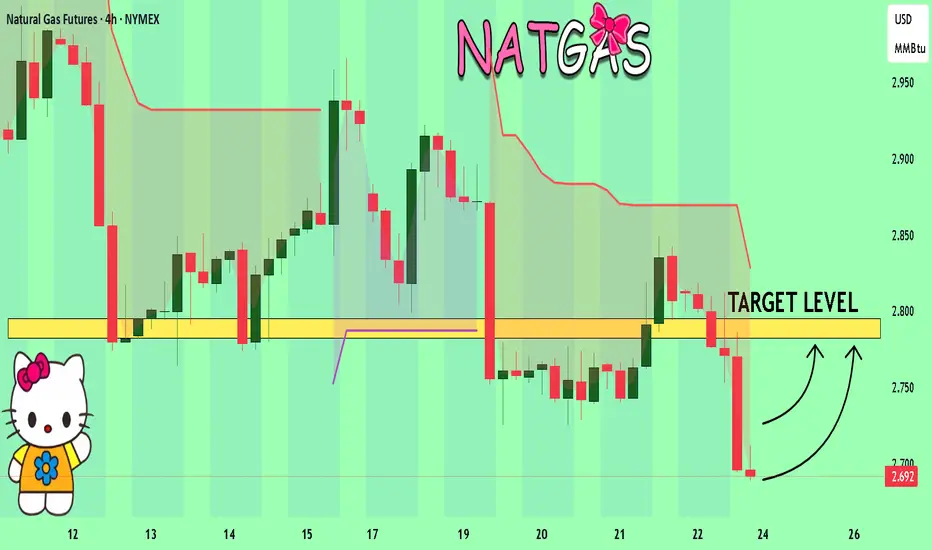
NATGAS WILL KEEP FALLING|SHORT|
✅NATGAS is going down currently
As the Gas broke the key structure level of 2.73$
Which is now a resistance, and after the pullback
And retest, I think the price will go further down
SHORT🔥
✅Like and subscribe to never miss a new idea!✅
Gold | Oil | Dollar | Silver | Natural Gas Price ForecastGold | Oil | Dollar | Silver | Natural Gas Price Forecast
COMEX:GC1!
COMEX:SI1!
AMEX:UNG
NYMEX:CL1!

NGAS: Britain’s AI Seeks Solutions to Its Energy CrisisBy Ion Jauregui – Analyst at ActivTrades
UK Data Centers Turn to Gas as a Quick Fix to the Energy Crisis
Facing mounting challenges in the British power grid, five major data center projects in southern England have formally requested direct connections to the gas pipeline network operated by National Gas, owned by Macquarie. The goal: to set up on-site gas generation plants. According to the Financial Times, the move aims to bypass the “endless” and costly waits for access to the national grid, accelerating the launch of critical facilities powering artificial intelligence (AI).
The requests amount to roughly 2.5 GW of capacity—equivalent to the electricity consumption of millions of households. The urgency is clear: the energy demand of Nvidia’s chips and AI systems far outstrips the capacity of the current grid. While gas is viewed as a temporary measure—eventually serving as backup once full grid connections are secured—it provides a much-needed boost for the fossil fuel industry amid the ongoing energy transition.
The phenomenon is not limited to the UK. In the U.S., Siemens Energy is facing a surge of gas turbine orders due to the data center boom. Likewise, Elon Musk’s xAI relied on natural gas to power its “Colossus” data center in Memphis before grid access was secured, though gas usage was later scaled back once electricity connections stabilized.
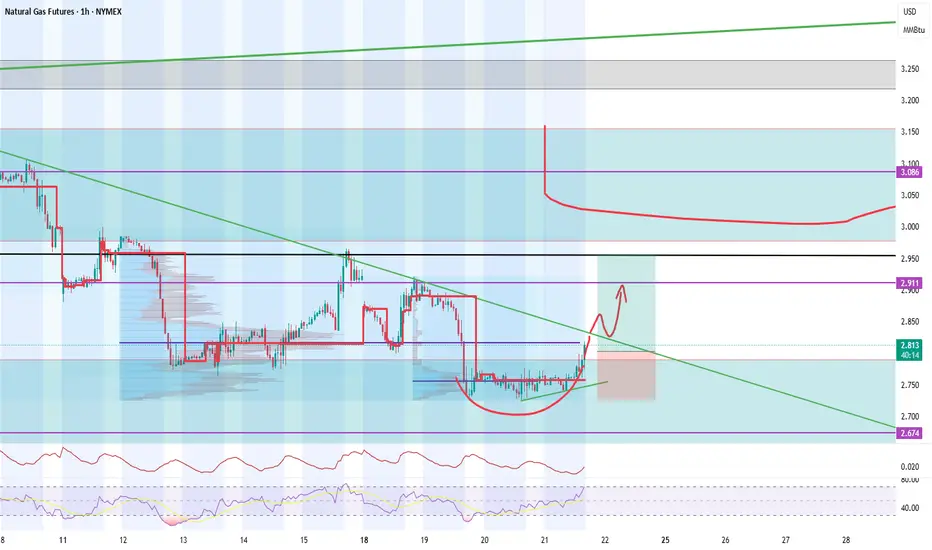
Technical Analysis of NGAS
The current price of NGAS stands at USD 2.813, trading within a structural range established in 2021 between USD 1.520 and USD 4.343, which culminated in the all-time high of USD 9.984. Since March this year, the prevailing trend has been corrective, with a relatively steady decline. On August 6, a “death cross” was confirmed (the 50-day EMA crossing below the 200-day EMA), amplifying downward pressure on the asset.
At present, the price is holding at a key support area, aligned with the Volume Point of Control (POC). Immediate supports lie at USD 2.443 and then USD 2.017—a break below the latter would pave the way for a retest of the range lows. On the upside, the nearest resistance is at USD 3.108; surpassing this level could open a path toward USD 3.600, and in a more ambitious scenario, toward the March highs at USD 4.930, representing a +43% advance from current levels.
Key Indicators
RSI (14): At 38.2, signaling oversold conditions that may support a technical rebound.
MACD: Showing early signs of recovery, with a positive histogram suggesting a potential trend reversal.
Price Action: Early signs of sideways consolidation, though no clear confirmation of a trend change yet.
Probable Scenarios
Bullish: A breakout above USD 3.108 could trigger a rally toward USD 3.600 and eventually USD 4.930.
Bearish: A breakdown below USD 2.443 would expose USD 2.017, with only this level preventing a return to range lows.
Conclusion
NGAS sits at a decisive technical juncture: pressured by a broader bearish structure, yet oversold conditions and positive divergences suggest the potential for a short-term rebound. While contradictory to decarbonization targets, the reliance on gas underscores the growing tension between digital urgency and today’s energy capacity constraints.
*******************************************************************************************
The information provided does not constitute investment research. The material has not been prepared in accordance with the legal requirements designed to promote the independence of investment research and such should be considered a marketing communication.
All information has been prepared by ActivTrades ("AT"). The information does not contain a record of AT's prices, or an offer of or solicitation for a transaction in any financial instrument. No representation or warranty is given as to the accuracy or completeness of this information.
Any material provided does not have regard to the specific investment objective and financial situation of any person who may receive it. Past performance and forecasting are not a synonym of a reliable indicator of future performance. AT provides an execution-only service. Consequently, any person acting on the information provided does so at their own risk. Political risk is unpredictable. Central bank actions can vary. Platform tools do not guarantee success.

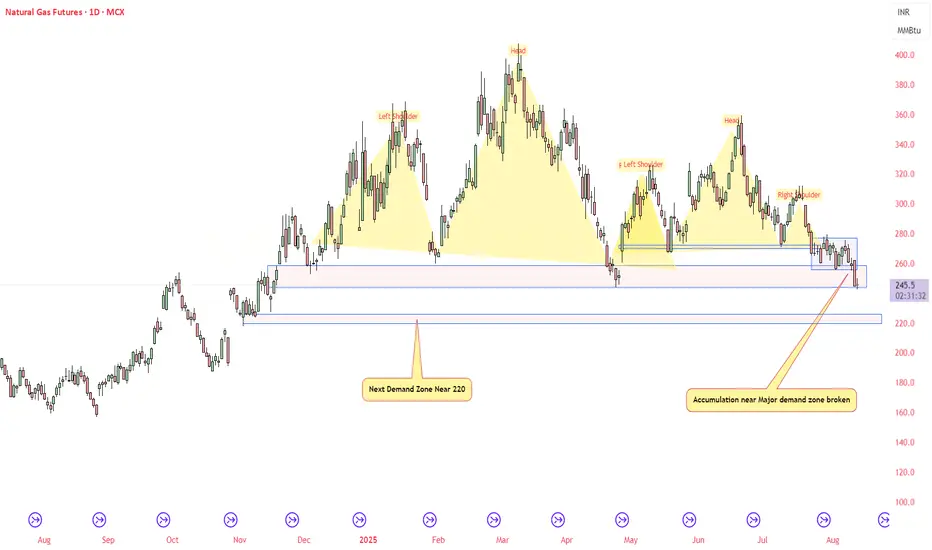
NATURAL GAS - Head and Shoulder PatternNatural Gas being in slow demand may see more bearishness near 220, fresh accumulation near major demand zone broken.
Do your own study before taking any trades
NATGAS - Potential UPI notice a support with a potential accumulation patter for a new phase UP until 3$
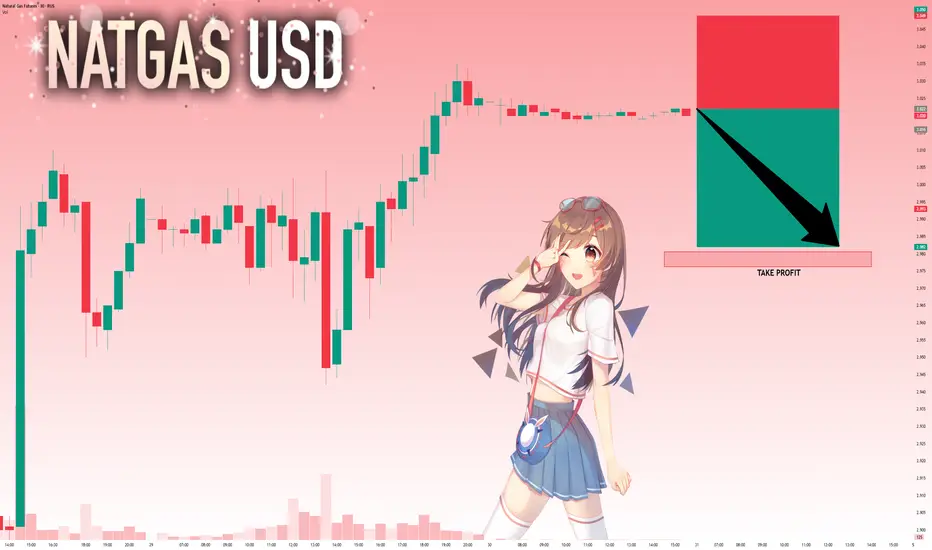
NATGAS: Expecting Bullish Movement! Here is Why:
The charts are full of distraction, disturbance and are a graveyard of fear and greed which shall not cloud our judgement on the current state of affairs in the NATGAS pair price action which suggests a high likelihood of a coming move up.
Disclosure: I am part of Trade Nation's Influencer program and receive a monthly fee for using their TradingView charts in my analysis.
❤️ Please, support our work with like & comment! ❤️
2.20 or 2.24This channel is not providing individualized trading or investment advice, nor is it a banking service, brokerage service, trading service, investment service or money management service

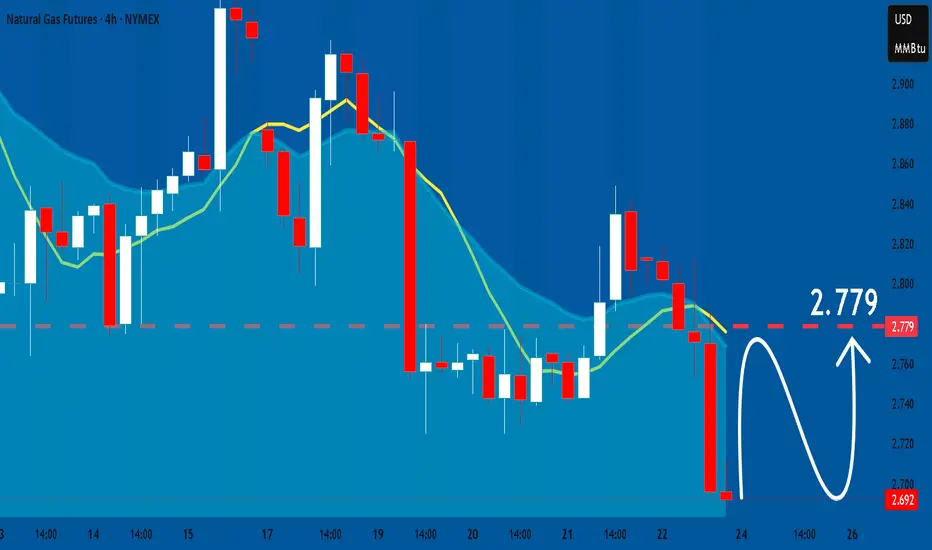
NATGAS What Next? BUY!
My dear friends,
Please, find my technical outlook for NATGAS below:
The price is coiling around a solid key level - 2.692
Bias - Bullish
Technical Indicators: Pivot Points Low anticipates a potential price reversal.
Super trend shows a clear buy, giving a perfect indicators' convergence.
Goal -2.782
About Used Indicators:
The pivot point itself is simply the average of the high, low and closing prices from the previous trading day.
Disclosure: I am part of Trade Nation's Influencer program and receive a monthly fee for using their TradingView charts in my analysis.
———————————
WISH YOU ALL LUCK
NG1!: Bulls Are Winning! Long!
My dear friends,
Today we will analyse NG1! together☺️
The in-trend continuation seems likely as the current long-term trend appears to be strong, and price is holding above a key level of 2.696 So a bullish continuation seems plausible, targeting the next high. We should enter on confirmation, and place a stop-loss beyond the recent swing level.
❤️Sending you lots of Love and Hugs❤️

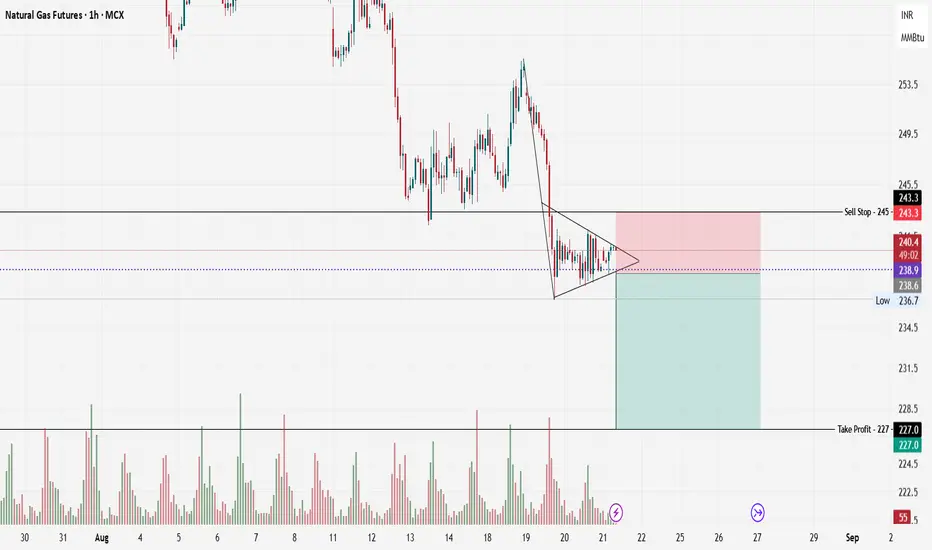
Natural Gas Pattern Trade - 21st Aug., 2025
Here is my Natural Gas Futures (MCX, 1H) chart classic—candlesticks analysis.
Pattern Identification: The Bearish Pennant
I’ve spotted a textbook bearish pennant. Here’s how it forms and functions:
The pattern starts with a pronounced downward thrust (the flagpole), reflecting strong selling momentum.
Price action then contracts into a symmetrical triangle, as shown by the converging trend lines.
This pennant shape is a market’s “pause”: sellers digest gains, buyers offer token support, but neither side has control—for now.
The expectation “by the book” is that this pattern serves as a continuation formation, where a breakout (typically downward, in line with the preceding move) resumes the established trend.
Pattern Validation & Invalidation
Validation Criteria
Clear Downtrend: The initial flagpole is rapid and steep, matching textbook requirements.
Symmetrical Contraction: Multiple touches on both trendlines without breaking out show healthy consolidation.
Volume Confirmation: Notice how volume spikes before the consolidation, then diminishes as the pennant forms—a classic and critical signal. Lower volume during consolidation signifies indecision; a surge in volume on breakout validates the move.
Defined Risk/Reward: Levels for stop loss and target are clear and logical, anchored to visible support/resistance.
Invalidation Criteria
False Breakouts: If price breaks above the pennant’s upper boundary and sustains, the pattern is invalid.
Volume Anomaly: A breakout without accompanying volume suggests the move may not be trustworthy.
Failure to Breakout: Prolonged sideways action beyond the pennant’s apex reduces the pattern’s predictive value.
Capitalizing on the Analysis
If I want to turn this analytical insight into a trading opportunity, I’ll approach it methodically:
Wait for Confirmation: Act on the trade only when price closes below the lower trendline, and I’d like to see a volume spike to validate the breakout.
Set Entry and Risk: I position an entry order (sell stop) just below the pattern, around ₹238.6–₹240.
Define Stop Loss: I place my stop loss slightly above the upper pennant boundary—just above ₹243.3—to safeguard against failed breakdowns.
Calculate Target: My target is derived from the measured move principle—project the flagpole’s length from the breakout point, which centres the take profit around ₹227.
Size the Trade: I ensure my trade size aligns with my risk tolerance, strictly following capital management principles.
By systematically applying these rules, I aim to capitalize on the high-probability move that often follows a valid bearish pennant pattern.
Gold | Oil | Dollar | Silver | Natural Gas Price ForecastGold | Oil | Dollar | Silver | Natural Gas Price Forecast
COMEX:GC1! COMEX:SI1! AMEX:UNG NYMEX:CL1!

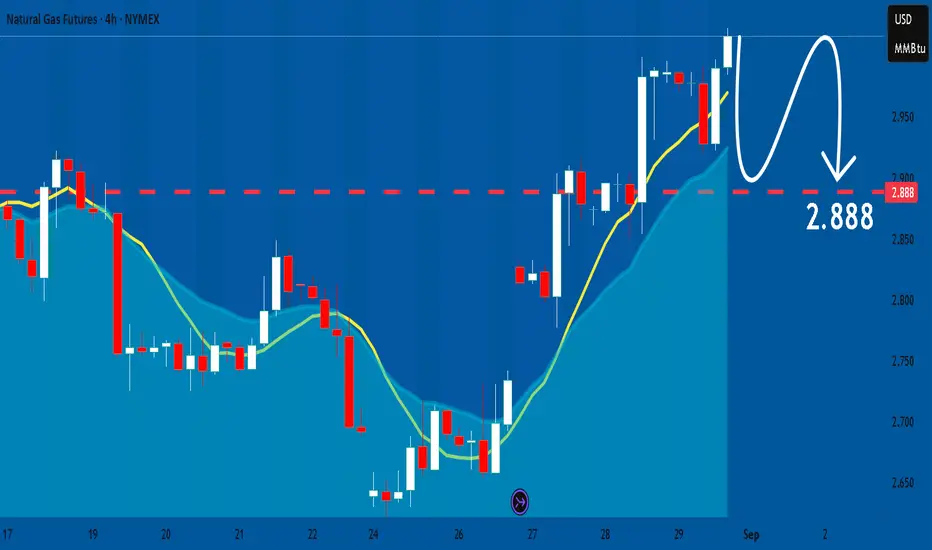
NG1!: Target Is Down! Short!
My dear friends,
Today we will analyse NG1! together☺️
The in-trend continuation seems likely as the current long-term trend appears to be strong, and price is holding below a key level of 2.924 So a bearish continuation seems plausible, targeting the next low. We should enter on confirmation, and place a stop-loss beyond the recent swing level.
❤️Sending you lots of Love and Hugs❤️