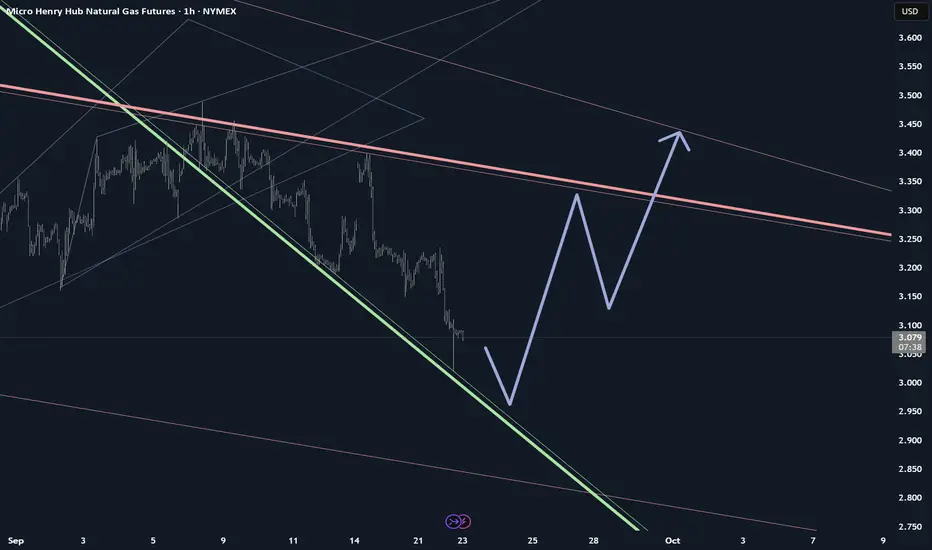
Naturalgas probable price moments1. if takes support at trend line may move up
2. if breaks it may take the price lower
IGA1! trade ideas

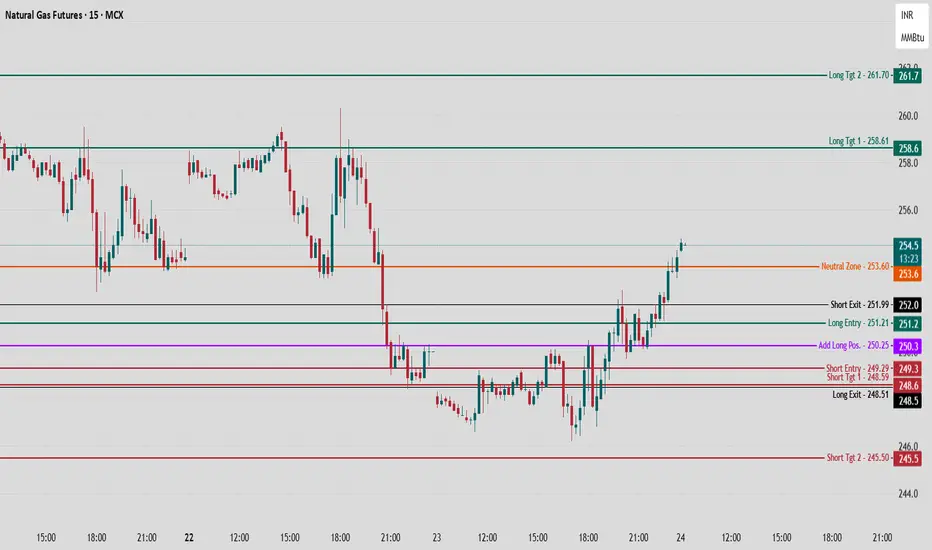
Natural Gas MCX Future Intraday Analysis for 24 Sept., 2025Natural Gas Futures – 15min Chart Trading Logic
Natural Gas is trading at 254.6, showing a strong upward move after reclaiming key support levels, with momentum building above the short-term base.
Long Trade Logic
Long Entry (251.2):
The long trade triggers above 251.2 as previous consolidation resistance broke, confirming new bullish momentum.
Pyramiding/additional long positions can be considered above 250.3 to ride trend continuation, using recent swing lows as risk anchor.
Upside Targets (258.6 / 261.7):
Target 1 (258.6): This is the first major supply zone where profit-taking could emerge.
Target 2 (261.7): Final mapped target, corresponding to upper range extremes and previous resistance.
Stop Logic:
Stops should be placed below 250.3 for any fresh long, as break below this invalidates bullish structure and exposes to downside risk.
Short Trade Logic
Short Entry (249.3):
The short setup only activates with a breakdown below 249.3, which will likely trigger stop hunts and reversal trades.
Short Targets (248.6 / 245.5):
Target 1 (248.6): First support seen from secondary bounce areas.
Target 2 (245.5): Deeper flush where sellers may aggressively cover.
Short Exit:
Exit shorts above 252, as reclaiming this band suggests failed breakdown and fresh buying.
Neutral and Structure
Neutral Zone (253.6):
Sideways bias; avoid new positions unless a clean break above or below is seen.
Structural View:
Sustained action above 253.6 signals control by bulls, while slip below 251.2 may bring short-term reversal.
Follow Chart Pathik for more such analysis!
Nat Gas Expanding RangePrice appears to be forming an expanding wedge(Megaphone).
Beware price is still well inside the higher time frame downtrend.
If this pattern is respected, Price swings will widen and price will break to the upside(RED LINE). However, there is a likely chance of exhaustion in price movement as it plays out.
NYMEX:MNG1!
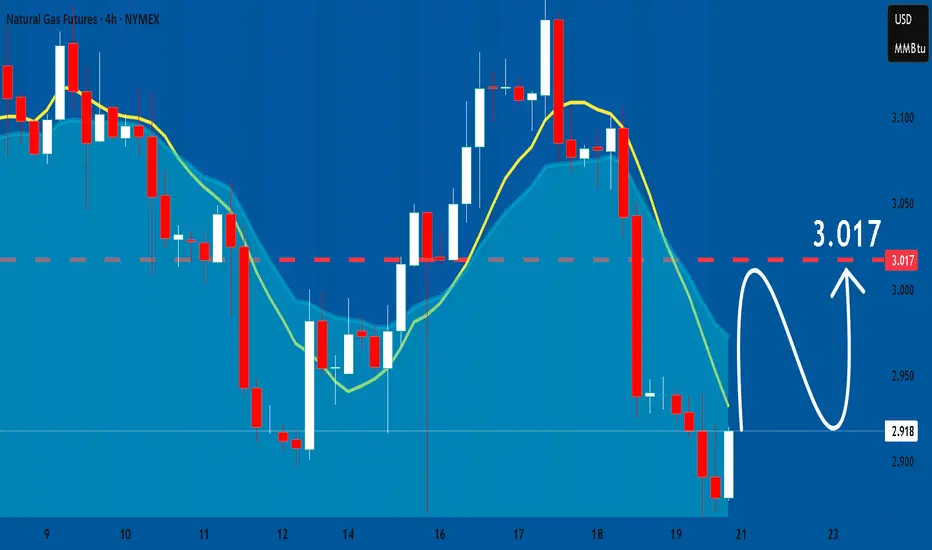
NATGAS What Next? BUY!
My dear followers,
This is my opinion on the NATGAS next move:
The asset is approaching an important pivot point 2.918
Bias - Bullish
Technical Indicators: Supper Trend generates a clear long signal while Pivot Point HL is currently determining the overall Bullish trend of the market.
Goal - 2.997
About Used Indicators:
For more efficient signals, super-trend is used in combination with other indicators like Pivot Points.
Disclosure: I am part of Trade Nation's Influencer program and receive a monthly fee for using their TradingView charts in my analysis.
———————————
WISH YOU ALL LUCK

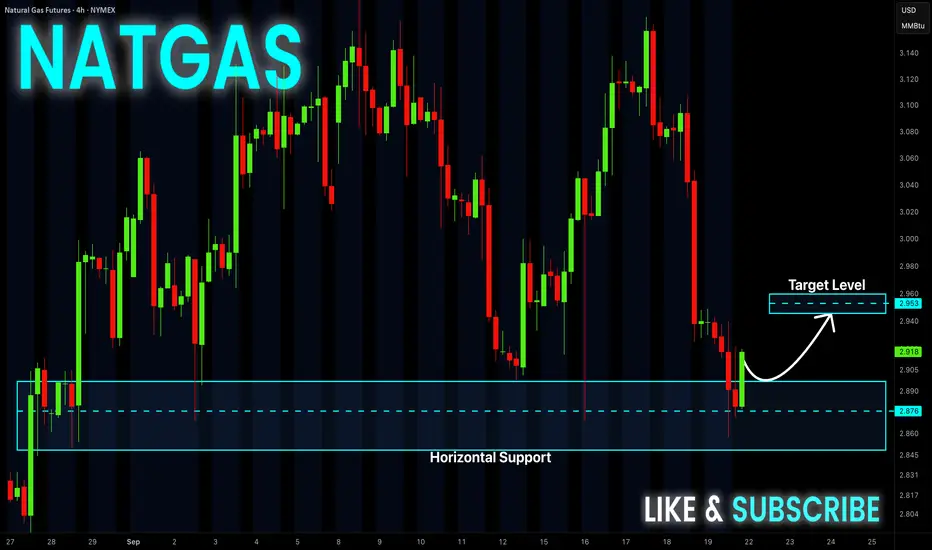
NATGAS Long From Support! Buy!
Hello,Traders!
NATGAS made a retest
Of the wide horizontal
Support level of 2.876$
And a local rebound is
Already taking place so
We are bullish baised
And we think that a local
Bullish correction is to
Be expected on Monday
Buy!
Comment and subscribe to help us grow!
Check out other forecasts below too!
Disclosure: I am part of Trade Nation's Influencer program and receive a monthly fee for using their TradingView charts in my analysis.
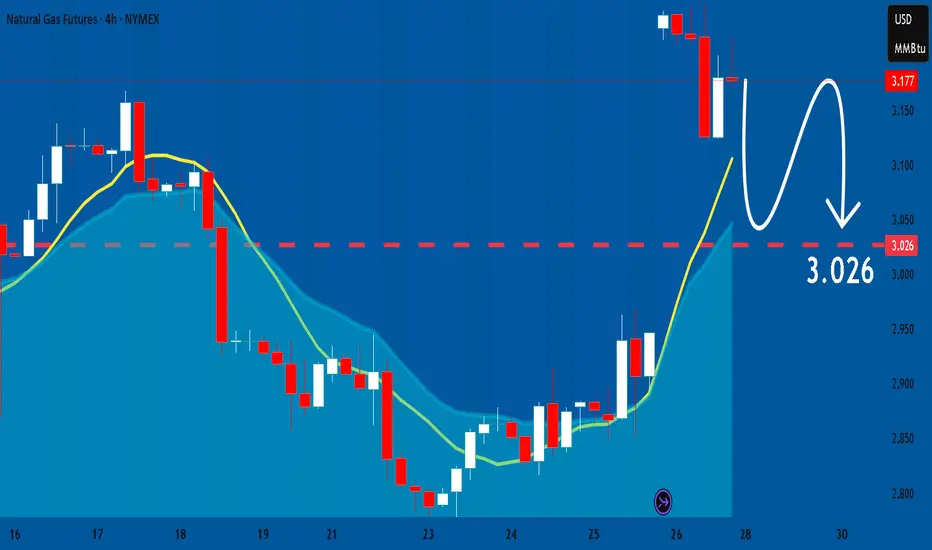
NATGAS Massive Short! SELL!
My dear subscribers,
This is my opinion on the NATGAS next move:
The instrument tests an important psychological level 3.177
Bias - Bearish
Technical Indicators: Supper Trend gives a precise Bearish signal, while Pivot Point HL predicts price changes and potential reversals in the market.
Target - 3.054
About Used Indicators:
On the subsequent day, trading above the pivot point is thought to indicate ongoing bullish sentiment, while trading below the pivot point indicates bearish sentiment.
Disclosure: I am part of Trade Nation's Influencer program and receive a monthly fee for using their TradingView charts in my analysis.
———————————
WISH YOU ALL LUCK

Gold | Oil | Dollar | Silver | Natural Gas Price ForecastCatch the latest commodities trading insights! This week's market analysis includes a look at both sides of the coin for oil, gold and silver. Plus, get some helpful technical analysis and trading tips to guide your decisions.
Gold | Oil | Dollar | Silver | Natural Gas Price Forecast
COMEX:GC1! COMEX:SI1! NYMEX:CL1! AMEX:UNG

2.24This channel is not providing individualized trading or investment advice, nor is it a banking service, brokerage service, trading service, investment service or money management service

NG1! BEARS ARE STRONG HERE|SHORT
NG1! SIGNAL
Trade Direction: short
Entry Level: 3.177
Target Level: 2.934
Stop Loss: 3.339
RISK PROFILE
Risk level: medium
Suggested risk: 1%
Timeframe: 9h
Disclosure: I am part of Trade Nation's Influencer program and receive a monthly fee for using their TradingView charts in my analysis.
✅LIKE AND COMMENT MY IDEAS✅

NATGAS: Market of Sellers
Balance of buyers and sellers on the NATGAS pair, that is best felt when all the timeframes are analyzed properly is shifting in favor of the sellers, therefore is it only natural that we go short on the pair.
Disclosure: I am part of Trade Nation's Influencer program and receive a monthly fee for using their TradingView charts in my analysis.
❤️ Please, support our work with like & comment! ❤️
NATGAS - New Long PhaseNATGAS - New Long Phase
Potential new ABC long Phase with 2 target above this price level

Naturalgas Probable price movements1. if price goes above blue levels and sustain then price movies up.
2. if price breaks the current channel then price looses its strength and may go down.

Natural gas bearish Natural gas doesn't perish at 280 levels.Strong resistance with double top pattern.

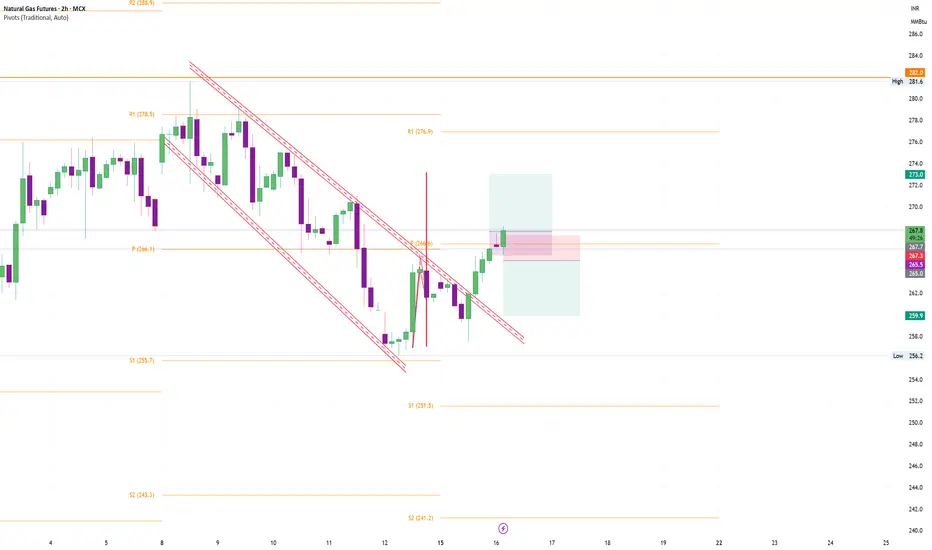
Natural Gas long setupNatural Gas long setup
Entry - 265.2
Stop loss - 263
Target - 278.3
Risk Reward - Approx 1:6

NATGAS: Growth & Bullish Forecast
Balance of buyers and sellers on the NATGAS pair, that is best felt when all the timeframes are analyzed properly is shifting in favor of the buyers, therefore is it only natural that we go long on the pair.
Disclosure: I am part of Trade Nation's Influencer program and receive a monthly fee for using their TradingView charts in my analysis.
❤️ Please, support our work with like & comment! ❤️
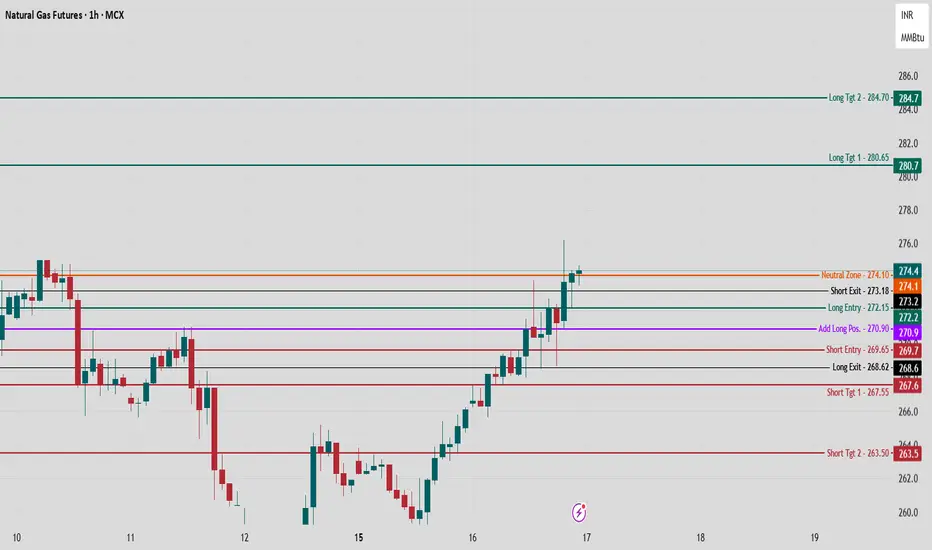
Natural Gas MCX Future Intraday Technical Analysis 17 Sept., 25 Natural Gas is trading firmly at 274.4, sustaining above the crucial Neutral Zone (274.1) on the 1-hour chart. The structure remains bullish as price consistently forms higher highs and follows the established upward channel from support levels.
Key Levels and Trade Plan
Long Entry: 272.15
Targets: 280.7 (Tgt 1), 284.7 (Tgt 2)
Short Entry: 269.65
Targets: 267.55 (Tgt 1), 263.5 (Tgt 2)
Neutral Zone (Pivot): 274.1
Add Long Position on Dip: 270.9
Technical Outlook
Above 274.1, bullish continuation is likely toward upper resistance zones—watch for breakout follow-through and volume confirmation.
Rejection near the Neutral Zone may signal intraday exhaustion; below 272.15, a retracement toward short-entry levels becomes probable.
Trailing stops are recommended on longs; use defined exit zones to protect profits.
Chart structure favors disciplined trend trading—let the market levels define entries, exits, and risk.
Follow Chart Pathik for more such updates!
Natural Gas RetestNYMEX:MNG1! Was in a megaphone/expanding wedge, which formed at the end of August.
This pattern consists of two diverging trends, with the shallower trend having a higher probability to break simply due to the effort required for price to maintain the steeper trend.
Price broke to the downside continuing until breaking the downward trend to the upside. Even after breaking the expanding wedge, price continues to respect it.
Recent news and economic factors have allowed price to rally even with many fundamentals staying bearish. This coupled with price still being inside of its larger, higher time frame downtrend, I'm anticipating for this level to stop the recent rally and push price lower.
Expect price to reclaim and take out recent previous highs before moving lower.

Natrualgas probable price movements2hr chart
1. if price sustains above pivot 5rupee move is possible
2. if price moves below pivot 5 ruppe down movement can be expected
Gold | Oil | Dollar | Silver | Natural Gas Price ForecastGold | Oil | Dollar | Silver | Natural Gas Price Forecast
NYMEX:NG1! AMEX:UNG AMEX:BOIL PEPPERSTONE:NATGAS

Natural Gas Testing TrendlineNatural gas is in a current downtrend. Price is currently testing this trend. A bounce off of or break of this trend will set the precedent for the week. NYMEX:MNG1! NYMEX:MNG1!

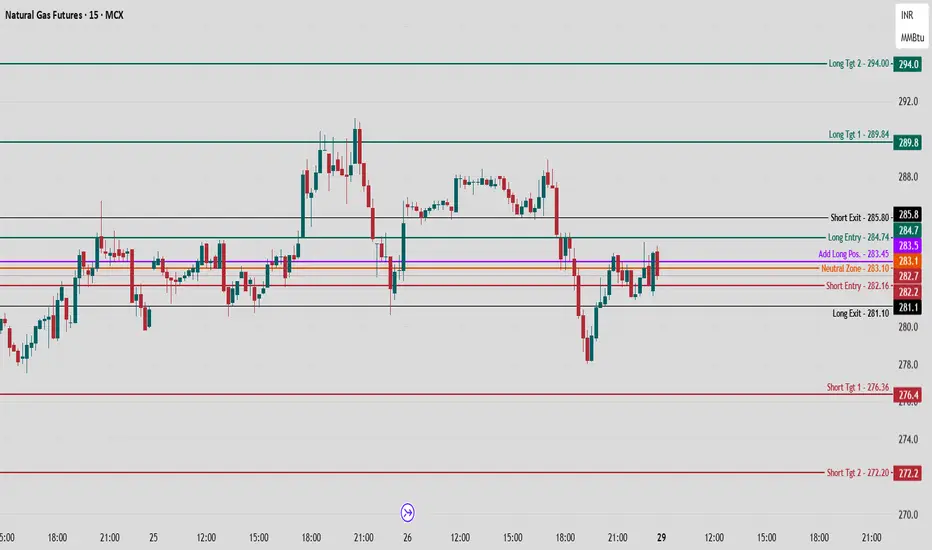
Natural Gas MCX Future - Intraday Technical Analysis 29th Sept.MCX:NATURALGAS1!
Natural Gas is currently trading at 282.7 after a period of high volatility and failed recovery attempts, moving around key inflection levels.
Bullish (Long) Setup
Long Entry (284.7):
Initiate longs above 284.7, as this breaks out from recent supply and confirms buyers regaining control over the session.
Add positions near 283.5 if dips are absorbed and price action forms higher lows above this level.
Upside Targets:
289.8 (Target 1): First major resistance and prior swing high, logical profit-taking zone.
294.0 (Target 2): Extension area, marking upper band of the visible range.
Stop Loss:
Place just below 283.1 (neutral zone) to reduce risk; breakdown here signals failed bullish momentum for this cycle.
Bearish (Short) Setup
Short Entry (282.2):
Enter shorts below 282.2. This confirms breakdown of support, indicating sellers regaining control and potential for rapid downside.
Downside Targets:
276.4 (Target 1): Historical bounce/readjustment level, typical for covering and first target booking.
272.2 (Target 2): Deeper extension, marking further weakness if sell pressure persists.
Stop Loss:
Above 283.5 to guard against sharp reversal.
Neutral/Range Logic
Neutral Zone (283.1):
Ranging bias between 283.1–283.5; best to wait for a decisive move outside these levels for clear trend alignment.
Sustained action above 284.7 signals buyers in control, below 282.2 puts sellers in charge.
This logical structure enables disciplined intraday setups with clearly defined risk-reward for Natural Gas MCX.
Follow Chart Pathik for more insight on Natural Gas on Daily basis.
NG1!: Strong Bullish Sentiment! Long!
My dear friends,
Today we will analyse NG1! together☺️
The market is at an inflection zone and price has now reached an area around 3.197 where previous reversals or breakouts have occurred.And a price reaction that we are seeing on multiple timeframes here could signal the next move up so we can enter on confirmation, and target the next key level of 3.224.Stop-loss is recommended beyond the inflection zone.
❤️Sending you lots of Love and Hugs❤️

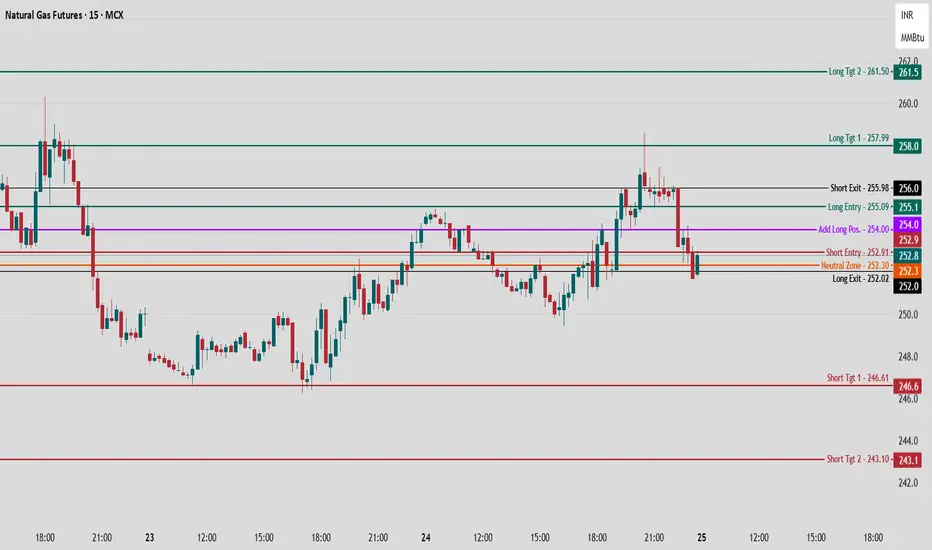
Natural Gas MCX Future Intraday Technical Analysis - 25 Sept. 25MCX:NATURALGAS1!
Natural Gas is consolidating at 252.8 after a recent pullback from highs, now oscillating around key inflection levels.
Bullish Scenario (Long Logic)
Long Entry (255.1):
Enter long above 255.1, confirming strength and upside momentum after reclaiming prior supply and moving out of the short-term pullback.
Consider scaling in around 254.0 for pyramiding if price finds support above the add-long band.
Upside Targets:
258.0 (Target 1): Previous swing high and strong resistance, likely zone for booking partial profits.
261.5 (Target 2): Next mapped extension and the upper boundary of the range.
Stop Loss:
Place below 252.0 to limit the downside risk; breakdown here invalidates bullish thesis for the session.
Bearish Scenario (Short Logic)
Short Entry (252.9):
Initiate shorts on breakdown below 252.9 as bears retake control and price fails to sustain upward attempts.
Downside Targets:
246.6 (Target 1): Recent bounce area, typical for some covering or reversal attempts.
243.1 (Target 2): Deeper support, favored if momentum accelerates.
Stop Loss:
Shorts should be covered above 256.0, as price reclaiming this area reverses bearish momentum.
Neutral/Structure Logic
Neutral Zone (252.3):
Ranging/sideways bias here; avoid new exposures until decisive direction emerges.
Close above neutral zone turns sentiment bullish; below 252.0 builds more downside bias.