Why the US dollar bear should tread with careThe USD saw a sharp reversal higher despite a 50bp cut, simply because the markets were positioned for a more dovish dot plot. I have argued in prior analysis the USD exposure is a bit stretched over the near-term, so perhaps shorting the USD is getting a bit stale. We also have several key markets at inflection points after a risk event. Matt Simpson takes a technical look.
Mini US Dollar Index® Futures
No trades
Trade ideas

High Timeframe Analysis of the Dollar Index DXY - Short IdeaDISCLAIMER: This is not trade advice. This is for educational and entertainment purposes only, showing how I intend to participate in this market. Trading involves significant risk. Do your own due diligence.
Utilizing my Multi Timeframe strategy, I have identified that I would like to look for SHORTS on DXY. To clarify, I'm not saying I'm blindly shorting this market. If I see price action that checks the boxes for this strategy, I will take the short. Until then, I do NOTHING.
SETUP - > TRIGGER - > FOLLOW THROUGH.
Feel free to shoot me a message with any questions.
Have a great week!

USD Dollar weekly key reversal bar, sign for bulish reversallast weekly bar of the Month of August is weekly key reversal bar, made a new low & closed off the high. current week price pulled back to its 0.618% & 0.70% fib level. last fib level expecting before rally up is 0.79% which is 100.68. last and extreme level may touch 100.50 as well. if price breaks & closes below the 100.50 then it can go down further. but key reversal is indication for buying now. resistance levels are 102.30 & 102.50.

weekly performance of U.S. Dollar Index Futures The chart shows the weekly performance of U.S. Dollar Index Futures (DX!).
1. **Current Trend**: The index is currently trading around 101.29, showing a recent decline. The price has dropped below the support level of 102.00, indicating bearish momentum.
2. **Volume Analysis**: The trading volume is relatively stable, suggesting consistent market interest. However, significant volume spikes could indicate potential trend reversals.
3. **Historical Performance**: The seasonal table below the chart shows mixed monthly performances over the years. Notably, September has historically shown a strong average gain, which might suggest a potential rebound.
4. **Resistance and Support Levels**:
- **Resistance**: The resistance level is around 102.70, which the index needs to break to confirm a bullish trend.
- **Support**: The immediate support is at 101.00. A break below this level might lead to further declines.
5. **Technical Indicators**: While specific indicators are not visible, the general price pattern suggests a bearish trend. Watching for bullish reversal patterns or indicators like RSI or MACD could provide additional insights.
6. **Market Sentiment**: The sentiment appears cautious, with traders likely waiting for more economic data or geopolitical developments to influence the dollar's strength.
In conclusion, while the current trend is bearish, historical data suggests potential for recovery in September. Traders should watch key levels and volume changes for clearer signals.

USD DOLLAR possible reversal for 102.50USD Dollar hit the 100.50 price level which is strong support area of last 8 months. 28th December 2023. this is quite strong support area which should fight to hold and reverse price upside to the 102.50. Buying zone 100.50, stop loss: 100.20, target: 102.50. Trend is quite bearish, reversal trade takes time to digest supply for long. If USD Dollar holds that strong support then might see fall in gold, eur and other currencies as well.

USD bears! Markets don't move in a straight line (forever)We stand back to admire the long-term chart of the US dollar index, and yes there could be further downside over the coming weeks. But a quick check on the daily timeframe makes us wary of jumping into an already well-established short, given potential support levels nearby and the fact everyone and their dogs seem to be bearish the dollar.

DXY LongDXY Long potential
DXY has reached weekly demand zone
waiting for price to reach daily demand zone
price undervalued against bond long term
also waiting for undervalued to happen short term
seasonality looks great up trending for quite some time
retailers are selling heavy and commercials are buying slightly which where we should be riding with them
PS: news will give you headache always trust your system
Trade safe

DXY Big Long Momentum Ahead ?!The Dollar Index (DX1!) has been in an uptrend since the spring-summer of 2008, when it reached its lowest point.
Since October 2009 (after the first leg down of the uptrend), whenever the net positions of retailers in the CoT report turn negative (or approach zero) AND retailers reach an extreme low in the CoT index (either in the short-term OR long-term), a significant run-up typically follows. Please note that these are weekly charts.
The only exception was in June 2020, when the price continued to decline until later that year in December, which ultimately led to a substantial 2-year uptrend.
At the same time, the 5, 10, and 15-year seasonality indicators show that we are currently at the bottom, which is expected to last until the end of September, suggesting an uptrend.
Additionally, there is a weekly demand zone ahead around 101.400 - 100.320. If enough participants join in, a significant run-up is expected.
The fundamentals are in place; we just have to wait and see if the demand zone holds.
BE AWARE, this is the Dollar Index, which means all other major currencies, especially EURUSD, will be affected if this scenario plays out.

Dollar Futures reveal viability of a very common pattern.I have gone through every trick I know trying to settle on analysis for the dollar. Let's be honest, the past year and a half have been nothing but squirrelly, sideways movement that appears to go nowhere and do nothing. In fact, we are basically sitting at the average price over that time period. SO, how should we read this? Well, this is how I read it...
Over the past 1 year and 7 months, price has arrived at the same price: Sideways movement, like a consolidation, and at the end of a long move up, counting off of the May 2011 low. The move from 2011 appears complete, from a Elliot wave (read: structural) standpoint, and a Fib (read: levels) standpoint. From a strength standpoint, however, the September 2022 peak ended on the daily chart with continuing bullish divergence WITHIN THE WAVE 5. I call it a wave 5 because although its internal strength remained bullish, all peak readings indicated bearish divergence off of the March 2015 wave 3 of 3 top.
This line of analysis leads me to believe that we have, at the very least, the unfinished business of generating more negative, bearish divergence prior to anymore notable downside. Since, as I mentioned, Fib targets have been fully satisfied, meaning higher highs are unlikely, we may be gearing up for a strong move up. A move with outsized strength that fails to reach new highs, thereby creating hidden bearish divergence, since our high was not technically fully bearish.
In simplest terms, this appears to be consolidation at the end of a decade of bullish price action, which is bullish. Most technicals "technically" point us down, and the same goes for fundamentals, but there are irregularities in these metrics that point us up. Pattern, Strength, and Levels analysis give us plenty of room to the upside to finish this bull run, so long as we stay under 114.778, assuming a strong move, OR move up on weakness with only marginal new highs.
Conclusion: BULLISH.

the weakness of the US dollar
Recent trend: The top of the chart shows the US Dollar Index Futures currently at 102.250, down 0.705 points or 0.69% from the previous trading day. This short-term decline reflects immediate dollar weakness.
Long-term trend: From late 2023 to early 2024, the Dollar Index shows an overall downward trend. Although there were some rebounds, the general trajectory remains weak.
Monthly performance: Looking at the monthly data at the bottom of the chart, we can see poor dollar performance in the first few months of 2024. Notably, May saw a 1.39% decline and July a 1.60% drop, indicating significant dollar weakness in these months.
Year-over-year comparison: Compared to previous years, 2024 shows relatively weak performance for the dollar. For instance, 2023 had mostly positive growth in many months, while 2024 has seen negative growth in most months so far.
Technical indicators: The chart shows instances of downward breaks through key support levels, such as the sharp decline in early August, breaking below previous support and further confirming dollar weakness.
Volatility: Recent candlesticks show larger lower shadows, suggesting selling pressure and insufficient buying power to support prices, reflecting bearish market sentiment towards the dollar.
In summary, this chart reflects the dollar's weakness from multiple dimensions, including short-term movements, long-term trends, monthly and yearly performance comparisons, and technical indicators. These factors collectively corroborate the current weak state of the US dollar.

Multi Timeframe Analysis - 12 Month - 2 Week - H12 Using multi-timeframe analysis to identify targets and entries on futures markets.

USD index looks set to hold 102 (for now)US CPI data may not have been as soft as some would have liked, but it retains the view that the Fed will cut rates and achieve a soft landing.
The US dollar index reversed earlier CPI-induced losses to close the day flat on Wednesday and form a small bullish pinbar. Its low almost perfectly respected trend support from the July 2023 low, and shows that demand resides above 102. I suspect the USD index might be in for a small bounce, which could see AUD/USD fall further beneath its 200-day MA (job data pending).
Quite how much of a bounce I am not sure, but these levels do not look favourable for bears. Also note that a small bullish divergence ahs formed on the RSI (14), and RSI (2) is also oversold to suggest bullish mean reversion is due.

The Dollar Index and what we will see in the coming yearsThe Dollar Index and what we will see in the coming years from its collapse has become imminent, we may witness it at 64

DX1! (USD Index) looks set to bounceThe dollar index formed a small bullish candle on Monday, above the 200-day simple and exponential moving averages. Given the daily volume was relatively high compared with the candle, it could suggest a build up of buying pressure and potential cycle low. The daily RSI (2) was also oversold on Friday.
A bullish RSI divergence formed on the 4-hour RSI, and a false spike of the initial low also suggests momentum is shifting higher. Bulls could seek dips within Monday's range or enter live to seek a counter-trend move towards 104.50 (near a 38.2% Fib level).

Analyzing Trends: USD Performance and Market InsightsOutlining the historical performance of the USD based on chart patterns, support/resistance and Retail Sentiment.

Expect bulls on DXYICEUS:DX1! To trade above Asia high in London session give more strength to united states dollar 💲 today

nothingchangehere Chart Pattern Analysis Of DX1!
It seems that the bear market of DX1! had started earlier.
And the present market is most likely in a consolidation process.
That is a running downtrend flat.
The continuously increasing supply pressure and long candle body verified it.
The price touched a nearest support,
Every rebound of the market is a potential good place to short it there.
Perhaps, the following candles will test the upper limit of the channel,
or test the 0.5fib line of the nearest downtrend wave,
If there are signals of lacking demands or increasing supply pressure,
It will be a good place to short it.
When DX1! In a potential bearish market,
That means the other goods (such as Gold\Silver\Copper\BTC…) will most likely in the journey of another bull run.
I will try to hold and prepare for this change.

DXY (US DOLLAR INDEX): DT ContinuationBULLISH:
Despite the recent encouraging economic data, such as the Empire State Manufacturing Index and optimistic retail sales forecasts, the dollar has gained momentum and broken out of its downtrend.
BEARS:
On the 5D timeframe, the analysis of the curve indicates that the US Dollar Index is currently experiencing a downtrend. It appears that the recent rise in the DXY may just be a temporary pullback, with a high probability of returning to the downtrend.
The DXY is approaching two levels of resistance, with the first one at 105.87 and the second one at 106.66. These levels could potentially lead to a rejection, causing the downtrend to continue.

US Dollar Index (DXY) Update- Small pump then Dump.
- Keep it simple.
- Everything in graph.
- Older analysis. 👇👇
Happy Tr4Ding !

USD/CHF to lead DXY higher, AUD/USD, EUR/USD lower?Our bias is for the US dollar index to rise to 105 over the near-term. The daily chart respected trend support from the December low, and the 4-hour chart shows a small ascending triangle which implies a break above resistance.
Out of the FX majors, USD/CHF looks ready to break above resistance and lead the dollar broadly higher. Bears could also consider a short on AUD/USD on the assumption the high of RS (right shoulder) has been established, and seek a move down towards the neckline at a minimum. A break of which could see it head for the projected H&S target around 0.6580.
If the US dollar index goes higher, surely EUR/USD should move lower. Bears could enter short with a view to target the swing low around 1.0835 or the bullish trendline.

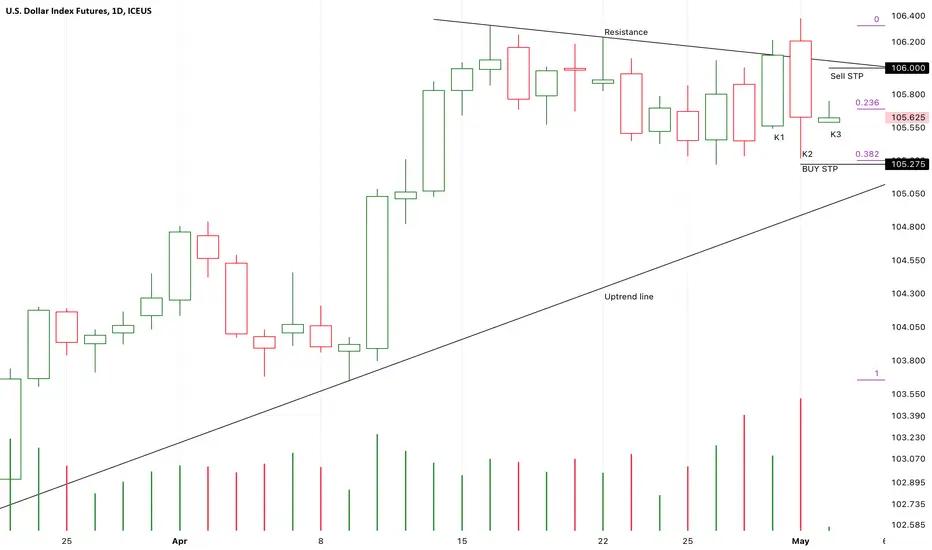
Chart Pattern Analysis Of DX1!
K1 and K2 is a strong bearish dark cloud cover pattern,
If the following candles couldn’t close below K2 to verify the strong momentum.
It will be a good place to buy here.
If the following candles close upon the resistance,
It is a second good place to buy in.
K2 is also a potential right top of a large scale bearish double top pattern.
If K3 rebound under low volume,
It will be a good place to sell it there.
Buy-105.5/Stop-105.3/-Target-110
Bearish Elliott Wave Sequence in Dollar Index (DXY) Favors DownsShort Term Elliott Wave in Dollar Index (DXY) shows incomplete bearish sequence from 4.17.2024 high. Down from there, wave 1 ended at 104.08 like the 1 hour chart below shows. Rally in wave 2 unfolded in a double three Elliott Wave structure. Up from wave 1, wave (w) ended at 104.79 and dips in wave (x) ended at 104.39. Wave (y) higher ended at 105.12 which completed wave ((w)) in higher degree. Pullback in wave ((x)) ended at 104.33 and rally in wave ((y)) ended at 105.18 which completed wave 2 in higher degree.
The Index has turned lower in wave 3. Down from wave 2, wave (i) ended at 104.63 and wave (ii) rally ended at 104.89. The Index then nested lower with wave i of (iii) ended at 104.36. Wave ii of (iii) ended at 104.76. The Index extended lower in wave iii towards 104.14 and wave iv ended at 104.25. Wave v lower ended at 103.99 which completed wave (iii). Near term, as far as pivot at 105.18 high stays intact, expect short term rally to fail in 3, 7, or 11 swing for further downside.

USD DOLLAR possible long for short term4h time frame price tapped demand zone. suspect bullish for 105.60. if price retest 104.00 then ideal long setup on usd dollar. stop loss below 103.70, target: 105.60
