Crude Beginning—or Continued Beating?CL1! Weekly — Is today the buy day?
Bullish flag on the weekly, daily CVD higher-low divergence, and a possible monthly 45° (Gann 1×1) reclaim. I’m exploring the long case and mapping what needs to happen.
What I think I’m seeing
Structure: Weekly bull flag compressing under 63.3–64.5.
Flow: Daily CVD made a higher low while price made equal/lower lows → buyers absorbing at the base.
Angle: Price is testing the monthly Gann 1×1 (45°). Reclaim/hold tends to start an advance toward the next fan angles.
Gann breakdown
Horizontal (price resonance)
Trigger band: 63.30–63.40
Guardrails above: 63.56 / 63.63 → 64.24 → 64.49 (convert to support = go mode)
Upside ladder once 64.49 holds: 66.27 → 67.76 → 72.90 → 79.90 → 86.57 → 92.15
Vertical (time)
Watching weekly windows from the last swing low: ~13 / 21 / 34 / 52 weeks (Gann & Fib counts). If a push through 63s–64s aligns with one of these, I’ll weight it higher.
Angle (fan)
A monthly close back above the 1×1 (45°) often points to a rotation toward the 1×2 / 2×1 fans—which line up with the ~66–68 → 72–73 areas on my chart.
Long plan (step-by-step)
Trigger: Push through 63.30–63.40 with CVD printing a higher high versus the prior 2 sessions.
Confirmation steps:
Hold above 63.56 / 63.63
Then 64.24
Promotion to “trend-up” when the daily/4H close > 64.49 and it holds on retest.
Entries (staged):
Buy stop 63.36–63.44
Add on strength 63.58–63.63
Add on successful retest 64.24–64.49
Risk (tight, mechanical):
Initial stop 62.74 (beneath the 0.618/CVD pivot).
After a hold above 64.49, trail under prior day’s low or a rising 1-hr VWAP/EMA.
Targets / scale-outs:
63.97 → 64.49 (convert)
66.27 (first major take-profit)
67.76 (second)
Leave a runner toward 72.90 if the monthly 45° is reclaimed and respected.
Live checklist I’ll monitor
CVD: higher highs on each push through 63.3 / 63.6
VWAP: intraday VWAP rising and respected on dips
Closes: daily/4H > 64.49 and a weekly that keeps 64s as support
Angle: monthly candle tracking above the 45°
I’m treating this as a long setup that needs confirmation: let the tape prove it through 63s → 64.49, then walk the ladder 66.27 → 67.76 → 72.90 with disciplined risk.
TMK2030 trade ideas
WTI Crude Oil - Bearish Outlook: Potential Short SetupOverview:
WTI Crude Oil (CL1!) is showing signs of weakening momentum amid a bearish fundamental backdrop. With prices hovering around $63 as of September 15, 2025, I'm eyeing a short opportunity near the $64 resistance zone. This view is supported by deteriorating market sentiment and technical patterns suggesting further downside.
Key Fundamentals Driving the Bear Case: CFTC Speculative Net Positions at 15-Year Low: The latest CFTC Commitments of Traders (COT) report shows speculative net long positions in crude oil futures dropping to around 81.8K contracts as of September 12, 2025—the lowest level in 15 years.
This sharp unwind of longs indicates fading bullish conviction among speculators, often a precursor to sustained price declines.
Global Supply Outpacing Demand: According to the IEA's September 2025 Oil Market Report, global oil supply is projected to rise by 2.7 million bpd in 2025, while demand growth remains subdued at just 700 kb/d.
This imbalance is creating a larger-than-expected surplus, exacerbated by OPEC+ production hikes and resilient non-OPEC supply. Weaker U.S. demand signals from recent EIA data further tilt the scales toward oversupply.
Expect inventory builds to pressure prices lower into Q4.
Technical Setup: Nullified Head & Shoulders Pattern?
The chart highlight a potential head and shoulders top formation on the 4hr-8hr timeframe, with:
Left Shoulder: Formed in late August around $64.
Head: Peak at ~$66 in early September, followed by a rejection.
Right Shoulder: Currently developing near $64, with the neckline around $62.50–$63.
A breakdown below the neckline could target $59–$60 initially. Volume has been declining on the upside, supporting the bearish reversal.
Invalidation: The pattern would be nullified if price closes decisively above $66 (the head high), potentially signaling a bullish continuation toward $70. But with current momentum fading and RSI diverging bearishly, the odds favor the downside.
Trade Idea: Entry: Short around $64 on a rejection (e.g., failed retest of resistance).
Stop Loss: Above $66.50 (head high + buffer).
Target: $60 (neckline projection), with extension to $58 if momentum builds.
This setup combines weak specs, supply glut, and classic reversal TA—primed for a short. What's your take? Bullish counterarguments welcome! #USOIL #CrudeOil #Bearish #TradingView

Looking for oil long!Oil could turn very strong starting tomorrow because Israel’s strike on Hamas leaders in Qatar—a key Middle Eastern hub has sharply raised geopolitical risk around vital energy routes, and while today’s market reaction was limited, traders often price in these shocks with a lag; any escalation, threat to infrastructure, or renewed headlines could spark a strong rally as the market bakes in tighter supply expectations and higher risk premiums .

Crude Oil Pivot at $65 | Break & Hold Fuels UptrendLast Sunday Opec+ agrees further oil output boost by 137K barrels per day, but less than Sep / Aug output, when market open it went higher.
How to manage short-term risk, in this case opportunity with CME Group weekly energy options on such a scheduled announcement?
Video version:
Crude Oil Futures & Options
Ticker: CL
Minimum fluctuation:
0.01 per barrel = $10.00
Disclaimer:
• What presented here is not a recommendation, please consult your licensed broker.
• Our mission is to create lateral thinking skills for every investor and trader, knowing when to take a calculated risk with market uncertainty and a bolder risk when opportunity arises.
CME Real-time Market Data help identify trading set-ups in real-time and express my market views. If you have futures in your trading portfolio, you can check out on CME Group data plans available that suit your trading needs tradingview.com/cme/

CRUDE OILPreferably suitable for scalping and accurate as long as you watch carefully the price action with the drawn areas.
With your likes and comments, you give me enough energy to provide the best analysis on an ongoing basis.
And if you needed any analysis that was not on the page, you can ask me with a comment or a personal message.
Enjoy Trading ;)

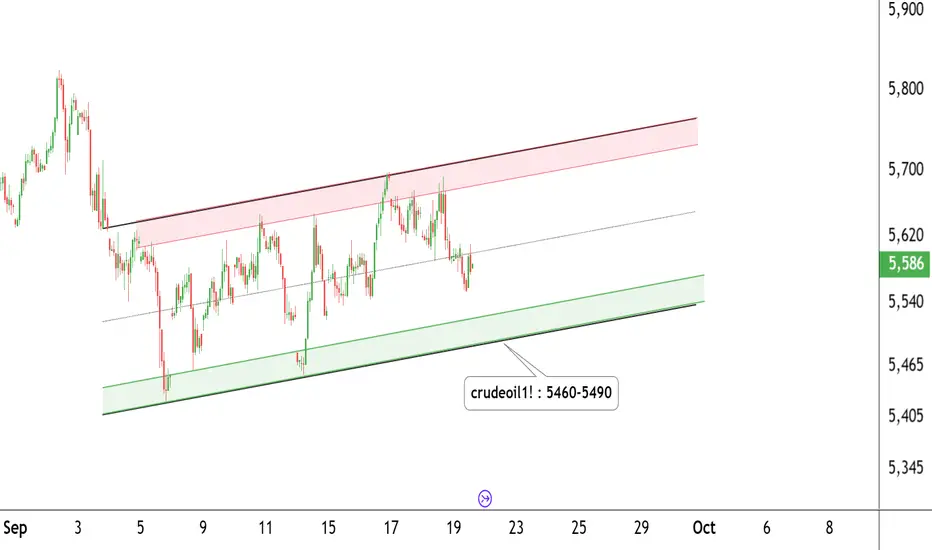
Crude Oil Trading Levels – Plan Your Move!CRUDE OIL – Daily Timeframe Update
Crude Oil is trading within a well-defined parallel channel on the daily chart.
The price is currently taking support near the 5460–5490 zone and moving within an ascending channel.
Support Zone: 5460 – 5490
Resistance Zone: 5700 – 5720
If these levels sustain, we may see higher prices ahead in Crude Oil.
Thank you!!
Manage Crude Oil Risk with Weekly Energy OptionsOn Sunday Opec+ agrees further oil output boost by 137K barrels per day, but less than Sep / Aug output, when market open it went higher.
How to manage short-term risk, in this case opportunity with CME Group weekly energy options on such a scheduled announcement?
Crude Oil Futures & Options
Ticker: CL
Minimum fluctuation:
0.01 per barrel = $10.00
Disclaimer:
• What presented here is not a recommendation, please consult your licensed broker.
• Our mission is to create lateral thinking skills for every investor and trader, knowing when to take a calculated risk with market uncertainty and a bolder risk when opportunity arises.
CME Real-time Market Data help identify trading set-ups in real-time and express my market views. If you have futures in your trading portfolio, you can check out on CME Group data plans available that suit your trading needs www.tradingview.com

Oil prices, a favorable factor for a Fed cut1. An oversupplied market
Global oil production is reaching record highs at around 105 million barrels per day. The United States delivers 22 million, ahead of Russia and Saudi Arabia (9.6 million each), while OPEC provides 27 million. On top of this comes the growth in exports from Brazil, Canada, and Argentina. This supply glut keeps oil prices in the $65–75 range despite geopolitical conflicts.
2. Cheap oil, an unexpected ally against inflation
This situation is an asset for major importing economies, particularly the United States. Moderate oil prices contribute to disinflation, easing the energy bill for households and businesses. Unlike past episodes where sharp oil price drops signaled collapsing demand, the current movement mainly stems from oversupply. It is therefore not a recession signal but rather a supportive cyclical factor.
3. Downward trend under the $65/$75 resistance
Chart signals confirm this pressure. WTI remains capped under $65, Brent under $70–75. Ichimoku indicators place prices below the weekly cloud, confirming a bearish dynamic. Elliott Wave analysis suggests an ongoing corrective move since the war in Ukraine. In this context, institutional investors are increasing short positions, putting further pressure on prices.
4. Geopolitics as an artificial floor
While fundamentals argue for a sharper decline, oil remains supported by a risk premium linked to tensions in the Middle East and Eastern Europe. This geopolitical factor is a bullish element for oil prices.
5. The Fed’s key role on September 17
The Federal Reserve’s decision at its September 17 meeting could alter oil’s trajectory. A rate cut would weaken the dollar, making dollar-denominated oil more attractive for foreign buyers. This mechanism would offer temporary support to prices despite oversupply. Conversely, maintaining the status quo would strengthen the greenback, adding downward pressure. Price adjustments will therefore largely depend on the Fed’s monetary strategy and the FOMC’s updated macroeconomic projections.
In summary, today’s oil surplus acts as a macroeconomic safety valve: it curbs inflation, supports purchasing power, and reduces production costs. This setup provides Western markets with a more stable environment while giving the Fed additional room for maneuver.
DISCLAIMER:
This content is intended for individuals who are familiar with financial markets and instruments and is for information purposes only. The presented idea (including market commentary, market data and observations) is not a work product of any research department of Swissquote or its affiliates. This material is intended to highlight market action and does not constitute investment, legal or tax advice. If you are a retail investor or lack experience in trading complex financial products, it is advisable to seek professional advice from licensed advisor before making any financial decisions.
This content is not intended to manipulate the market or encourage any specific financial behavior.
Swissquote makes no representation or warranty as to the quality, completeness, accuracy, comprehensiveness or non-infringement of such content. The views expressed are those of the consultant and are provided for educational purposes only. Any information provided relating to a product or market should not be construed as recommending an investment strategy or transaction. Past performance is not a guarantee of future results.
Swissquote and its employees and representatives shall in no event be held liable for any damages or losses arising directly or indirectly from decisions made on the basis of this content.
The use of any third-party brands or trademarks is for information only and does not imply endorsement by Swissquote, or that the trademark owner has authorised Swissquote to promote its products or services.
Swissquote is the marketing brand for the activities of Swissquote Bank Ltd (Switzerland) regulated by FINMA, Swissquote Capital Markets Limited regulated by CySEC (Cyprus), Swissquote Bank Europe SA (Luxembourg) regulated by the CSSF, Swissquote Ltd (UK) regulated by the FCA, Swissquote Financial Services (Malta) Ltd regulated by the Malta Financial Services Authority, Swissquote MEA Ltd. (UAE) regulated by the Dubai Financial Services Authority, Swissquote Pte Ltd (Singapore) regulated by the Monetary Authority of Singapore, Swissquote Asia Limited (Hong Kong) licensed by the Hong Kong Securities and Futures Commission (SFC) and Swissquote South Africa (Pty) Ltd supervised by the FSCA.
Products and services of Swissquote are only intended for those permitted to receive them under local law.
All investments carry a degree of risk. The risk of loss in trading or holding financial instruments can be substantial. The value of financial instruments, including but not limited to stocks, bonds, cryptocurrencies, and other assets, can fluctuate both upwards and downwards. There is a significant risk of financial loss when buying, selling, holding, staking, or investing in these instruments. SQBE makes no recommendations regarding any specific investment, transaction, or the use of any particular investment strategy.
CFDs are complex instruments and come with a high risk of losing money rapidly due to leverage. The vast majority of retail client accounts suffer capital losses when trading in CFDs. You should consider whether you understand how CFDs work and whether you can afford to take the high risk of losing your money.
Digital Assets are unregulated in most countries and consumer protection rules may not apply. As highly volatile speculative investments, Digital Assets are not suitable for investors without a high-risk tolerance. Make sure you understand each Digital Asset before you trade.
Cryptocurrencies are not considered legal tender in some jurisdictions and are subject to regulatory uncertainties.
The use of Internet-based systems can involve high risks, including, but not limited to, fraud, cyber-attacks, network and communication failures, as well as identity theft and phishing attacks related to crypto-assets.
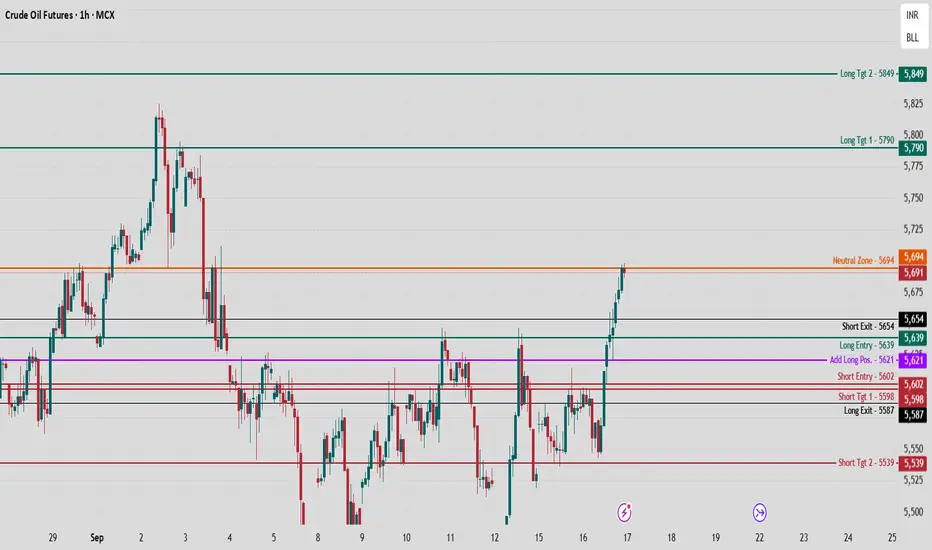
Crude Oil MCX Future Intraday Chart Analysis for 17 Sept., 25Price currently trading near 5691, consolidating at critical Neutral Zone level of 5694. The recent move from key support (around 5639) shows strong bullish momentum as prices attempt to push higher.
Key Levels:
Long entry at 5639 with potential targets at 5790 (Tgt 1) and 5849 (Tgt 2).
Short entry triggers below 5602 targeting 5598 and then 5539 for extended downside.
Neutral Zone 5694 acts as pivot; a decisive close above signals continuation of upside, while rejection could prompt short setups.
Add longs near 5621 on dips with strict stop-loss around 5587 to manage risk.
Short exit placed at 5654 - ideal for tightening stops on shorts.
Technical Bias: Bullish above Neutral Zone with clear higher highs formation. Watch intraday price action closely around 5694 for confirmation.
Trade with discipline, respect risk management levels, and keep observing price structure for valid entries.
Follow Chart Pathik for more such updates!
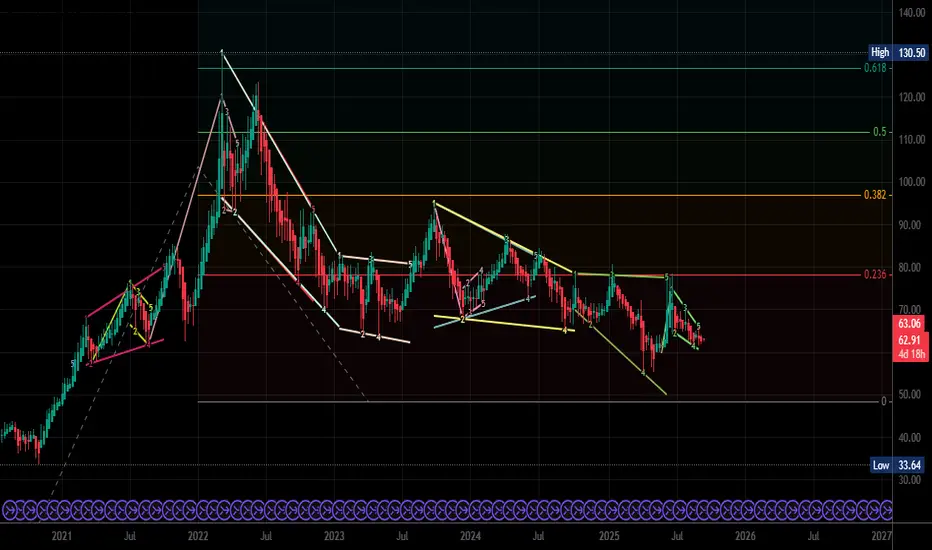
Crude: Importance Of The 61.8% Shows Resistance at 64Crude, always came close to the important 61.8% Fib, then it turned lower, broke the channel. Resistance is at $64.

CRUDE OILPreferably suitable for scalping and accurate as long as you watch carefully the price action with the drawn areas.
With your likes and comments, you give me enough energy to provide the best analysis on an ongoing basis.
And if you needed any analysis that was not on the page, you can ask me with a comment or a personal message.
Enjoy Trading ;)

CrudeOil - Long TradeCrudeOil - Long Trade
After this compression, price has break resistence zone and can have a potential final rally
Final 5 wave is on going

Long CL1!📌 When is Crude Oil & Heating Oil in High Demand & How Does It Cycle Internationally?
Crude oil and heating oil (a refined distillate product) are two of the most widely traded energy commodities in the world. Their demand is shaped not only by seasonal factors like winter heating or summer travel but also by global economic activity, geopolitical shocks, and OPEC production quotas. Traders who understand these recurring patterns can rotate positions between crude oil futures, heating oil spreads, energy ETFs, and oil major stocks, capturing profits from seasonal demand surges and international supply cycles.
🔹 1. When is Crude Oil & Heating Oil Demand Highest?
(Bullish for Crude Oil Prices, Heating Oil Futures & Energy Stocks)
✅ Q4–Q1 (October – March) → Winter Heating Season
Heating oil demand peaks in the U.S. Northeast, Europe, and Northern Asia, where it is a primary source of winter fuel.
As temperatures drop, residential and commercial heating needs surge, straining inventories.
Cold snaps and “polar vortex” events can cause sudden price spikes as heating oil consumption overshoots refinery output.
Futures traders often buy HO (Heating Oil Futures) contracts in anticipation of winter demand.
📌 Example:
January 2014 → An extremely cold U.S. winter drove heating oil up 18% in six weeks.
February 2021 → Texas freeze caused heating fuel shortages and refinery outages, spiking distillate prices.
✅ Q2–Q3 (April – September) → Driving & Travel Season
During summer, gasoline consumption surges due to U.S. driving season and global air travel demand.
Refineries run at higher capacity to meet gasoline needs, which also increases crude oil intake.
Crude oil prices tend to rise seasonally in spring/summer as gasoline crack spreads widen.
Jet fuel consumption also peaks due to increased tourism, which lifts overall refined product demand.
📌 Example:
Summer 2008 → Gasoline and jet fuel demand pushed WTI crude to its all-time high of $147/barrel.
Summer 2022 → Reopening travel demand post-COVID sent crude over $120/barrel.
✅ Year-Round Demand Drivers
1️⃣ OPEC Production Decisions – Monthly meetings determine quotas. Any announced cut usually boosts crude prices.
2️⃣ Geopolitical Risk Premiums – Middle East tensions, sanctions on Russia or Iran, or shipping lane disruptions (Suez, Strait of Hormuz) can instantly spike crude/HO prices.
3️⃣ Refinery Maintenance – Refineries shut down twice a year (spring & autumn) for maintenance. This lowers crude demand temporarily but tightens refined product supply, often bullish for heating oil and gasoline.
4️⃣ Global Economic Cycles – A booming economy increases freight, shipping, and industrial demand, supporting both crude and distillates.
🔹 2. How Crude Oil & Heating Oil Cycle Internationally
(Month-to-Month Trading Strategy)
Unlike agricultural commodities like corn that follow harvest rotations, energy commodities follow consumption and refining rotations. Traders rotate focus between crude oil, gasoline, and heating oil depending on the month:
Month Seasonal Demand Driver Strategic Trading Focus
Jan–Feb Winter heating peak in U.S. & EU Long HO futures, long refiners (MPC, VLO, PSX)
Mar–Apr Refinery maintenance lowers crude intake Watch for crude dips, trade refiner volatility
May–Jun Gasoline build for driving season Buy XLE ETF, long COP, CVX, and integrated majors
Jul–Aug Peak travel & driving season Long crude ETFs (USO), bullish on airlines & refiners
Sep–Oct Hurricane season risks in Gulf Coast Long refining stocks (MPC, VLO), heating oil spreads
Nov–Dec Start of heating oil buildup & exports Long HO futures, long exploration & production stocks
📌 Example:
Sept 2017 → Hurricane Harvey crippled Gulf Coast refineries → Gasoline & heating oil jumped 20% while crude briefly fell from lack of demand.
🔹 3. Best Stocks & ETFs to Trade Crude & Heating Oil Cycles
🌎 U.S. Oil Majors (Crude-Sensitive)
ExxonMobil (XOM) – World’s largest oil company, stable dividends, benefits from higher crude.
Chevron (CVX) – Strong upstream focus, leveraged to crude price rises.
ConocoPhillips (COP) – Heavy shale exposure, reacts quickly to oil price changes.
📌 Best Time to Buy: Q2–Q3 (driving season, higher crude demand).
🌎 U.S. Refiners (Heating Oil & Gasoline-Sensitive)
Valero Energy (VLO) – Largest independent U.S. refiner, strong heating oil exposure.
Marathon Petroleum (MPC) – Big heating oil and gasoline player.
Phillips 66 (PSX) – Integrated refiner with strong Gulf Coast presence.
📌 Best Time to Buy: Q4–Q1 (heating oil demand) & Summer (gasoline margins).
🌎 International Oil & OPEC Plays
Saudi Aramco (2222.SR) – Global OPEC leader, tied to quota shifts.
Petrobras (PBR) – Major Latin American exporter, affected by Brazilian politics.
BP (BP) & Shell (SHEL) – Diversified international majors with refining & upstream assets.
📌 Best Time to Buy: Around OPEC meetings or geopolitical volatility.
🌎 Energy ETFs & Futures
USO – U.S. Oil Fund ETF (tracks crude futures).
XLE – Energy Select SPDR ETF (oil majors).
XOP – Oil & Gas Exploration ETF (independents).
HO Futures (NYMEX) – Direct exposure to heating oil prices.
📌 Best Time to Trade:
HO Futures → Winter (Q4–Q1).
USO/XLE → Summer (Q2–Q3).
📌 Conclusion: Best Crude & Heating Oil Seasonal Strategy
✅ Winter (Oct–Mar): Focus on Heating Oil Futures (HO), Refiners (MPC, VLO, PSX) → strong distillate demand.
✅ Summer (Apr–Sep): Focus on Crude Oil (USO, COP, CVX, XLE) → gasoline & travel demand.
✅ Geopolitical/OPEC Events: Year-round opportunities to rotate into majors (XOM, BP, SHEL) and crude futures on supply disruptions.
✅ Refinery Cycles: Play spring/autumn refinery maintenance by trading spreads between crude and heating oil/gasoline.
🔹Trading Strategies Beyond Seasonality
📈 Strategy #1: The Dollar-Oil Inverse Correlation
Oil is priced globally in USD → when the dollar weakens, crude usually rises, as it becomes cheaper for foreign buyers.
Traders can exploit this by tracking both UUP (Dollar ETF) and USO (Oil ETF) together.
Rules:
If UUP ↑ > 0.25% AND USO ↑ > 0.25% from yesterday’s close → short USO at today’s close, exit next day. The vice-versa works as well, if they both fall at once.
If dollar falls and crude rises → usually long oil positions perform best.
📌 Note: USO doesn’t perfectly track oil due to roll costs and ETF structure, so results vary.
📈 Strategy #2: Friday Seasonality in Crude Oil
Crude oil has a well-documented tendency to rise on Fridays.
The edge is stronger if Thursday closes down (profit-taking + positioning for weekend risks).
Rules:
Buy on Thursday’s close if USO falls ≥ 25-day hl2 Keltner Channel, 0.75 ATR.
Exit on Friday close (or Friday open if a gap-up occurs).
📌 Best Performance: During SPY bull markets, when risk appetite is higher.
📈 Strategy #3: Heating Oil Seasonal Buy Window
Surprisingly, Heating Oil performs better before winter (Feb–Aug) rather than during.
Traders stock up ahead of the cold, creating an anticipatory rally.
Historical Edge:
Buying Heating Oil on Jan 11 and selling Aug 30 would have yielded +361% between 1999–2009 (EquityClock data).

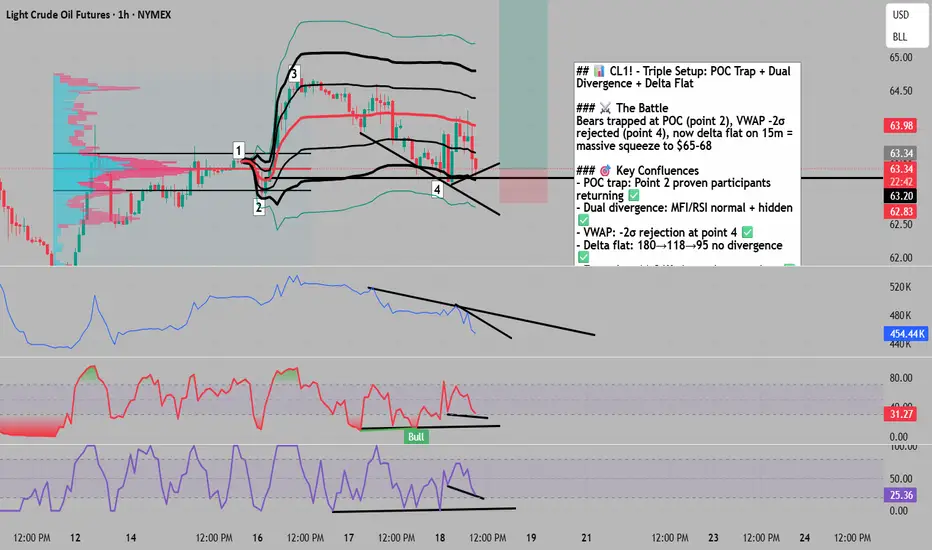
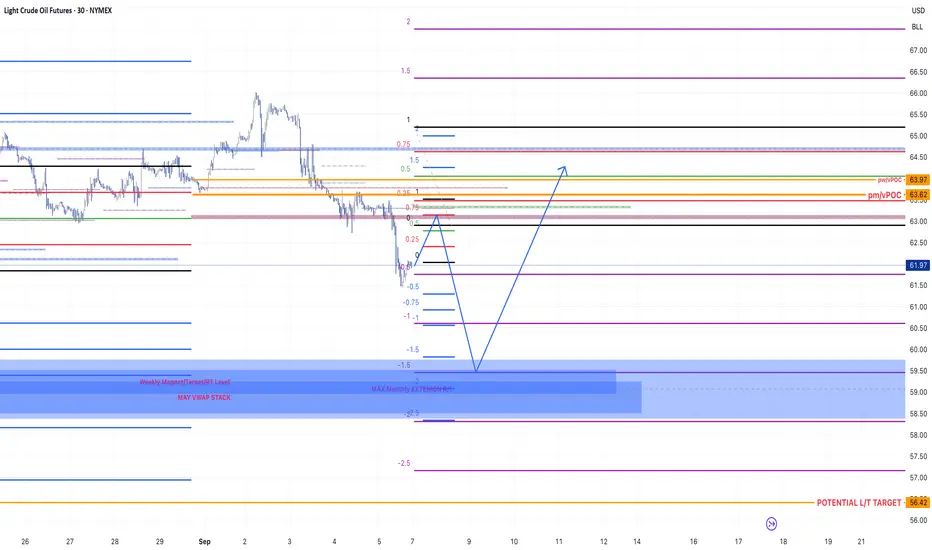
Triple Confluence: POC Return + Dual Divergence + Delta Flat🔥 CL1! Triple Confluence: POC Return + Dual Divergence + Delta Flat
The Market Participant Battle:
Bears have been systematically crushed at three critical junctures. First, at point 2 (the POC from swing 0→3), establishing proven trapped participants. Second, at point 4 where price pierced VWAP's 2nd deviation only to violently reject. Now, on the 15-minute entry timeframe, we see the final capitulation signal: delta remaining completely flat (no divergence) while price shows bullish divergence. This triple-layered setup reveals bears are not just beaten - they're exhausted, absorbed, and about to fuel a squeeze back to the $65-68 resistance zone as price returns to reclaim the proven participants at point 2.
Confluences:
Confluence 1: POC Market Participant Trap (1H Chart)
The hourly chart reveals the foundation of this trade: Point 2 marks the Point of Control from the major swing 0→3, where maximum volume traded hands. When price closed above point 1, these participants became trapped bears. Now at point 4, we're returning to this proven battleground where shorts will be forced to cover. The numbered reference points (1,2,3,4) map the complete journey of market participants from accumulation to distribution to the current return phase.
Confluence 2: Dual MFI/RSI Divergences (1H Chart)
Both MFI and RSI show an extraordinary dual-divergence setup. First, a normal bullish divergence where price made lower lows while indicators made higher lows. Second, a hidden/continuation divergence confirming the underlying trend remains bullish. This rare combination of two different divergence types on the same indicators typically precedes 3-5% moves. The divergences span from point 2 through point 4, showing sustained buying pressure despite price weakness.
Confluence 3: VWAP 2nd Deviation Rejection + Delta Flat Entry
Using VWAP anchored from point 1, price at point 4 pierced the -2 standard deviation before snapping back - a classic institutional accumulation signal. Now on the 15-minute entry timeframe, we see the trigger: delta completely flat (180→118→95) showing no divergence despite price attempts lower, combined with bullish price divergence. Volume footprint s
Crude Oil: Bullish Reversal Signals Upside Opportunity Current Price: $63.0
Direction: LONG
Targets:
- T1 = $65.0
- T2 = $68.0
Stop Levels:
- S1 = $61.5
- S2 = $60.0
**Wisdom of Professional Traders:**
This analysis synthesizes insights from thousands of professional traders and market experts, leveraging collective intelligence to identify high-probability trade setups. The wisdom of crowds principle suggests that aggregated market perspectives from experienced professionals often outperform individual forecasts. In Crude Oil markets, this intelligence highlights key technical and fundamental factors driving positioning.
**Key Insights:**
Crude Oil prices have recently shown signs of consolidation at lower levels after sharp declines throughout Q2. Market participants are assessing the ongoing macroeconomic factors, particularly softer inflation readings and a potential slowdown in global economic activity. However, bullish sentiment is beginning to grow as speculation increases around potential supply cuts by major oil-exporting nations, particularly OPEC and its allies. Historically, coordinated efforts by OPEC have served as a strong catalyst for price recovery during periods of steep declines.
Technically, Crude Oil's current price is showing the formation of a bullish reversal pattern near the $63.0 support zone. The RSI (Relative Strength Index) is exiting oversold territory, hinting at renewed buying interest. Additionally, moving averages suggest a potential crossover that aligns with upward price momentum over the short term. Key resistance levels sit at $65.0 and $68.0, with price targets tied to these benchmarks as oil prices gather steam for a rebound.
**Recent Performance:**
Crude Oil has dropped significantly from its highs of $75 earlier this year, as widespread fears of demand destruction and uncertainty in economic outlook weighed on energy markets. In recent weeks, prices have stabilized around the $63-65 range, signaling potential exhaustion from sellers. The market saw a modest relief rally during previous trading sessions, indicating a shift in sentiment and readiness for new upward momentum.
**Expert Analysis:**
Seasoned market experts suggest that the timing aligns for a strategic upside play in Crude Oil. Technical analysts point to supportive factors such as reversal candlestick formations around key support levels, combined with an uptick in trading volume hinting at stronger buyer participation. On the fundamental side, analysts anticipate OPEC's upcoming meeting could yield favorable supply cuts, reinforcing the bullish case. Additionally, the prospect of stimulus measures in major economies could positively impact overall demand for energy-related commodities, including crude.
**News Impact:**
Recent headlines have focused on political tensions in major oil-producing regions, which could disrupt supply chains. Additionally, OPEC members are reportedly leaning toward further production cuts to prop up prices. Simultaneously, discussions surrounding a potential soft landing for the U.S. economy and higher-than-expected Chinese demand are fostering optimism. Such developments may provide the catalyst needed for Crude Oil to break resistance areas in the near term.
**Trading Recommendation:**
Given Crude Oil’s stabilization near key technical support and bullish macro catalysts, a LONG position is recommended. Traders can expect momentum-driven price action toward initial targets at $65.0 and then further to $68.0, contingent on sustained strength. Stops are advised just below recent price lows at $61.5 and $60.0 to mitigate downside risks. This setup provides a favorable risk-reward ratio as market conditions hint toward upward bias.
Do you want to save hours every week?

Crude Oil - Eye twinkle to go long?The Test/Retest was expected, and it was not that clean as it is mostly. Usually I don't want to see price trading back into the fork again.
This time, price managed to jump out of it again and opened above the U-MLH. If it can close outside the fork too, then this would be a good hint for me to load the boat.
The 80% target is the yellow Centerline, or even higher, since the drillers moan about a too low price (Fundamental Fact).
Let's see if we find some petro dollars.

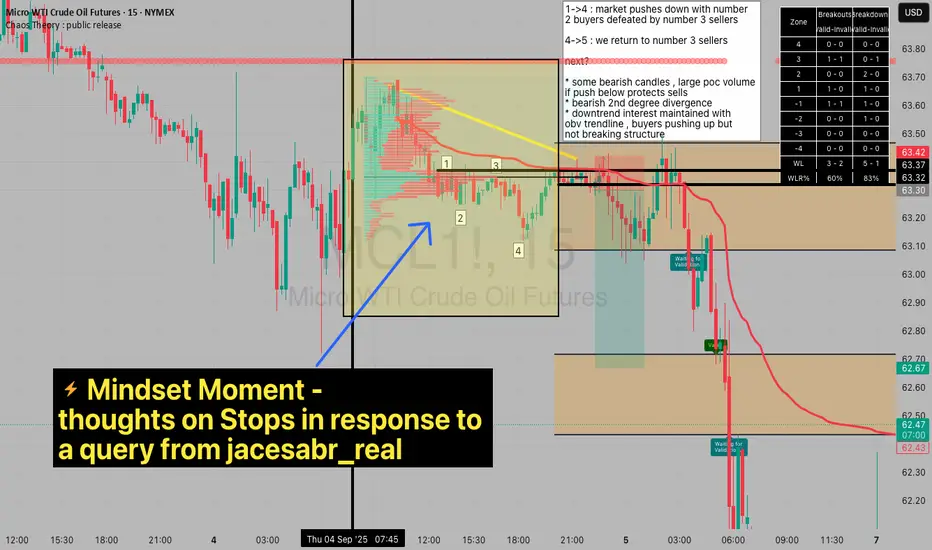
Chopped into Indecision - Some Thoughts on jacesabr_real's queryIf you’ve even felt chopped up with your trading, particularly with a situation where no matter what you do you ‘feel like your stop is getting picked off’ then you would not be alone.
jacesabr_real reached out with such a challenge last week and so I’ve offered to share a few thoughts for what they're worth. Please feel free to take what resonates and ignore the rest.
here's the original idea post :
There are 3 areas a trader needs to understand and align with in order to be able to trade successfully:
Market - The market condition: Bull, Bear, Sideways, Quiet Volatile, etc
Method - Your process/strategy for engaging with the market (breakout, mean revert, etc)
Mindset
- The emotional state of the trader throughout the lifecycle of the trade
These 3 areas overlap and despite being last in the list, I suggest that Mindset is the most important as it underpins everything. The late (great) Dr Van Tharp (featured in the original Market Wizards book) used to say that Mindset accounted for 80% of performance but later amended that to 100%.
So I’ll address this from that focal point. The reason? It’s the mind from which the process/strategy is selected, the ‘impulse’ to trade emanates and then the lived experience resides.
If a trader is having challenges with being stopped out frequently - it can result in a trader feeling like…
‘They’re picking me off’
'I was ticked out'
'The idea hasn’t failed, I’m just going to get back in again'
And it's easy to get into a revenge cycle of ‘doing the right thing’ but suffering fractional loss accumulation that adds up to a decent sized (even catastrophic) loss.
Which can lead to a loss in confidence, energy and discipline.
It’s a slippery slope. Which can lead to behaviours such as moving stops, sizing up bigger to make back, taking stops off entirely - continuing to take more trades as one is feeling ‘invested’ in the idea by sheer virtue of time spent in the process. Continue like this - maybe we get lucky and get the odd win to flatten out. Over time however, the risk is Tilt.
As you will likely understand, this is a massive area, so, a few general points that I’ll invite you to consider:
Approach your trading in this order: Mindset → Market → Method
Your Mindset may start out strong but the Market will try to wear it down
Protect your Mindset at all costs
Build steps into the process to simplify decision making.
Be clear on your rules for entry, management and exit. If you're unclear - you'll ask questions of yourself in the moment of the trade when it's hard to think clearly.
Ensure there are rules around capital preservation.
Some Suggestions:
Don’t allow revenge trading to take over… create breaker switches. (i.e. walk away!, take breaks)
Allow a re-entry of the same idea as part of your Method… but cap the number of attempts at the same trade idea to preserve capital and sanity (to perhaps 2 or 3 attempts).
Don’t remove (or move) stops… ever. Always have a worst case stop for risk management
If you’re getting stopped out frequently but the trade idea ultimately goes in your favour then your stop may be too tight (more to do with Market & Method)
Use a larger worst-case stop… and reduce position size if necessary
Monitor changes in volatility for your market (the Market condition may have changed and require an adaptation to your stop sizing to accommodate
With regards to your specific questions the following thoughts came up for me.
Many of your what if scenarios suggest that you may still need to look at your method. Pick an exit mechanism and stick with it. Collect the data points that will help inform whether your strategy is positive expectancy or not. If you keep changing the variables its really tough to track what works and what doesn't.
Get to understand your strategy and the stats around it. What is ‘normal’ in the way of number of losses. I’d suggest that seeing 4-5 losses of the same trade type a number of times a week might be a lot.
Consider the language that you are using. I notice the phrase ‘suicide stop’. Consider what that does to psychology subliminally. Perhaps use something like ‘hard stop’ or ‘capital preservation stop’ to keep your emotional balance and professionalism in your craft.
I hope this is helpful.
US CPI Number? Lets see What Crude Is Telling us... Today is the US CPI one of the most important events before the Fed’s next move
I’ve often used the relationship between US CPI and Crude oil, and it has been a reliable guide many times before.
Key points
👉Crude was down -8.5% in August → we may see a suprise with lower CPI
👉 Official expectations are for higher CPI: from 2.7% to 2.9% y/y → risk of a miss
👉Even if CPI hits 2.9%, dollar may not rally far → because its expected number
👉Dollar bottomed in Sep 2024 after Fed made 1st cut in while→ weak USD risk remains till FED cuts, then reversal

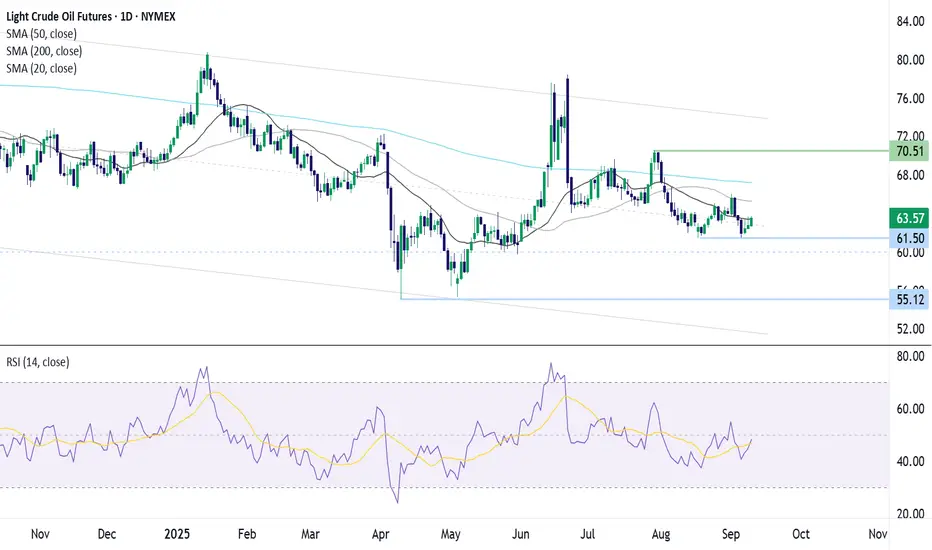
Oil tests 20 SMA resistanceOil trades within a descending channel dating back to 2023. The price also trades below its 20, 50, and 200 SMA in a bearish trend. Oil faced rejection at the 50 SMA and rebounded lower before finding support at 61.50, the August low. The price has recovered higher and is testing the 20 SMA resistance and the mid-point of the descending channel.
Buyers will need to close above 63.50 to extend gains towards 65.00, the 50 SMA, and the September high. A rise above here creates a higher high and exposes the 200 SMA.
Selles will need to break below 61.50 to create a lower low and extend the bearish trend.
FC
return to proven buyers provides continuation cheap entry 1->4 : return to number 2 proven buyers
next :
* hidden bull rsi and mfi
* freq shifted touch of lin regression line
* poc defending buyers
*obv in uptrend
*pullback to vwap

Light Crude Oil | Buy & Sell Setup | 09 Sep 2025 – 10:60 EDTLight Crude Oil Futures | Buy & Sell Setup | 09 Sep 2025 – 10:60 EDT
Ressitance Zone: 63.55 – 63.00
Scenario 1 : Buy
Entry: 63.55
Stop Loss: 63
Targets:
TP1 → 64.82
TP2 → 65.54
TP3 → 66.00
Analysis:
From Buy Zone (63.55 – 63) creates possibilities for a buy move.
Scenario 2 : Sell
Entry: 63
Stop Loss: 63.55
Targets:
TP1 → 62.37
TP2 → 61.85
Analysis:
Below Resistance Zone (63.55 – 63) creates possibilities for a sell move.
Stay alert on updates here.
⚠️ Disclaimer: This idea is shared for educational purposes only and should not be considered financial advice. Please do your own analysis before making trading decisions.

Crude Oil Idea of week 08-12/09/25This week I see Oil continuing lower with a potential bullish reaction after reaching lower price areas of interest. Monitoring price action on Monday to decide what we will attack and trade. I wouldn't be surprised if this week is choppy!
Always caution, patience and risk!
GL!
If you like the content give me a follow on X!
Check Bio. Cheers!
From Mystery to Mastery: Trading EssentialsIntroduction: Why Trading Feels Like a Mystery
For many aspiring traders, the markets appear as a mysterious puzzle. Prices move in ways that often feel unpredictable, charts are filled with patterns that seem random, and every strategy seems to work until it suddenly doesn’t. This is why trading so often feels like a mystery: it blends human behavior, technical structures, and ever-changing fundamentals into one living system.
Yet behind this apparent chaos lies a logic. The transition from “mystery” to “mastery” begins with understanding that trading is not about luck, but about process. Just like a scientist doesn’t guess but instead forms hypotheses, tests them, and adapts based on evidence, traders must approach the markets with discipline and structure.
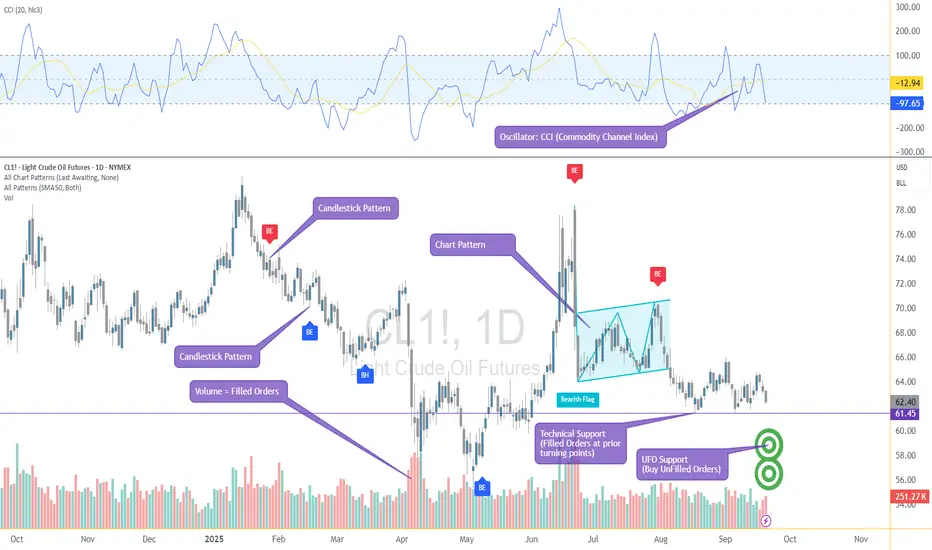
The main chart attached to this article is a good reminder of this. At first glance, it looks overwhelming: candlestick patterns, oscillators, UFO support and resistance zones, chart patterns, and volume data all layered together. But this is not noise — it’s information. Each element highlights a different aspect of market behavior. Once organized and understood, these tools stop being mysterious and instead form the building blocks of trading mastery.
In this guide, we’ll walk step by step through those building blocks: how markets are structured, how trades are placed, how risk is managed, how strategies are built, and how psychology influences decisions. Along the way, you’ll see how these concepts work together to transform confusion into clarity.
Trading mastery doesn’t come overnight, but the journey begins the moment you stop chasing secrets and start building a foundation.
Understanding Market Types
Not all markets are created equal. Before diving into strategies and chart patterns, it’s important to recognize that different markets operate under different structures. Knowing where you are trading — and how those markets function — can be the difference between confidence and confusion.
Exchange-Traded Markets
In exchange-traded markets such as futures or stocks, trading takes place on centralized venues. This means:
Prices are transparent, with all participants seeing the same quotes.
Orders are matched through a regulated system, reducing counterparty risk.
Clearing houses guarantee performance, ensuring that when one side of a trade wins, the other side’s obligations are met.
This structure creates confidence, especially for leveraged instruments like futures, where position sizes can be large.
Over-the-Counter (OTC) Markets
On the other side, forex, crypto and many other derivatives are traded over-the-counter. Here, there is no central exchange — trades are made directly between counterparties, such as banks or brokers.
Prices can vary slightly between providers.
Liquidity depends on the institution offering quotes.
Most importantly, there is counterparty risk — the risk that the other side may not honor the trade.
While OTC markets can be deep and liquid, traders must understand the role of intermediaries and the risk they take on when choosing where and how to trade.
Why It Matters
The choice between exchange-traded and OTC instruments affects everything: order execution, spreads, transparency, and even regulation. Many professional traders favor exchange-traded products for their transparency and reliability, but OTC instruments remain popular due to accessibility and flexibility.
Whether you’re trading futures on the CME or currency pairs in the OTC forex market, the principle is the same: know your marketplace, because the rules of engagement define the playing field.
The Mechanics of Trading
Once you know where you’re trading, the next step is to understand how trades are actually placed. This is where many traders feel overwhelmed, because order types, execution rules, and volume data can feel like a different language. But when broken down, the mechanics are straightforward.
Order Types: The Building Blocks
Market Orders: Execute immediately at the best available price. Fast, but can suffer from slippage in fast-moving markets.
Limit Orders: Specify the maximum price you’re willing to pay (buy) or the minimum price you’ll accept (sell). Excellent for controlling entry, but no guarantee of execution.
Stop Orders: Triggered once price hits a certain level, commonly used for stop-losses.
Bracket Orders: Automating Discipline
One of the most practical tools for managing trades is the bracket order. Instead of placing just an entry, a bracket order automatically places:
A stop-loss order to protect against adverse moves.
A profit-taking order to lock in gains.
This setup creates a “bracket” around your trade, ensuring that risk and reward are defined from the start. It shifts the trader’s mindset from hoping to managing.
Volume: The Footprint of Filled Orders
Volume is more than a number at the bottom of a chart — it’s the record of filled orders. When volume surges at a level, it shows where buyers and sellers agreed most aggressively. Combined with support/resistance or UFO zones, volume can help traders identify which levels have strong institutional participation.
Execution Matters
Bid-ask spreads, commissions, and slippage all impact profitability. A great strategy can still fail if execution costs aren’t managed. This is why many traders choose more liquid products — deeper liquidity usually means tighter spreads and better fills.
By mastering these mechanics — order types, brackets, and the interpretation of volume — traders gain the ability to structure trades with precision instead of improvisation.
Core Principles of Risk Management
If there’s one constant across all successful traders, it’s this: they never risk their capital blindly. Strategies may differ, but the principles of risk management remain universal.
Risk per Trade
A common practice is to limit the risk of any single trade to a small percentage of account equity — often 1–2%. This way, even a series of losing trades doesn’t wipe out a portfolio.
Position Sizing
Lot size isn’t just about ambition, it’s about survival. Position sizing must reflect both account size and volatility of the instrument. A highly volatile product like crude oil futures demands a smaller size than a low-volatility product like Treasury futures, even if account equity is the same.
Reward-to-Risk Ratio
Before placing a trade, the potential reward should always justify the risk. For example, risking 10 points to potentially gain 30 points gives a 3:1 reward-to-risk ratio — meaning you can be wrong more often than right and still be profitable over time.
Support, Resistance, and UFO Levels
Risk management becomes more effective when combined with technical reference points. Placing a stop-loss just beyond a well-defined support or UFO zone means that if price breaks through, the trade’s premise is invalidated. Similarly, setting profit targets near resistance zones allows traders to exit before momentum fades.
The Role of Discipline
None of these rules matter without discipline. A trader who moves stops, doubles down on losers, or takes oversized positions is effectively abandoning their edge. Consistency, not heroics, is what keeps traders in the game long enough to grow.
By embedding risk management into every decision, traders shift from chasing trades to controlling outcomes. The market will always be uncertain, but risk can always be defined.
Strategy Frameworks
While no strategy works all the time, every successful trader operates within a clear framework. Frameworks provide structure, helping traders decide when to engage the market and how to manage trades once they’re in.
Trend Following
The principle: “the trend is your friend.”
Traders look for higher highs and higher lows in an uptrend, or lower highs and lower lows in a downtrend.
Tools: moving averages, trendlines, and momentum indicators help confirm direction.
Mean Reversion
The assumption: prices oscillate around a fair value.
Traders buy when prices move far below the average and sell when they stretch too far above.
Tools: oscillators such as RSI or Stochastics signal overbought/oversold conditions.
Breakout Trading
Focused on capturing momentum when price escapes a range.
Traders identify consolidation zones and look for strong volume when price breaks through support or resistance.
Tools: candlestick patterns and chart patterns (triangles, rectangles, flags) often mark breakout points.
Volatility-Based Trading
Markets don’t just move in one direction; they expand and contract in volatility cycles.
Volatility traders adapt position size, target levels, and even strategy choice depending on whether the market is calm or turbulent.
The Role of Confirmation
Frameworks are strengthened when multiple signals align. For example, a breakout confirmed by a candlestick pattern and supported by volume at a UFO level carries more weight than a breakout without confirmation.
By mastering these strategy families, traders learn to adapt their approach to different environments instead of forcing one method onto all markets. Flexibility, not rigidity, is the true hallmark of mastery.
The Trader’s Process as a Scientific Method
The biggest difference between beginners and professionals isn’t the chart setup — it’s the process. Professionals treat trading as a science, not a game.
Step 1: Form a Hypothesis
Just like in a laboratory, the process begins with a hypothesis: “If price breaks above resistance with strong volume, then it is likely to continue higher.” The hypothesis defines what you expect and under what conditions.
Step 2: Backtest the Hypothesis
Rather than risking money immediately, traders test their idea against historical data. The goal is not to prove the trade will work, but to see whether it has worked consistently under similar conditions.
Step 3: Evaluate the Results
If backtesting shows inconsistent outcomes, the hypothesis must be refined or discarded. If results show positive expectancy, the door opens to the next stage.
Step 4: Trade Small in Live Markets
Even a strong backtest doesn’t guarantee success in the real world. Execution, slippage, and emotions enter the equation. That’s why traders begin with small size in live markets to confirm that performance holds.
Step 5: Scale with Confidence
Only after a hypothesis survives both backtesting and live verification should size be increased. At this point, the trader has turned uncertainty into structured probability.
By approaching the market scientifically, traders avoid gambling behavior. Instead of chasing tips or hunches, they move step by step, letting data guide decisions. In doing so, they transform trading from a mysterious guessing game into a disciplined pursuit of mastery.
Psychology of Trading
Even with a solid strategy and risk plan, many traders still struggle — not because the markets beat them, but because their own minds do. Psychology is the silent force that shapes every decision.
Discipline Over Impulse
The temptation to move stops, double down on losing trades, or exit winners too early is constant. Without discipline, even the best strategy collapses under emotional pressure.
Common Biases
• Recency bias: believing that the most recent outcome will repeat.
• Loss aversion: cutting winners short while letting losers run.
• Confirmation bias: searching for information that supports your existing view while ignoring evidence against it.
Emotional Cycles
Traders often swing between fear and greed. Fear prevents them from taking valid setups, while greed leads them to overtrade or oversize. Recognizing these emotional cycles is the first step toward controlling them.
The Power of Journaling
A trading journal records not just trades, but also the reasoning and emotions behind them. Over time, it becomes a mirror that reveals behavioral patterns — both strengths and weaknesses.
Process > Outcome
Individual trade results are largely random. Mastery comes from focusing on process rather than outcome. Following the plan consistently matters more than whether the next trade wins or loses.
By understanding and managing psychology, traders learn to master themselves first. The market will always test patience and conviction, but the disciplined trader treats emotions as signals to be managed — not instructions to follow.
Case Study: A Structured Trade Example
Theory becomes powerful only when applied in practice. Let’s walk through a trade example using the below chart attached.
Setup
The market is trending upward, confirmed by the SMA ribbon sloping higher.
A UFO support zone aligns with prior price action, creating a logical area where buyers may step in again.
A candlestick wick test into this zone provides confirmation of demand.
Trade Execution
Entry: Buy as price approaches the UFO support zone, in line with the trend.
Bracket Order: Place both a stop-loss and a profit target automatically.
(Stop-Loss: Positioned just below the UFO support zone. If price breaks down through support, the trade’s hypothesis is invalid. | Target: Set at the next UFO resistance zone, where prior sellers are likely to appear.)
Risk-to-Reward Balance
The defined stop ensures risk is limited.
The distance from entry to target is significantly larger than the distance to the stop, producing a favorable reward-to-risk ratio.
Outcome
Whether this trade wins or loses is secondary — the key is that it was structured with:
A clear hypothesis.
A defined entry, stop, and target.
Proper use of a bracket order.
Risk contained and reward potential aligned.
This is what separates structured trading from guesswork. Each element — support, UFOs, moving averages, and volume — works together as part of a process-driven decision, not an emotional one.
Conclusion: From Mystery to Mastery
For many traders, the markets begin as a blur of candles and numbers — a mystery that seems impossible to solve. But as we’ve seen, mastery doesn’t come from secrets or shortcuts. It comes from building a structured foundation:
Knowing the market type you’re trading, and whether it’s exchange-traded or over-the-counter.
Understanding the mechanics of orders, brackets, and volume.
Applying risk management principles that define losses before they happen.
Using strategy frameworks to adapt to different conditions.
Following a scientific process that tests hypotheses before scaling them.
Developing the psychological discipline to follow the plan consistently.
Executing trades with structure, where every element — entry, stop, and target — has a reason.
Trading mastery is not about eliminating uncertainty. It’s about controlling what you can — risk, process, discipline — and allowing the market to do the rest. The mystery never fully disappears, but with the right approach, it becomes manageable, even profitable.
This article is the first step in our From Mystery to Mastery series. Here, we’ve laid the foundation for trading in general. From here, we’ll expand into the specialized worlds of futures and options, where leverage, diversification, and advanced strategies open even more doors.
The journey continues — but the path is now clearer.
From Mystery to Mastery trilogy:
When studying markets, it’s important to remember that chart data can sometimes be delayed. This article has presented concepts that apply broadly to trading across all asset classes. The chart examples used here happen to feature products listed on exchanges operated by the CME Group. For traders who follow these products closely and wish to access real-time market data, TradingView offers a dedicated CME Group real-time data plan: www.tradingview.com . This is particularly relevant for shorter-term traders who depend on precise price action, though longer-term participants may find delayed data sufficient for their needs.
General Disclaimer:
The trade ideas presented herein are solely for illustrative purposes forming a part of a case study intended to demonstrate key principles in risk management within the context of the specific market scenarios discussed. These ideas are not to be interpreted as investment recommendations or financial advice. They do not endorse or promote any specific trading strategies, financial products, or services. The information provided is based on data believed to be reliable; however, its accuracy or completeness cannot be guaranteed. Trading in financial markets involves risks, including the potential loss of principal. Each individual should conduct their own research and consult with professional financial advisors before making any investment decisions. The author or publisher of this content bears no responsibility for any actions taken based on the information provided or for any resultant financial or other losses.