COCOA Idea 23.11.The market and cocoa are currently at the level where I would like to take a possible long trade in SFP below the current value low at the level of 5377. If the market were to go lower, I see a level of around 4000.
Related commodities

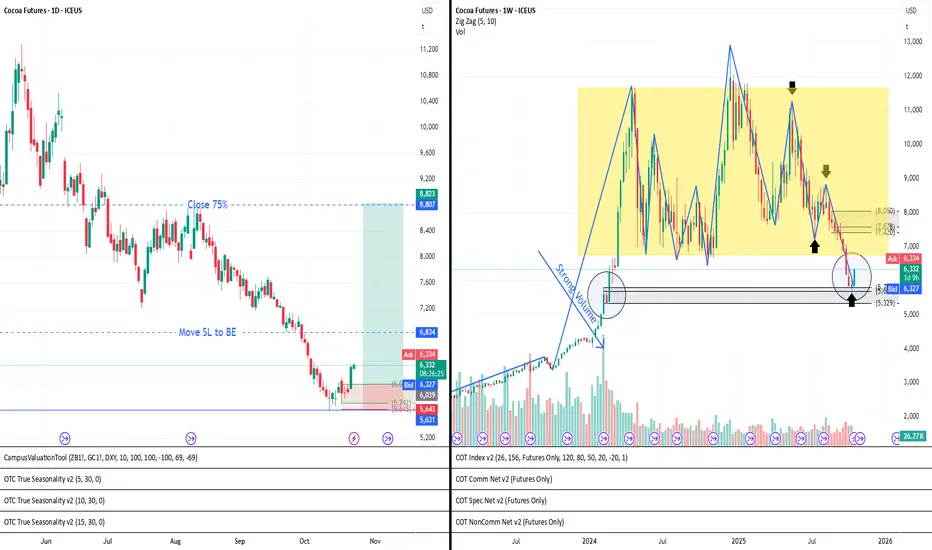
COCOA FUTURES |Long Setup | El Niño Aftershock | Nov 7, 2025COCOA FUTURES (CC1!) | Long Setup | Seasonal Tightness, El Niño Aftershock, Channel Base Retest | Nov 7, 2025
🔹 Thesis Summary
Cocoa sits at the lower rail of a multi-year rising channel while global stocks remain tight after 2024–25 weather shocks. Seasonality turns constructive into Q4–Q1, and th

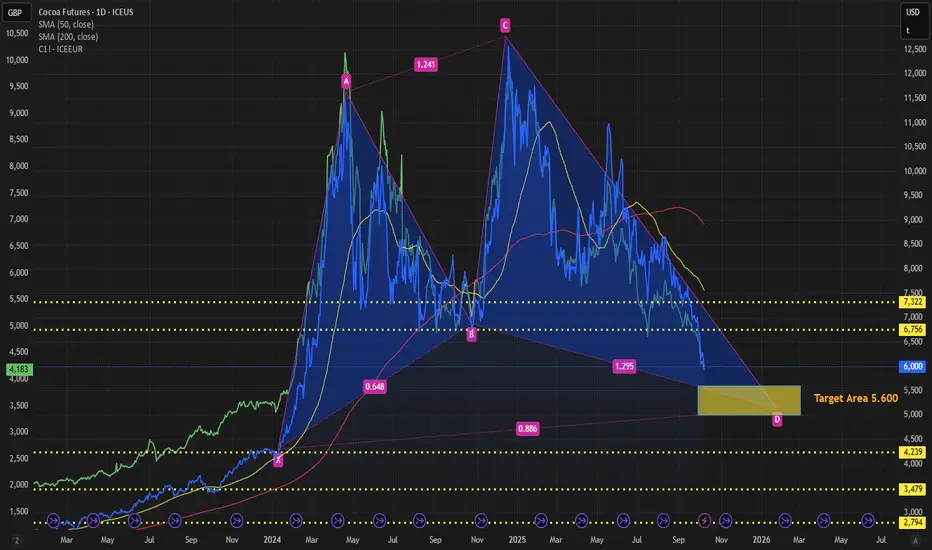
Cocoa Crash: From $12,000 to $6,000 — Over 50% Drop in 2025After hitting record highs above $12,000 per ton in April 2024, cocoa futures ( NYSE:CC ) have plunged more than 53%, now trading near $6,000.
The selloff comes as supply pressures ease in West Africa, speculative longs unwind, and better weather improves harvest outlooks.
Still, chocolate prices

23.10.25 Cocoa Weekly buyWeekly
Cocoa reacted from a previous demand zone (Rally-Base-Rally, wider version) and it looks like it may be forming a Drop-Base-Rally pattern. This will be confirmed or invalidated with the close of this week.
At the moment, there is no clear trend, as there is still no confirmation according t
Cocoa Futures (CC1!)Cocoa prices in New York are down over -50% from their all-time high in 2024 (Blue Line); but London prices have declined -58% from their April 2024 peak (Green Line), to $4,262, the lowest in 20 months. New York prices are still above the 20-year average of ~$2,700 per ton. What's driving the Londo
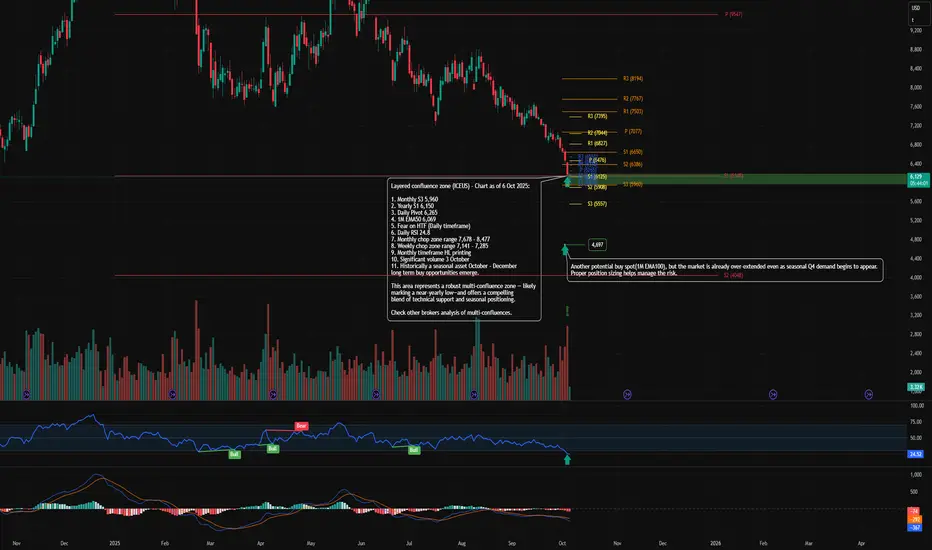
Cocoa ICEUS - Support (5,950-6,250) | Multi-Confluence AnalysisCocoa Seasonal Confluence Zone – Q4 Outlook
This is a multi-confluence analysis of cocoa futures, combining seasonal patterns, structural levels and institutional positioning zones .
All key levels and insights are annotated directly on the charts for clarity and quick visual reference.
Sea
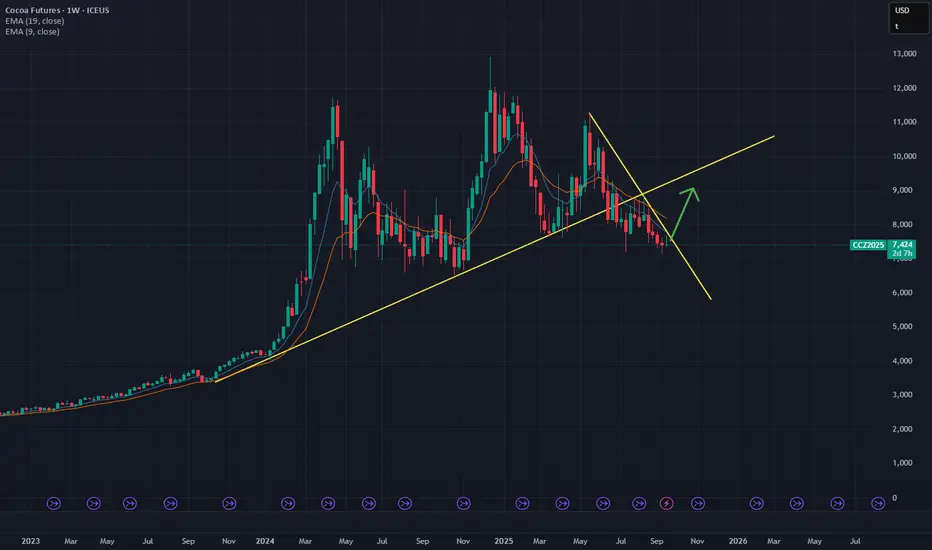
Cocoa Futures (ICE) – Long Trade Setup🍫 Cocoa Futures (ICE) – Long Trade Setup
Direction: Long Bias
Contract: Cocoa (NY / ICE)
Current Price: ~7,437
🔍 Technical Setup
Price has been consolidating after the sharp run-up and has now pulled back into a key long-term trendline (yellow support).
A downtrend channel breakout is forming –
Long Chocolate📌 Cocoa Futures: Seasonality, Trading Strategies & Market Drivers
Cocoa is more than just the foundation of chocolate; it’s a soft commodity with centuries of economic significance. Once used as currency by ancient civilizations in Central and South America, cocoa became a global commodity after th

CACAO ShortCC is now net short on the regression break.
The roll on commodity = +2.2% in the short direction.
CC LongCC1! is now net long on the regression break.
The roll on this pair long is +9%.
I am considering this trade.

See all ideas
A representation of what an asset is worth today and what the market thinks it will be worth in the future.
Displays a symbol's price movements over previous years to identify recurring trends.