US 30Preferably suitable for scalping and accurate as long as you watch carefully the price action with the drawn areas.
With your likes and comments, you give me enough energy to provide the best analysis on an ongoing basis.
And if you needed any analysis that was not on the page, you can ask me with a comment or a personal message.
Enjoy Trading ;)
Trade ideas

US30 – Correction Toward 47100 | Next Leg Up Toward 47920US30 – MARKET OUTLOOK | Bullish Bias Above 47100
US30 is showing a mild bearish correction after facing resistance near 47460, but the broader structure remains bullish while price holds above 47100.
🔼 Above 47460: Bullish continuation toward 47750 → 47920 → 48200.
🔽 Below 47100: Bearish correction possible toward 46920 → 46600.
Pivot: 47430
Support: 47100 · 46920 · 46600
Resistance: 47750 · 47920 · 48200
US30 stays bullish while above 47100, but a confirmed close below this level could trigger a short-term bearish correction toward 46920.

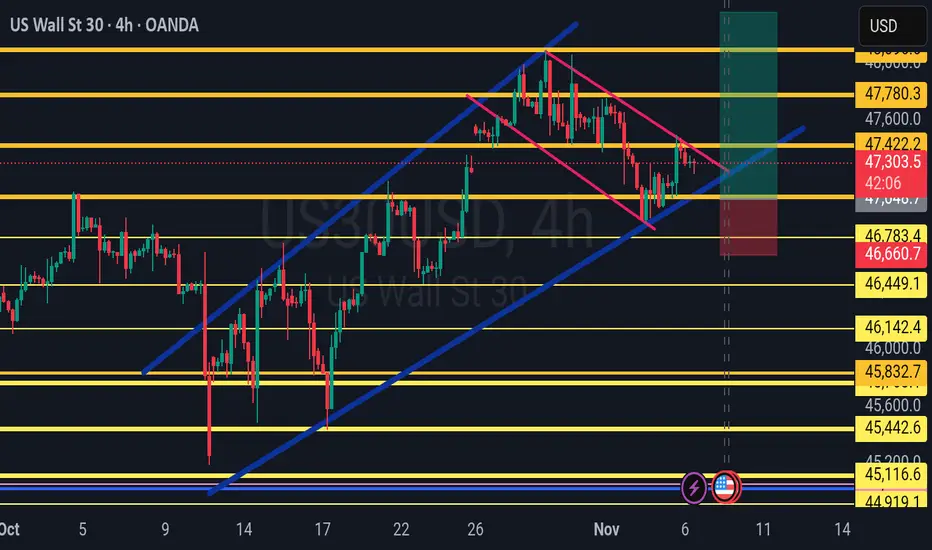
US30 LONG SETUP Price is looking to test 48.000 again after a strong correction that pushed it back to 47. region. Healthy support around 47 has been met on point with the 50% fib level. Strong push back to 48 is promising.
US30 BUY WITH LIMIT ORDER!!!!!US30 made a strong rejections off the order block zone am going to be positioning for a buy entry on the pull back in the inside bar candle on the buy zone i marked....

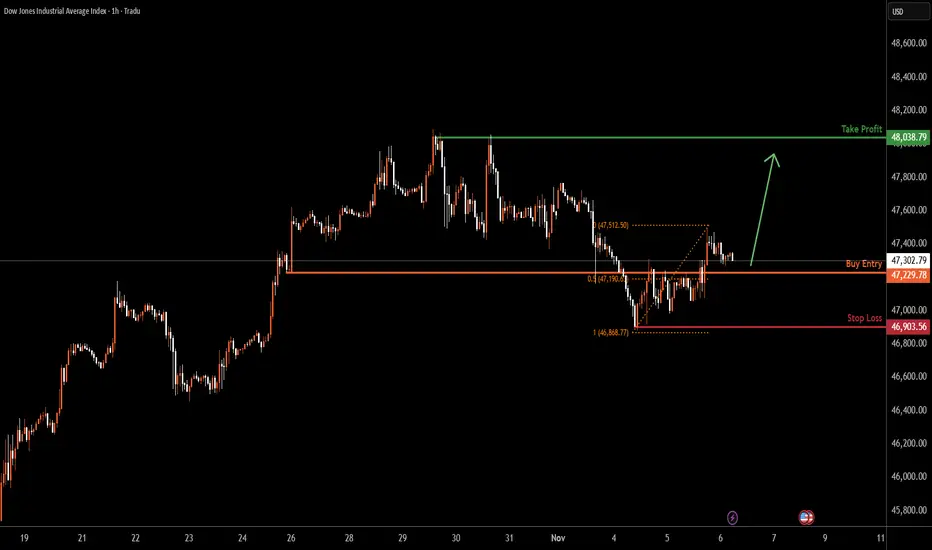
US30 H1 | Bullish Bounce Off 50% Fibonacci SupportUS30 is falling towards the buy entry at 47,229.78, whichis an overlap support that aligns witht he 50% Fibonacci retracement and could bounce from this level to the upside.
Stop loss is at 46,903.56, which is a swing low support.
Take profit is at 48,038.79, which is a multi swing high resistance.
Stratos Markets Limited (tradu.com ):
CFDs are complex instruments and come with a high risk of losing money rapidly due to leverage. 68% of retail investor accounts lose money when trading CFDs with this provider. You should consider whether you understand how CFDs work and whether you can afford to take the high risk of losing your money.
Stratos Europe Ltd (tradu.com ):
CFDs are complex instruments and come with a high risk of losing money rapidly due to leverage. 70% of retail investor accounts lose money when trading CFDs with this provider. You should consider whether you understand how CFDs work and whether you can afford to take the high risk of losing your money.
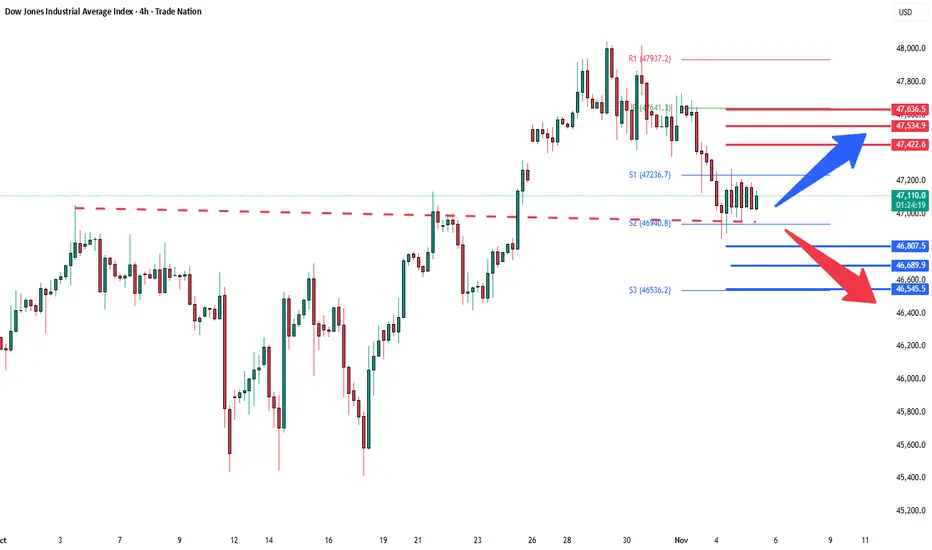
DowJones strong support retest Key Support and Resistance Levels
Resistance Level 1: 47433
Resistance Level 2: 47534
Resistance Level 3: 47636
Support Level 1: 46807
Support Level 2: 46690
Support Level 3: 46545
This communication is for informational purposes only and should not be viewed as any form of recommendation as to a particular course of action or as investment advice. It is not intended as an offer or solicitation for the purchase or sale of any financial instrument or as an official confirmation of any transaction. Opinions, estimates and assumptions expressed herein are made as of the date of this communication and are subject to change without notice. This communication has been prepared based upon information, including market prices, data and other information, believed to be reliable; however, Trade Nation does not warrant its completeness or accuracy. All market prices and market data contained in or attached to this communication are indicative and subject to change without notice.
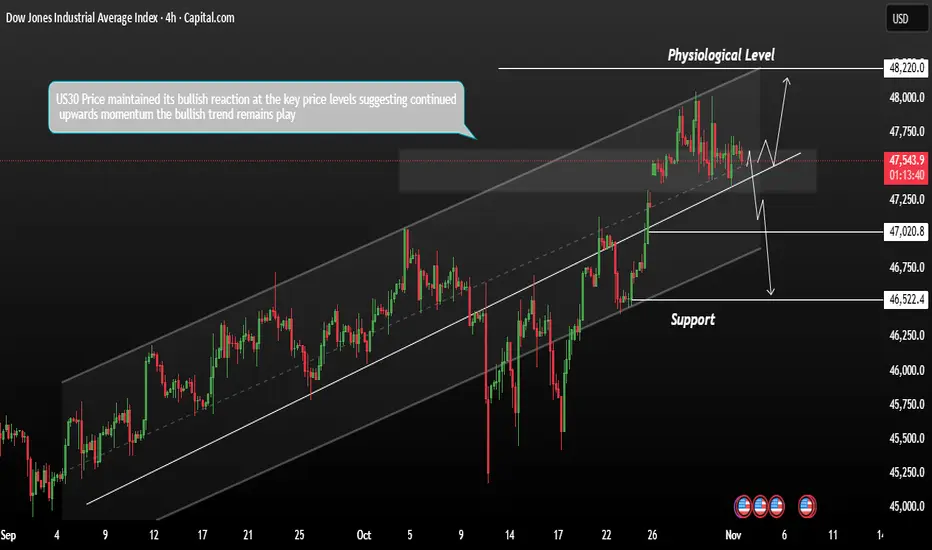
US30 Technical Outlook – Bullish Momentum IntactThe US30 maintained its bullish reaction at key price levels, suggesting continued upward momentum. As November begins, the index futures gained on Monday, supported by optimism around U.S.–China trade relations and stronger demand sentiment.
Currently, the bullish trend remains in play. If price continues to react positively to current support zones, we could see a potential move toward the next major psychological resistance level at 48,220.
However, if price fails to hold above current levels and we see a bearish reaction, a pullback could be triggered toward the support area between 47,030 and 46,520.
You may find more details in the chart.
Trade wisely best of Luck Buddies,
Ps; Support with like and comments for better analysis Thanks for Supporting.
Potential bullish bounce off?Dow Jones (US30) has bounced off the pivot, which is a pullback support and could rise to the 1st resistance, which is a swing high resistance.
Pivot: 46,869.22
1st Support: 46,429.35
1st Resistance: 48,012.20
Disclaimer:
The above opinions given constitute general market commentary, and do not constitute the opinion or advice of IC Markets or any form of personal or investment advice.
Any opinions, news, research, analyses, prices, other information, or links to third-party sites contained on this website are provided on an "as-is" basis, are intended only to be informative, is not an advice nor a recommendation, nor research, or a record of our trading prices, or an offer of, or solicitation for a transaction in any financial instrument and thus should not be treated as such. The information provided does not involve any specific investment objectives, financial situation and needs of any specific person who may receive it. Please be aware, that past performance is not a reliable indicator of future performance and/or results. Past Performance or Forward-looking scenarios based upon the reasonable beliefs of the third-party provider are not a guarantee of future performance. Actual results may differ materially from those anticipated in forward-looking or past performance statements. IC Markets makes no representation or warranty and assumes no liability as to the accuracy or completeness of the information provided, nor any loss arising from any investment based on a recommendation, forecast or any information supplied by any third-party.

US30 H4 | Bullish Bounce Off OBUS30 is having a temporary correction towards the downside. However, there is a Fair Value Gap and Order Block present, which could cause price to bounce from that area.
Our buy entry is in between the FVG and OB, at 46,883, which also aligns with the 75% FIbonacci retracement level.
The stop loss is at 46,509, which is at the swing low support level, while the take profit is at 47,460, which is at the pullback resistance level.
Stratos Markets Limited (tradu.com/uk ):
CFDs are complex instruments and come with a high risk of losing money rapidly due to leverage. 68% of retail investor accounts lose money when trading CFDs with this provider. You should consider whether you understand how CFDs work and whether you can afford to take the high risk of losing your money.
Stratos Europe Ltd (tradu.com/eu ):
CFDs are complex instruments and come with a high risk of losing money rapidly due to leverage. 70% of retail investor accounts lose money when trading CFDs with this provider. You should consider whether you understand how CFDs work and whether you can afford to take the high risk of losing your money.


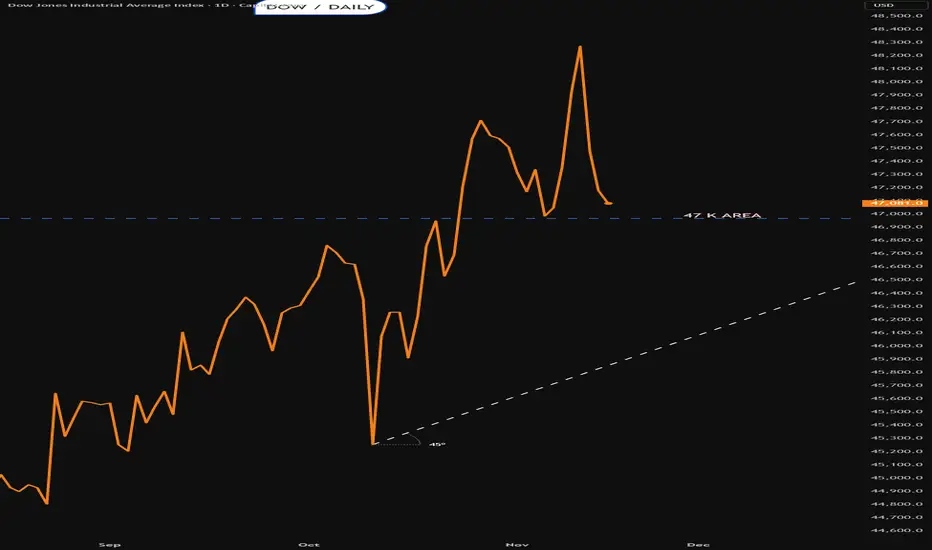
$DJIDJI is showing signs of weakness we may be entering a correction phase.
With the government searching for capital to “keep America great,” it’s coming at a big cost.
We could see a sell-off of weaker assets to clear the path for the next bullish wave in 2026. 📉➡️📈

Us30 long US30 (Dow Jones Index) – Market Outlook & Trade Setup
Currently observing a potential bullish reaction from the demand zone around the 47,500 region after multiple rejections at this level.
If price maintains above this support, I’m anticipating a continuation toward the 48,180 area — aligning with prior liquidity and supply levels.
This setup combines:
• Structure confirmation from previous higher lows
• Demand zone retest for potential entry
• Clear risk-to-reward framework with defined targets
Patience and precision remain key. Let’s see how price action develops going into the next session. 📊
#US30 #MarketAnalysis #TradingInsights #DowJones #TechnicalAnalysis #FinancialMarkets

Bullish bounce off?DJ30 is falling towards the support level, which is a pullback support that aligns with the 38.2% Fibonacci retracement and could bounce from this level to our take-profit.
Entry: 47,0090.29
Why we like it:
There is a pullback support that aligns with the 38.2% Fibonacci retracement.
Stop loss: 46,642.72
Why we like it:
There is an overlap support that is slightly below the 50% Fibonacci retracement.
Take profit: 48,056.22
Why we like it:
There is a swing high resistance level.
Enjoying your TradingView experience? Review us!
Please be advised that the information presented on TradingView is provided to Vantage (‘Vantage Global Limited’, ‘we’) by a third-party provider (‘Everest Fortune Group’). Please be reminded that you are solely responsible for the trading decisions on your account. There is a very high degree of risk involved in trading. Any information and/or content is intended entirely for research, educational and informational purposes only and does not constitute investment or consultation advice or investment strategy. The information is not tailored to the investment needs of any specific person and therefore does not involve a consideration of any of the investment objectives, financial situation or needs of any viewer that may receive it. Kindly also note that past performance is not a reliable indicator of future results. Actual results may differ materially from those anticipated in forward-looking or past performance statements. We assume no liability as to the accuracy or completeness of any of the information and/or content provided herein and the Company cannot be held responsible for any omission, mistake nor for any loss or damage including without limitation to any loss of profit which may arise from reliance on any information supplied by Everest Fortune Group.


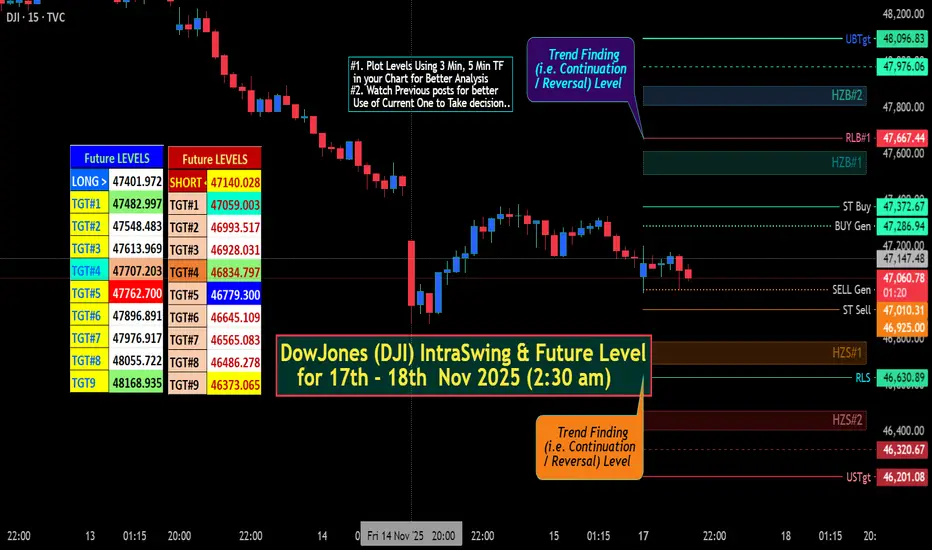
DowJones (DJI) IntraSwing & Future Level for 17th - 18th Nov 25✍🏼️ "Future IntraSwing Levels" mentioned in BOX format.
Useful to Tally / Recognize for Next day Trade Plan.
[ Level Interpretation / description:
L#1: If the candle crossed & stays above the “Buy Gen”, it is treated / considered as Bullish bias.
L#2: Possibility / Probability of REVERSAL near RLB#1 & UBTgt
L#3: If the candle stays above “Sell Gen” but below “Buy Gen”, it is treated / considered as Sidewise. Aggressive Traders can take Long position near “Sell Gen” either retesting or crossed from Below & vice-versa i.e. can take Short position near “Buy Gen” either retesting or crossed downward from Above.
L#4: If the candle crossed & stays below the “Sell Gen”, it is treated / considered a Bearish bias.
L#5: Possibility / Probability of REVERSAL near RLS#1 & USTgt
HZB (Buy side) & HZS (Sell side) => Hurdle Zone,
*** Specialty of “HZB#1, HZB#2 HZS#1 & HZS#2” is Sidewise (behaviour in Nature)
Rest Plotted and Mentioned on Chart
Color code Used:
Green =. Positive bias.
Red =. Negative bias.
RED in Between Green means Trend Finder / Momentum Change
/ CYCLE Change and Vice Versa.
Notice One thing: HOW LEVELS are Working.
Use any Momentum Indicator / Oscillator or as you "USED to" to Take entry.
⚠️ DISCLAIMER:
The information, views, and ideas shared here are purely for educational and informational purposes only. They are not intended as investment advice or a recommendation to buy, sell, or hold any financial instruments. I am not a SEBI-registered financial adviser.
Trading and investing in the stock market involves risk, and you should do your own research and analysis. You are solely responsible for any decisions made based on this research.
"As HARD EARNED MONEY IS YOUR's, So DECISION SHOULD HAVE TO BE YOUR's".
Do comment if Helpful .
In depth Analysis will be added later (If time Permits)
US30 Price ActionReasons for Long
1. Trend Bullish
2. Pattern - Inverted H&S
3. Structure - HH & HL
4. RR: 8R+
Alternative probabilities
1. Price can hunt stop loss from recent swings & give traget after stop loss hunt


Dow into the open Monday 17th NovemeberLets see if it can hold that pivot area
Poss bear traps below
Lets see
US30 Trade Set Up Nov 17 2025Price has left a daily FVG that will need to be filled this week but first i want to see a sweep of SSL or PDL followed by internal 1m-5m IFVG/CISD to target BSL

US30 Technical Breakdown – 11/17/2025📍 US30 Technical Breakdown – 11/17/2025
US30 rejected the 47,400–47,450 resistance zone, forming a clean lower high as bearish momentum starts to build. After failing to reclaim the EMA cluster, price is now heading back toward the 47,100–47,000 structure zone — a key level that determines whether downside continues or buyers step in again 👀📉.
📊 Market Behavior:
🔹 Clear rejection from the 47,450 supply zone
🔹 EMAs crossing bearish → momentum shifting downward
🔹 Lower-high structure forming → sellers gaining control
📌 Key Levels:
🔹 Resistance:
47,450 → major intraday supply / rejection point
47,300 → EMA cluster + bearish retest zone
🔹 Support:
47,111 → first bounce zone
47,000 → structural support / psychological level
46,519 → deeper demand zone
🧠 Bias:
Bearish pressure building 📉
⬇️ Break below 47,111 → opens the move toward 47,000–46,850
⬆️ Reclaim of 47,300+ → shifts momentum back to neutral

US30 - CLS Monthly vs Daily US30
Monthly CLS Range ,
2nd candle is forming
On the Daily timeframe, if price pulls back, a potential entry lies at the BPR zone, which acts as a strong confluence area.
🎯 Target: 50% level → 46,639.6
Mentor :
@David_Perk

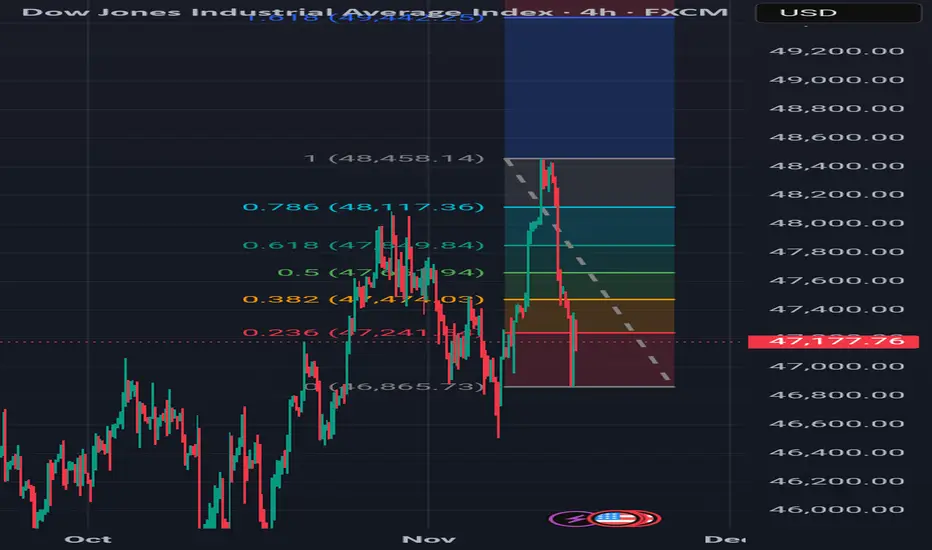
US30 4H CHART IN MOTION US30 4H | Smart Money Setup in Motion
Price retraced sharply from recent high into 0.236 Fib zone (47,324).
Expecting inducement sweep into 0.5/0.618 zone (47,899–48,134) before reversal or deeper liquidity grab.
If price sweeps 0.618 and leaves bullish PA (engulfing, FVG, BOS), that’s my POI for tactical long.
Break below 46,924 invalidates setup.
Bias: Bullish if sweep + confirmation. Bearish if rejection holds at 0.236.
Trade what you see, not what you feel.
Follow for daily setups → @mishlova
Would you take this long? Let’s talk setups
NeoSetups #SmartMoney #US30 #LiquiditySweep #Fibonacci #TradingViewIdeas
US30 overall bullishOn the 4HR, US30 was in an uptrend, made a high, higher low, higher high, HL, HH, then equal lows, then we broke a high, made a new high, pulled back and tapped into demand. We got bearish wick rejection candle to start going up but before that we also have 2 confluences for a sweep of liquidity at demand with a trendline and equal lows and we're getting bearish candles on the 2HR and every time frame to the 15 min to get that sweep before rising. I'm bearish first for the sweep and then bullish for overall uptrend move.
