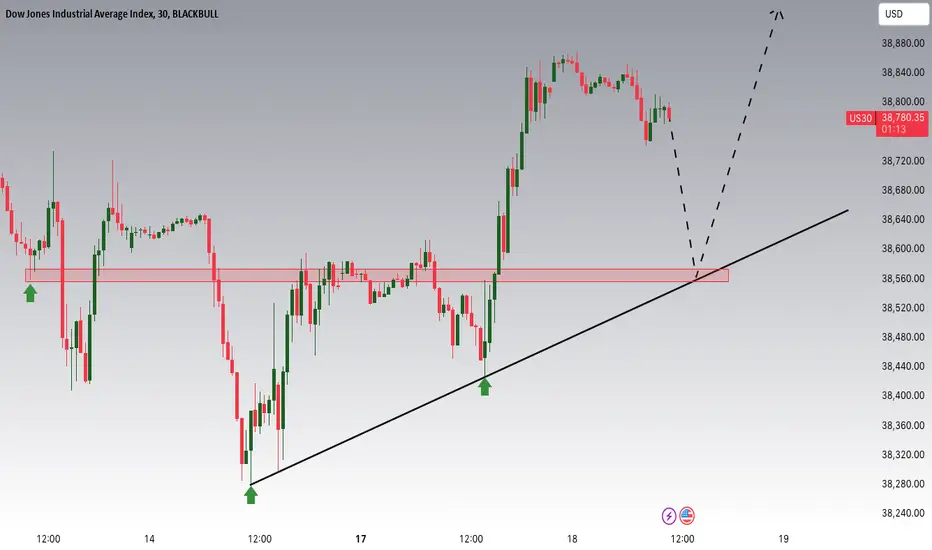
US30We looking for buying opportunities as we are still inside a bullish trendline and the market is still respecting the support zone
US30 trade ideas

Dow Jones is approaching an important support levelHey Traders, in today's trading session we are monitoring US30 for a buying opportunity around 38,600 zone, Dow Jones is trading in an uptrend and currently is in a correction phase in which it is approaching the trend at 38,600 support and resistance area.
Trade safe, Joe.
DOW JONES BearsPrice action from yesterday"s NY session saw a huge bull rush in the markets.
A break is oout from the up trend and looking to short towards the low.

CHART BREAKDOWN US30: Key Levels, Targets and Thoughts!Brief Description🖊️:
The chart provides insights into critical market levels, emphasizing an essential demand zone (low-risk buy zone) spanning from 38.160 to 38.100, respectively, is highlighted.
Things I Have Seen👀:
Important Demand Zone🟢: Identified between 38.160-18.100, serving as a low-risk buy.
Bullish Targets📈:
38.300: Possible retracement area.
38.550: Possible retracement area.
38.800: Possible retracement area.
39.030: Significant supply zone.
Ultimate Target: 39.130- Liquidity area.
What's Important Now❗
Currently, the crucial approach is to wait and observe the price action at this level. We need to assess how the market reacts before considering any decisive moves. Stay observant and responsive to real-time developments in the market.

US30 - Entry Zone Update!Following on from our previous analysis where we shared the higher timeframe analysis, we are now seeing a correction which we can capitalise on.
We are watching for price to move into our sell zone where we'll look for signs of reversals on lower timeframe. We are not anticipating price to create a new high so we can use 40.1k as invalidation levels for this scenario.
SHORT Trade Idea:
- watch for price to move into sell zone
- Once there, look for signs of reversal on lower timeframe. We'll be looking for an entry trendline
- Once entered, have stop loss above the correction
- Target the buy zone 37k
Our longer term setup will be the buy setup once we enter buy zone.
Goodluck and as always, trade safe!

US30 BUY ON BREAKOUTS!!!!!!!!!!!!US30 completed over 2000pips from our last analysis entry now we have a falling wedge and am expecting a breakouts with retracements for buys
Lets know your opinion on us30

US30 Bullish Trend with Key Support at 38,790Technical Analysis: US30
The price trend for US30 is currently bullish, targeting 39,050 as long as it remains above 38,790. There is also the possibility of a price correction down to 38,790.
Bullish Scenario:
As long as the price trades above 38,790, it will likely push up to 39,050.
Bearish Scenario:
If the price breaks below the support level at 38,790, it could decline to 38,580. Sustained trading below this level may result in a further drop to 38,400.
Key Levels:
- Pivot Line: 38,790
- Resistance Levels: 39050, 39350, 39700
- Support Levels: 38580, 38400, 38290
Today's Expected Range:
The price is expected to move between the support level at 38,790 and the resistance level at 39,050.
In summary, maintaining a position above 38,790 supports a bullish outlook with higher resistance targets, while trading below this level indicates potential bearish movement towards lower support zones.

US30To go down to 38000.00 at least. Head & Shoulder pattern on daily TF with right shoulder not yet completed.
Double top structure on weekly TM with price expecting to reach neckline.

US30: First red dayHi everyone and welcome to my channel, please don’t forget to support all my work subscribing and liking my post, and for any question leave me a comment, I will be more than happy to help you!
“Trade setups, not movements”
1. DAY OF THE WEEK (Failed Breakout, False Break, Range Expansion)
Monday DAY 1 Opening Range ✅ no daily cycle
Tuesday DAY 2 Initial Balance
Wednesday DAY 3 (reset DAY 1) Mid Point Week
Thursday DAY 2
Friday DAY 3 Closing Range
2. SIGNAL DAY
First Red Day ✅
First Green Day
3 Days Long Breakout
3 Days Short Breakout
Inside Day
3. WEEKLY TEMPLATE
Pump&Dump ✅
Dump&Pump
Frontside
Backside ✅
4. THESIS:
Long: secondary, the market could consolidated in Friday LOD, for a reversal trade during NYO or 10am. Not my best scenario of the day, but I would be willing to scalp it from LOD to CP (closing price).
Short: primary, first red day signal, false break high of the week, US30 has now a great potential to start the backside back into the previous LOW. However, the failed breakout hasn't been confirmed yet, no other time frames (daily levels) are involved.
I will be waiting for a level to be trigged, and then looking for a setup if presented.
Please note that the purpose of my analysis is to help me and you hunting the best trade setup for the day, none of my technical aspects are a way to forecast any directional market movement.
Gianni

CASH DJI wave C or 3 may have started today The chart posted is that of the DJI avg We have held once again support and the FEAR GREED has now printed a 38 So the put call is bearish as is the new /high/ new lows So why should the dow jones rally reason it stopped going DOWN I think we maybe forming a DIAGONAL

📈 Bearish Harmonics Pattern In The Making | DJI Peaked, Again!Hello my fellow traders and news people, I would like to show you this because it is a nice bit of information and can be quite revealing; it can help us connect many dots.
The DJI is poised to produce a correction based on normal cyclic market action.
Based on the classic fluctuations wee see of prices moving up and down, like the waves in the sea.
Today we can see the DJI hitting a new All-Time High, this is true.
An All-Time High only means the highest price ever but it doesn't really mean much more than that. For example, the DJI only grew a few points compared to March 2024 peak price, thus giving us a double top.
For hype, for political reasons; everywhere the new ATH is advertised and promoted. But for us, this is a bearish development. This isn't either good or bad just as money isn't good or bad, it depends on the use you give it.
Think of power; Power isn't good or evil, it depends how you use this power.
You can use your power to build, to help others, to share; just as you can use it to destroy. Good or bad depends on us.
The higher high hit today is part of what we call an irregular correction.
While inflation is "slowing down," a rise of X% is still a rise.
Inflation rises because the monetary supply expands.
Inflation means the currency is devaluating.
Since fiat money is always worth less, you can end up with a higher high (new ATH) rather than a lower high as the correction takes place.
If the fiat money value was the same or stronger, we would see a lower high now rather than a new All-Time High, but this changes nothing for traders.
For the reporters, knowing this can put you ahead of the game.
While yes, it moved up, it is part of a correction which means that soon it will go lower... Knowing this before hand you can also let your people know.
Here is the chart:
I see it moving lower based on the chart structure, market sentiment and chart signals but things can always change.
How you use this information is up to you... Know that...
...
...
I love you!
Just make sure to be happy, content in your heart with your lifestyle, with your choices, with the daily chores you have to do.
If you enjoy every minute of every day... This happiness of the Soul can translate into trading success.
We need happiness to welcome abundance.
We need a stable mind to trade.
Control your mind and achieve all of your goals.
Namaste.

US30 ( BULLISH ) (4H )US30
HELLO TRADERS
Tendency the price is a short pressure in 38,415
Turning level : The turning level in 38,415, so as long as the price trade above this level, there will be a bullish trend
resistance level : breaking turning level in 38,415 , the price will rise to 38,745 and 39,015 stable this level it will started a bullish trend
support level : trade stable under 38,415 , the price will reach the support level of 38,110
and 37,794
corrective level : price will attempt in 38,415 , correct itself before long
I HOPE YOU A PROFITABLE DAY

US30 - 15m Buy scalpThe Dow Jones Industrial Average (US30) is currently on an upward trajectory, showing strong bullish momentum on the 15-minute chart. As it continues to rise, it is approaching a key resistance zone that has previously served as a turning point. Traders should watch this level closely, as the price may test and react to this resistance, potentially leading to a breakout or a consolidation phase. This anticipated rise towards the resistance zone signals a pivotal moment for US30's short-term direction, providing opportunities for strategic entries and exits based on price action around this area.

CHART BREAKDOWN US30: Key Levels, Targets and Thoughts!Hey everyone,
I wanted to provide an update on the setup I previously posted. It's still valid and in play! We're currently in a waiting phase, anticipating the market to tap us in. The key levels we've discussed remain crucial, so please keep a close eye on them.
Patience is essential in trading, and it's all about waiting for the right moment. Stick to the setup, and let's see how this unfolds.
Happy trading, and stay focused!✅

Us30 is about to flyMultiple confluences indicate the probability of a bullish market ... please trade with caution and use risk management
Remember its not a sprint,its a marathon.

US30: First green day!Hi everyone and welcome to my channel, please don’t forget to support all my work subscribing and liking my post, and for any question leave me a comment, I will be more than happy to help you!
“Trade setups, not movements”
1. DAY OF THE WEEK (Failed Breakout, False Break, Range Expansion)
Monday DAY 1 Opening Range
Tuesday DAY 2 Initial Balance ✅ day 3 cycle
Wednesday DAY 3 (reset DAY 1) Mid Point Week
Thursday DAY 2
Friday DAY 3 Closing Range
2. SIGNAL DAY
First Red Day
First Green Day ✅
3 Days Long Breakout
3 Days Short Breakout
Inside Day
3. WEEKLY TEMPLATE
Pump&Dump
Dump&Pump ✅
Frontside
Backside ✅
4. THESIS:
Long: primary, failed breakout LOW, the market looks started the backside move, long are in the market, current HOW has been triggered and now dumped for 3 levels. After 9:30am if the market will stay down low I will be looking for a buy setup.
Short: secondary, not really interested today, unless the market pumps up into the current HOD/HOW and stays in consolidation till NY opening 9:30am
Please note that the purpose of my analysis is to help me and you hunting the best trade setup for the day, none of my technical aspects are a way to forecast any directional market movement.
Gianni

Fund Managers underweight US equitiesLowest level since 2005
The blue lines indicate the circle low points on the graphic
I found this useful
hope u do too,

us30 1h supply nested in daily DBD Market Outlook:
US30 is currently navigating between significant daily supply and demand zones, suggesting a pivotal market phase.
Key Levels:
Daily Supply Zone: Positioned above current price levels, indicating selling pressure and resistance.
Daily Demand Zone: Situated below current price levels, indicating potential buying interest and support.
Technical Setup:
Timeframe: 1-hour
Current Situation: The market is within the boundaries of the daily supply zone, indicating bearish sentiment and resistance.
Trade Opportunity:
Setup: A 1-hour timeframe shows a supply zone nested within the broader daily supply zone.
Analysis: The daily supply zone's dominance suggests potential downside momentum or resistance.
Entry Strategy: Consider short positions or monitoring for bearish signals within the 1-hour supply zone, aligning with the broader daily sentiment.

US30 Long BiasHello traders!
Hope you are all well.
I have my eyes set on this long position on the Dow. As you can see there are 2 solid demand zones.
3 options we have here:
1 - Combine both demand zones and increase risk on the position accordingly.
2 - Take the first trade from the higher zone, and if it breaks, buy the bottom demand zone.
3 - risk missing the first trade and wait for the bottom demand zone.
I will personally go with option number 2.
A new all time high is expected! Let's see! I am entering the trade the moment price hits the demand zone.
But, trade safe! ;)
Until next time!

US30 sell this is a clear break of structure to the downside before a big buy trade, pure technical analysis.

DOW JONES - BEARISH TREND.Dow Jones (us30) index has been consolidating for around 9 days and now it's showing a good pattern breakout for a down/bearish trend for at least 2 weeks will be trending all the way to 37339.1 LEVEL and it will start to consolidate for another trend or reversal.

US30 SELL NOW!!!!!!US30 got rejected multiple from the buyside forming a falling wedge pattern and was expecting a breakouts but price got rejected am in on another sell rally to the sell side
JOIN AND ENJOY
Tell us your expectations............

Us30 predictive move Us 30 is in an expanding pattern overall however there is an intrady bullish head and shoulders forming this can be taken on the rejection of the right shoulder with minimal risk since the trend is not clear h1 is looking bearish , however daily is bullish with a wick rejection yesterday ,weekly has a wick rejection last week showing again bullish rejection so the choice is yours I chooose to buy
