NASDAQ (US100) Analysis:The Nasdaq index showed a notable recovery yesterday but declined today toward the support zone at 24,475, which is a potential rebound area.
🔻 If 24,475 breaks and holds below, the price is likely to retest the lower support zone at 24,000, which remains the preferred scenario for now.
🔺 If a rebound occurs from the current support, the index may rise to test the resistance zone at 24,780, and a breakout above it would confirm a return to the bullish trend.
📉 Best Sell Zone: Below 24,470 (confirmation of breakdown)
📈 Best Buy Zones: Upon confirmation of rebound from 24,480 or 24,000
Trade ideas
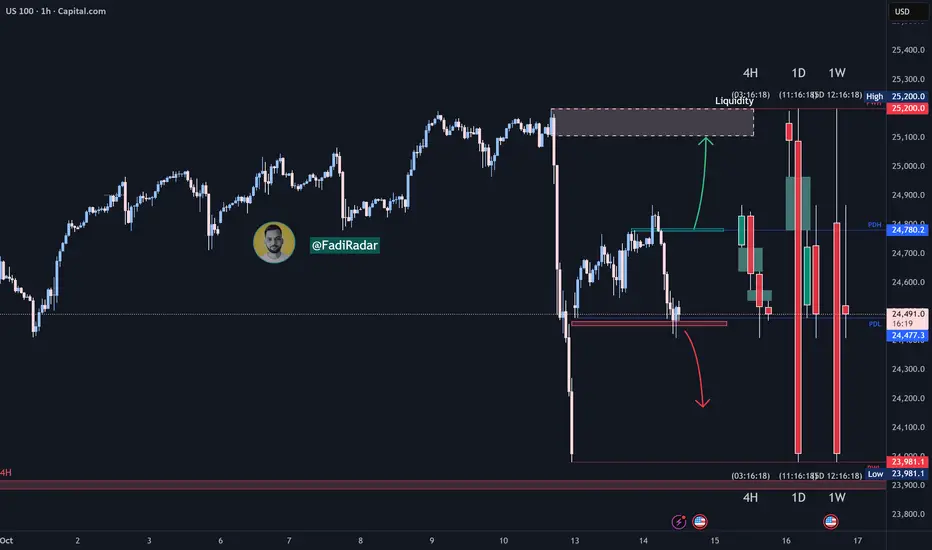
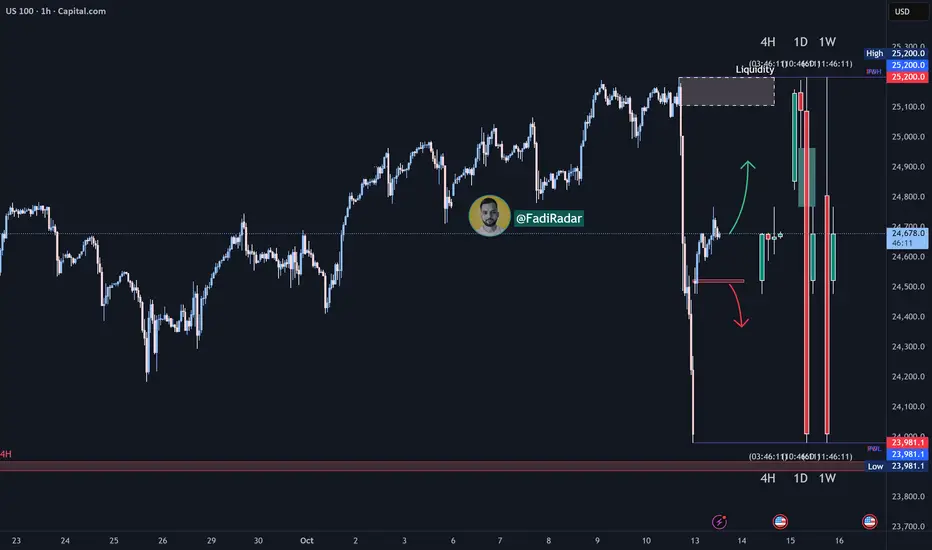
NAS100 Smart Opportunity (think like the 1%)This is a nice opportunity if you can see whats its going to happen!
LONG and then SHORT!
In order to sell this thing , we need buyers dont we ?

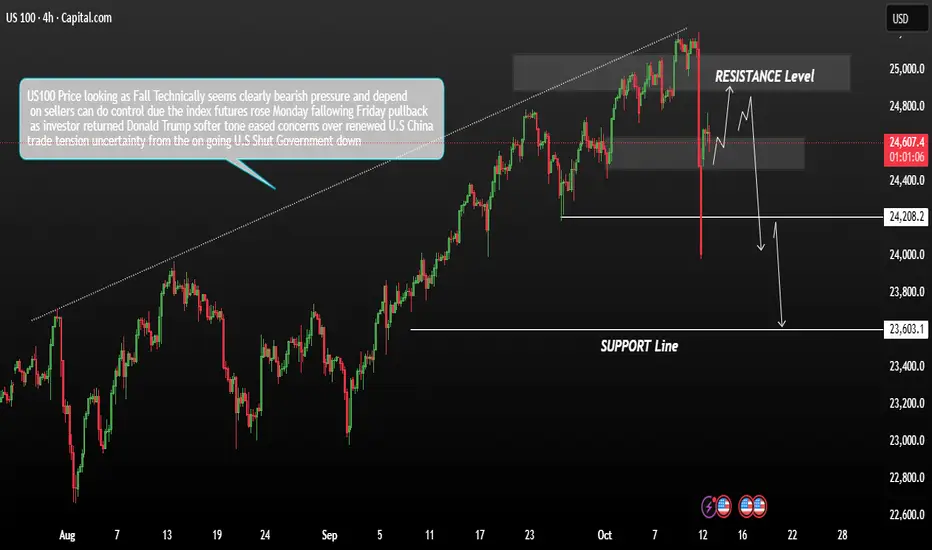
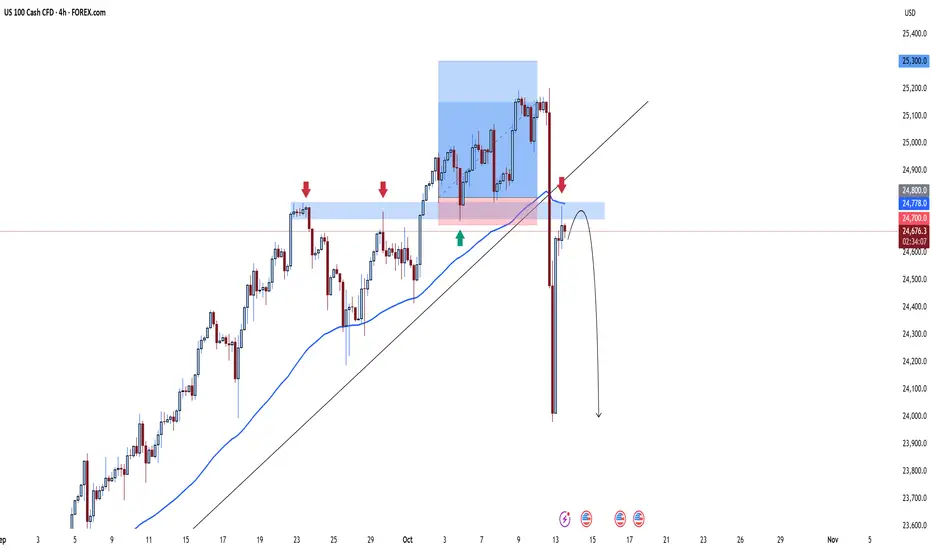
US100 currently showing signs of persistent bearish pressureThe US100 index is currently showing signs of persistent bearish pressure. Following Friday’s pullback, futures rose slightly on Monday as investors reacted to a softer tone from Donald Trump, which eased some concerns over renewed U.S.–China trade tensions. However, broader market uncertainty remains elevated due to the ongoing U.S. government shutdown and cautious sentiment in equities.
From a technical perspective, the US100 is maintaining a bearish trend structure. If price action fails to sustain above current levels and instead tests the resistance zone before reversing, it could confirm continued weakness. If sellers regain control near resistance, we may expect potential downside targets around 24,200 and also 23,600m Momentum remains on the downside as long as price stays below the resistance threshold, suggesting sellers are still dominating the short-term outlook.
You may find more details in the chart.
Trade wisely best of Luck.
Ps; Support with like and comments for better analysis Thanks for Suipporitng.
NAS100 Do we sell off today? In my opinion if we sell of we just look for short to fair value gap bullish. This is not a signal to calling any trade. I'm just sharing my own analysis. FX:NAS100

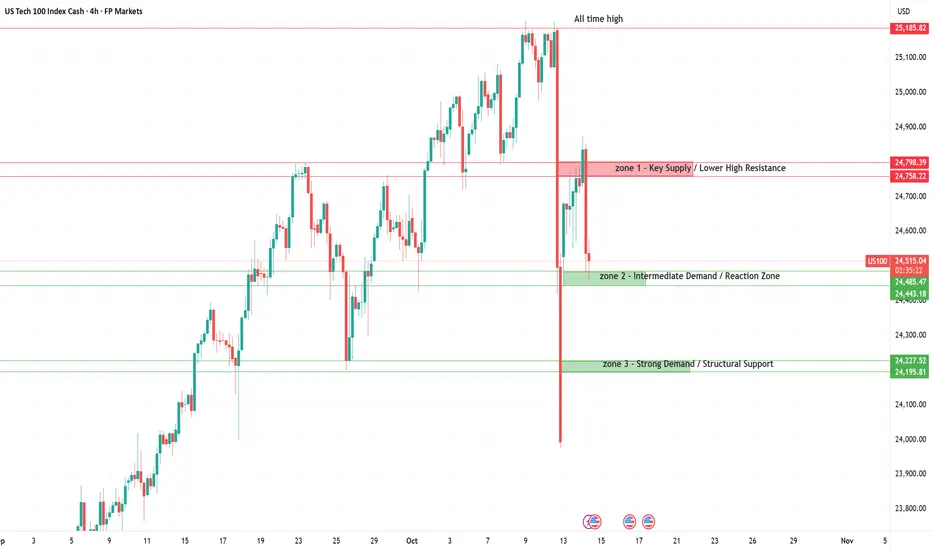
US100 - Cautious Optimism Returns?US100 – 4H Technical Zone Analysis
Zone 1: Key Supply / Lower High Resistance
This is the first meaningful resistance zone below the all-time high. The sharp selloff originated here, making it a tactical “sell zone” on retests. If bulls manage to reclaim and hold above it, it would signal regained momentum and open the door for a reattempt at the highs. Otherwise, repeated rejections here could confirm a developing lower-high structure — a sign of weakening bullish control.
Zone 2: Intermediate Demand / Reaction Zone
This zone has shown reactive buying interest and currently acts as short-term support. It’s where price paused after the last major drop, showing the presence of responsive buyers. Holding above this zone keeps the intraday bias neutral-to-bullish, but a decisive break below would expose the next, stronger demand layer.
Zone 3: Strong Demand / Structural Support
This is the critical demand base for the current structure. Buyers have previously stepped in aggressively here, making it a key defense area for maintaining the broader bullish trend. A clean breakdown below would mark a shift in market structure toward a deeper correction phase.
US100 sentiment as of October 14, 2025
After a volatile start to the week, sentiment around the US100 has turned cautiously optimistic. The tone improved sharply yesterday after President Trump softened his rhetoric toward China, easing fears of an escalating trade war. Markets responded positively, with tech and AI-related stocks leading the rebound, particularly semiconductor and infrastructure names, which had been under pressure from tariff headlines earlier in the week.
The shift restored some risk appetite, but traders remain aware of how fragile the backdrop still is. The government shutdown continues to limit access to key U.S. economic data, leaving investors to trade largely on headlines, corporate news, and policy expectations. Meanwhile, valuations remain stretched, and any renewed trade tension or hawkish commentary from the Fed could quickly reverse the current optimism.
Overall, the US100 is holding a bullish bias, supported by AI momentum and relief over trade tensions, yet sentiment is still built on a fragile foundation, driven more by narrative and liquidity than by solid macro data.
IF THEN SCENARIO BASED OFF 13 OCTOBER ANALYSIS14 OCTOBER 2025: US100
NEUTRAL STANCE AT THIS POINT:
Will observe price action to maximize returns across the London and New York trading Sessions.
DISCLAIMER:
The owner of this page is an authorised Representative under supervision of TD MARKETS (PTY) LTD, an authorised Financial Services Provider (FSP No. 49128) licensed by the Financial Sector Conduct Authority (FSCA) under the Financial Advisory and Intermediary Services Act (FAIS).
The FSP is licensed to provide advice and intermediary services in respect of Category I financial products, including but not limited to derivative instruments, long-term deposits, and short-term deposits.
All investment ideas are provided in accordance with the scope of the FSP's license and applicable regulatory requirements. Derivative instruments is a leveraged products that carry high risks and could result in losing all of your capital, and past performance is not indicative of future results.
This idea and any attachments are informational/education and does not constitute advice.
No guarantee is made regarding the accuracy or outcome of this trade idea.
If you choose to accept this idea, please do so at your own risk.
us100 looking weak us100 looking weak, expecting bearish rally towards descending trend line, and if it could not hold trend line, then we may see deeper correction in us100

NASDAQ NAS100 Trade Plan: VWAP & Volume Profile StrategyI’m currently watching the NASDAQ #100 (#NDX) 📊. After a strong correction due to geopolitical turmoil 🌍, the market rebounded just as aggressively. Right now, price is trading above VWAP 📈. If it stays above VWAP, I’ll be looking for a long opportunity.
In the video, we zoom into a 30-minute timeframe ⏱️, using VWAP and Volume Profile to plan the trade. If price respects these levels, we can take a long. If it falls below the support level ❌, we abandon this idea.
⚠️ Disclaimer: This is for educational purposes only and not financial advice.


Nasdaq - Clearly heading to $30.000!🎉Nasdaq ( TVC:NDQ ) points much higher:
🔎Analysis summary:
Yes, we witnessed a short term correction over the past couple of days. But no, this does not mean that the bullrun is now entirely over. In fact, looking at the longer term rising channel pattern, the Nasdaq can still rally higher until it will retest the upper trendline.
📝Levels to watch:
$25.000, $30.000
SwingTraderPhil
SwingTrading.Simplified. | Investing.Simplified. | #LONGTERMVISION

Nas100 Trade Set Up Oct 13 2025Price is still in a strong downtrend from last week. We got a 4h bearish FVG and a 1h gap that need to be filled. I will wait to see which one gets filled first to target the other one

US NAS 100Preferably suitable for scalping and accurate as long as you watch carefully the price action with the drawn areas.
With your likes and comments, you give me enough energy to provide the best analysis on an ongoing basis.
And if you needed any analysis that was not on the page, you can ask me with a comment or a personal message.
Enjoy Trading ;)

NASDAQ Did the 1D MA50 just save the day??Nasdaq (NDX) suffered a historically strong daily sell-off on Friday following President Trump's tariff threats and touched (and closed on) its 1D MA50 (blue trend-line).
Last time it hit that trend-line was on September 02 and that was a technical Higher Low on the 5-month Channel Up. Friday's Low was also very close to the bottom of this pattern. At the same time the 1D RSI hit and rebounded on its Lower Lows Support trend-line.
With the market rebounding and opening considerably higher today, it is more likely technically that we have started the pattern's new Bullish Leg. With the last two such sequences rising by at least +11.00%, we expect a new similar uptrend, which as long as the 1D MA50 holds, could hit at least 26000 within a 40 day horizon.
-------------------------------------------------------------------------------
** Please LIKE 👍, FOLLOW ✅, SHARE 🙌 and COMMENT ✍ if you enjoy this idea! Also share your ideas and charts in the comments section below! This is best way to keep it relevant, support us, keep the content here free and allow the idea to reach as many people as possible. **
-------------------------------------------------------------------------------
💸💸💸💸💸💸
👇 👇 👇 👇 👇 👇

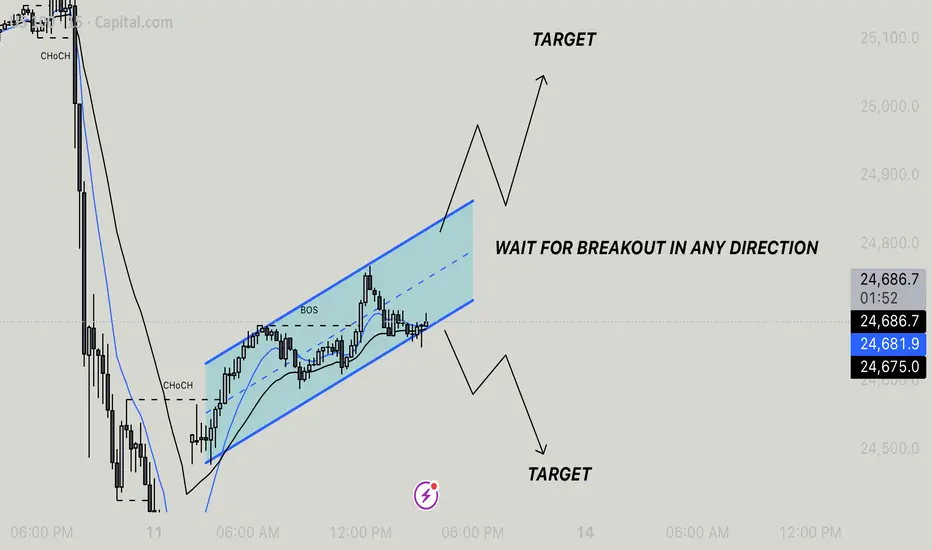
Us100 - Breakout Setup In PlayThe market has formed a rising channel after a significant bullish reversal marked by a Change of Character (CHoCH) and a Break of Structure (BOS). Price is currently consolidating near the midline of the ascending channel.
🔍 Key Insight:
We're in a wait-and-watch zone — a breakout from this channel in either direction could set the tone for the next move.
Trading Plan:
Upside Breakout: Watch for a breakout above the upper boundary of the channel with strong bullish momentum. Target the projected move equal to the height of the channel.
Downside Breakout: If price breaks below the lower channel support, expect a potential bearish move toward the lower target zone marked on the chart.
Important: Wait for a clear breakout and confirmation before entering a trade. Avoid entering inside the channel to minimize risk from false moves.
NAS100 4HThe price is currently in a pullback zone near the trendline and a key resistance area; therefore, the possibility of a correction or another decline cannot be ruled out.
NASDAQ Index Analysis:📉 U.S. indices witnessed a sharp decline on Friday’s session, with the NASDAQ being one of the most affected, closing at 23,980.
📈 As Monday’s session opened, the market started with a strong bullish gap (Gap Up) at 24,480, then continued to move upward — a trend likely to persist in the coming hours.
🔹 Expected Scenario:
As long as the price remains above the 24,500 support zone, the likely movement is toward the 25,100 resistance level for a potential retest.
🔸 However, if 24,500 support is broken and closed below, we could see a deeper correction before the uptrend resumes.
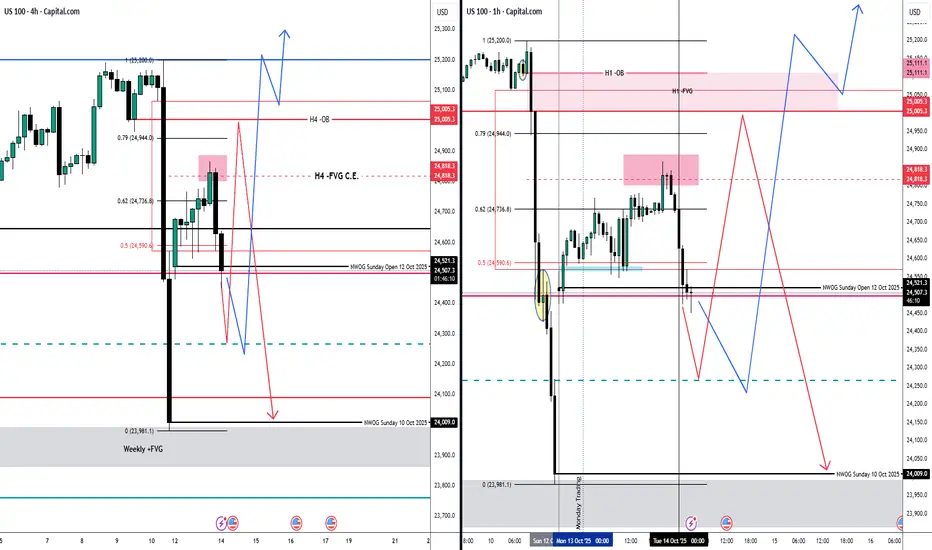
BEARISH TRADE IDEA - IF THEN ANALYSISMONDAY: 13 OCTOBER 2025
PRE-NY ANALYSIS:
BEARISH INTRA-DAY IDEA FRAMED ON H1 AND REFINED ON M15:
- Market currently in a Premium and just caressed the OTE (62%) of the Fib.
- Price also currently above the True-Day Open.
- Would like to see price trade lower into the Discount of the range (below the True-Day Open) before trading higher into the overlapping H1/M15 -FVG before trading softer, as per scenario 1.
- Otherwise, we look to scenario 2.
DISCLAIMER:
The owner of this page is an authorised Representative under supervision of TD MARKETS (PTY) LTD, an authorised Financial Services Provider (FSP No. 49128) licensed by the Financial Sector Conduct Authority (FSCA) under the Financial Advisory and Intermediary Services Act (FAIS).
The FSP is licensed to provide advice and intermediary services in respect of Category I financial products, including but not limited to derivative instruments, long-term deposits, and short-term deposits.
All investment ideas are provided in accordance with the scope of the FSP's license and applicable regulatory requirements. Derivative instruments is a leveraged products that carry high risks and could result in losing all of your capital, and past performance is not indicative of future results.
This idea and any attachments are informational/education and does not constitute advice.
No guarantee is made regarding the accuracy or outcome of this trade idea.
If you choose to accept this idea, please do so at your own risk.

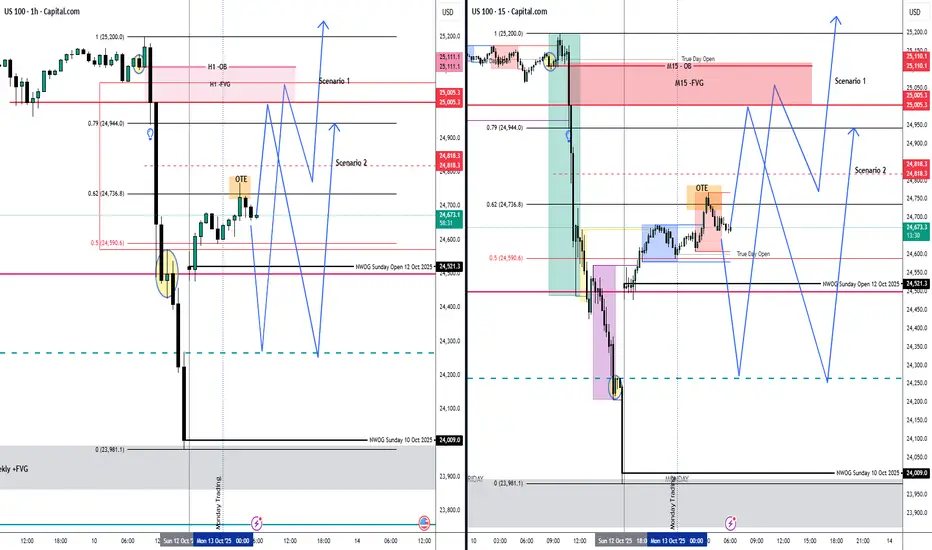
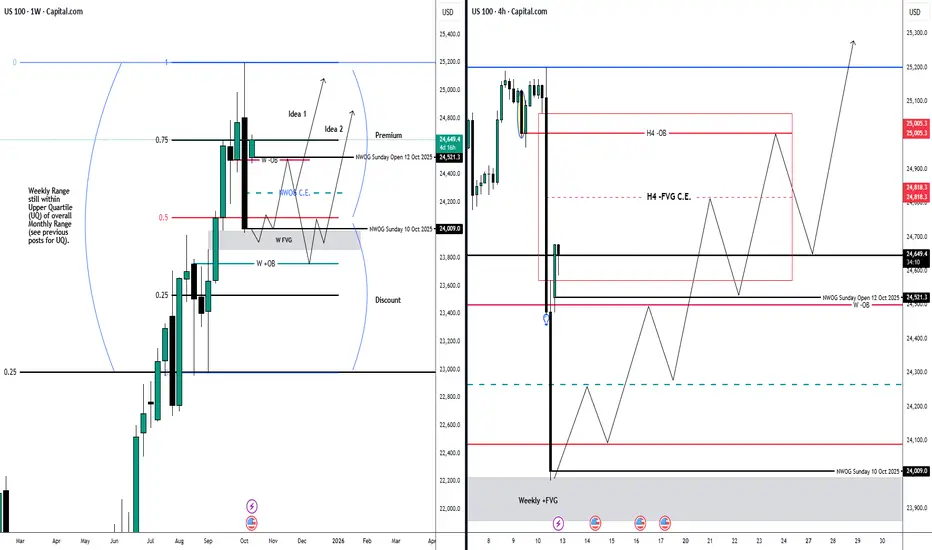
BULLISH TRADE IDEAS - IF THEN ANALYSISMONDAY: 13 OCTOBER 2025
PRE-NY ANALYSIS:
BULLISH INTRA-DAY IDEA FRAMED ON H1 AND REFINED ON M15:
- Market currently in a Premium and just caressed the OTE (62%) of the Fib
- Price also currently below the True-Day Open.
- Would like to see price trade lower into the Discount of the range before trading higher as per scenario 1.
- Otherwise, we look to scenario 2.
DISCLAIMER:
The owner of this page is an authorised Representative under supervision of TD MARKETS (PTY) LTD, an authorised Financial Services Provider (FSP No. 49128) licensed by the Financial Sector Conduct Authority (FSCA) under the Financial Advisory and Intermediary Services Act (FAIS).
The FSP is licensed to provide advice and intermediary services in respect of Category I financial products, including but not limited to derivative instruments, long-term deposits, and short-term deposits.
All investment ideas are provided in accordance with the scope of the FSP's license and applicable regulatory requirements. Derivative instruments is a leveraged products that carry high risks and could result in losing all of your capital, and past performance is not indicative of future results.
This idea and any attachments are informational/education and does not constitute advice.
No guarantee is made regarding the accuracy or outcome of this trade idea.
If you choose to accept this idea, please do so at your own risk.
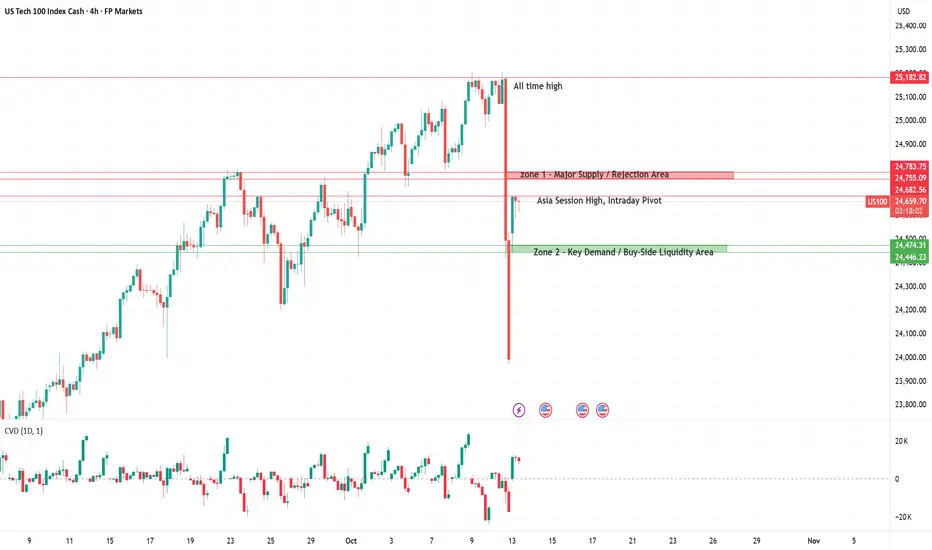
Nas100 - Pulls Back from Record Levels, Testing Critical SupportZone 1: Major Supply / Rejection Area
This zone aligns with the upper consolidation structure from which the last impulsive sell-off originated. Sellers have shown clear presence here, making it a strong supply pocket. As long as price remains below, it acts as a tactical short zone or at least a reaction point where momentum may fade. A sustained break and acceptance above would neutralize the selling pressure and open the door for a retest of the highs.
Asia Session High: Intraday Pivot
This intraday level marks short-term liquidity and offers a reference point for session-based structure. If price holds below it, short-term bias stays bearish toward the lower demand zone; reclaiming it intraday could trigger a squeeze back into Zone 1.
Zone 2: Key Demand / Buy-Side Liquidity Area
This zone has repeatedly acted as a strong buy-side absorption region. It represents the base of the prior impulse move, where aggressive buyers stepped in to defend structure. A clean hold here could produce a sharp rebound, while a decisive break below would confirm a shift in market control toward sellers and potentially start a deeper correction cycle.
Sentiment
The Nas100 remains near record highs, with sentiment best described as bullish but cautious. The market is still being driven by expectations of upcoming Fed rate cuts, falling bond yields, and strong momentum in AI and large-cap tech stocks. Despite a weaker macro backdrop, investors continue to treat the tech sector as a structural growth play and a safe haven in an uncertain environment.
However, the tone is far from euphoric. The ongoing U.S. government shutdown has created a “data blackout,” leaving traders without key economic releases such as CPI or employment figures. This has made the market more headline-driven and prone to volatility. At the same time, renewed U.S.–China trade tensions and rising warnings about overvaluation are keeping risk awareness high.
Overall, sentiment on US100 remains positive, supported by liquidity and tech optimism, but the rally rests on fragile ground - driven more by policy expectations and momentum than by clear fundamental strength.
How to find algorithmic levels of support and resistanceUsing repeating pinpoint levels to form meaning of opens and closes around these levels give you an advantage in your analysis.
As price gives us clues to what levels are affecting price, we should mark the new candles that are responding to these levels by breaking and retesting these very levels.
Please let me know your thoughts! 🙏🏾

H4 INTRA-DAY IDEAIntra-Day Buy Model Idea
DISCLAIMER:
The owner of this page is an authorised Representative under supervision of TD MARKETS (PTY) LTD, an authorised Financial Services Provider (FSP No. 49128) licensed by the Financial Sector Conduct Authority (FSCA) under the Financial Advisory and Intermediary Services Act (FAIS).
The FSP is licensed to provide advice and intermediary services in respect of Category I financial products, including but not limited to derivative instruments, long-term deposits, and short-term deposits.
All investment ideas are provided in accordance with the scope of the FSP's license and applicable regulatory requirements. Derivative instruments is a leveraged products that carry high risks and could result in losing all of your capital, and past performance is not indicative of future results.
This idea and any attachments are informational/education and does not constitute advice.
No guarantee is made regarding the accuracy or outcome of this trade idea.
If you choose to accept this idea, please do so at your own risk.
Us100I previously shared an analysis where I gave a buy entry and then sold it. While it didn't occur under the conditions I anticipated, the sell-off did occur. Now, in this analysis, I project that wave 4 has already ended, so the start of wave 5-5-of-3 appears as a major pattern.

US100: SCENARIO 3 IF PREVIOUS 2 IDEAS FAILBearish Market Structure Shift (-MSS) is imminent if Price Action follows what I have denoted in this trade idea.
DISCLAIMER:
The owner of this page is an authorised Representative under supervision of TD MARKETS (PTY) LTD, an authorised Financial Services Provider (FSP No. 49128) licensed by the Financial Sector Conduct Authority (FSCA) under the Financial Advisory and Intermediary Services Act (FAIS).
The FSP is licensed to provide advice and intermediary services in respect of Category I financial products, including but not limited to derivative instruments, long-term deposits, and short-term deposits.
All investment ideas are provided in accordance with the scope of the FSP's license and applicable regulatory requirements. Derivative instruments is a leveraged products that carry high risks and could result in losing all of your capital, and past performance is not indicative of future results.
This idea and any attachments are informational/education and does not constitute advice.
No guarantee is made regarding the accuracy or outcome of this trade idea.
If you choose to accept this idea, please do so at your own risk.
