Nasdaq, idea for today and follow up from yesterdayI had analysed my Nasdaq entry yesterday, although it got activated, there wasn't much movement because it was a holiday. I've closed some profits now, watching to see what happens next
USTEC trade ideas

Nasdaq follow upHere is a follow up of my plan for Nasdaq in the London Session, feel free to ask me questions if you do not understand the reason for my decisions

Nasdaq thoughts for the dayThis video shows what I am looking at and my thoughts for today regarding Nasdaq

Nasdaq in potential area of interest for sell opportunity?Hi Guys,
As of this writing the US !00 is at a potential area where we may get opportunity for LTF sell setups with opportunity to buy into a dip thereafter. Price is currently at the 3.0 fib retracement of the two points that form the channel that Ive drawn. Within the channel the clear impulsive trend move which is more obvious on a weekly timeframe is A to B to C, which result in a 0.618 fib trend based extension at this current price level. Lastly the third fib level is a 2.0 retracement of the latest pullback/consolidation from 23/5 to 31/5, which is pretty much at this current price level. Often the breach of the upper channel line can lead to a pullback back within the channel and a strong move back out of it or a deeper correction. I think in this case if there is some form of pullback from this level it will be very minor and we will see a more forceful move back up.
The 4 hr RSI is showing divergence heading into this area.
In saying all this the chart has printed a 4 hr double bottom breakout so we may just smash through this level like so many others before and continue on our merry way up.
Will need to see a solid bearish pattern on 15 min or 1 hour to enter short around this level though and focus will be to add long position at any of the demand zones below.
Safe trading all

Nasdaq - Soon heading to $30.000?Hello Traders and Investors, today I will take a look at the Nasdaq .
--------
Explanation of my video analysis:
For more than a decade, the Nasdaq index has been trading in a rising channel formation with the last retest of the support trendline being back in the end of 2022. At the moment, Nasdaq is retesting the upper resistance trendline and if we actually see a breakout over the next 2 months, we might see a similar rally of +50% compared to the one which we saw back in 2020.
--------
Keep your long term vision,
Philip (BasicTrading)

USNAS100 ( ATTEMPT TO BEARESH ) ( 4H )USNAS100
HELLO TRADERS
Tendency the price is a short pressure in 19,700
Turning level : The turning level 19,700, so as long as the price above this level, there will be a new historical peaks
resistance level : braking turning level 19,700, the price will rise to 19,950 and 20,140
support level : trading above turning level 19,700 , the price will reach the support level of 19,400 and 19,110 , stable this level reach to 18,935
corrective level : price will 19,700 , correct itself before dropping
I HOPE YOU A PROFITABLE DAY

Nasdaq - We still have to be careful!TVC:NDQ is still retesting resistance after we just saw an expected rally of +75%.
More than a decade ago, the Nasdaq entered one of the most profitable and easy to trade patterns: a rising channel formation. In the beginning of 2023 the Nasdaq once again retested the lower support trendline in confluence with a retest of horizontal support and continued its bullrun from there. But currently resistance is ahead so we have to be quite careful and properly monitor price action on the smaller timeframes.
Levels to watch: $19.000, $16.000
Keep your long term vision,
Philip - BasicTrading

NAS100 IDEA LONG POSITION THE NEXT WEEKhow did you do the analysis on nas100 ?
1/ general trenline frame daily : 4 hrs & 1 hr : uptrend
2/ determinie consolidation frame 1 hr & zone support and resistance
3/ the fundamontal anlysis positive


CHART BREAKDOWN NASDAQ: Key Levels, Targets and Thoughts!Brief Description🖊️:
The chart provides insights into critical market levels, emphasizing an essential demand zone (low-risk buy zone) spanning from 19.700 to 19.670
Things I Have Seen👀:
Important Demand Zone🟢: Identified between 19.700 to 19.670, serving as a low-risk buy.
Bullish Targets📈:
19.730: Possible retracement area.
19.800: Possible retracement area.
19.900: Possible retracement area.
19.950: Possible retracement area.
Ultimate Target: 20.000- Liquidity area.
What's Important Now❗
Currently, the crucial approach is to wait and observe the price action at this level. We need to assess how the market reacts before considering any decisive moves. Stay observant and responsive to real-time developments in the market.

US100 - Short SignalUS100 H2
Here is the analysis for NASDAQ. Looking to short as close to that 20000 price as possible. We are trading at ATH price currently, so it's hard to gauge how high this instrument might trade.
Although, 20000 is a very significant price, we could expect a dump of a few 100 points at least before continuing upside if this is the case.

CHART BREAKDOWN NASDAQ: Key Levels, Targets and Thoughts!Hey everyone,
I wanted to provide an update on the setup I previously posted. It's still valid and in play! We're currently in a waiting phase, anticipating the market to tap us in. The key levels we've discussed remain crucial, so please keep a close eye on them.
Patience is essential in trading, and it's all about waiting for the right moment. Stick to the setup, and let's see how this unfolds.
Happy trading, and stay focused!✅

CHART BREAKDOWN NASDAQ: Key Levels, Targets and Thoughts!Brief Description🖊️:
The chart provides insights into critical market levels, emphasizing an essential demand zone (low-risk buy zone) spanning from 19.700 to 19.670
Things I Have Seen👀:
Important Demand Zone🟢: Identified between 19.700 to 19.670, serving as a low-risk buy.
Bullish Targets📈:
19.730: Possible retracement area.
19.800: Possible retracement area.
19.900: Possible retracement area.
19.950: Possible retracement area.
Ultimate Target: 20.000- Liquidity area.
What's Important Now❗
Currently, the crucial approach is to wait and observe the price action at this level. We need to assess how the market reacts before considering any decisive moves. Stay observant and responsive to real-time developments in the market.


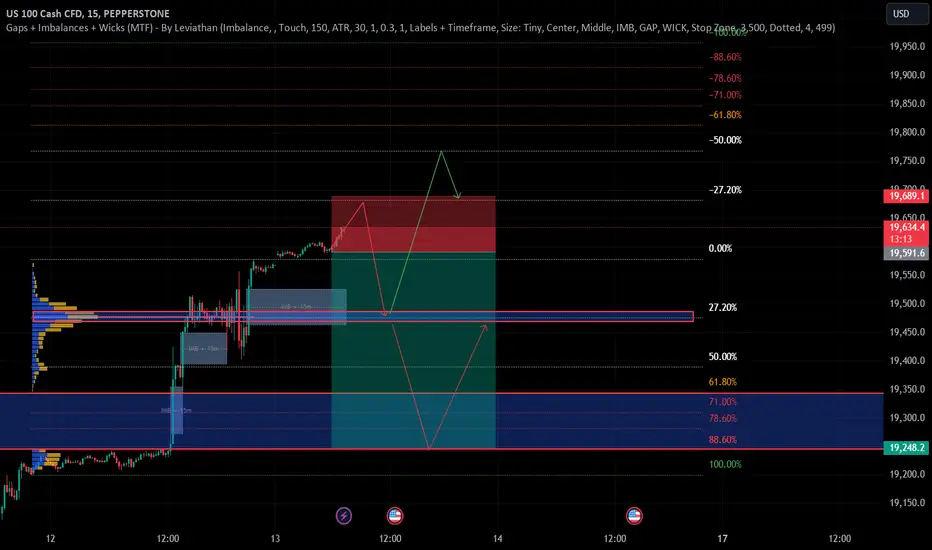
Retracement Idea (long term Bullish)Looks good for a short term retracement to fill imbalance Gap. still has room to go up but will take this trade. Please follow your own risk to reward taking profit at 1:1 risk to reward. Very crazy market at the moment and the Bulls are in control. Im personally not entering any long positions unless a good opportunity arises.
Good luck to everyone
717
Nasdaq Eyes New Highs Amid Bullish MomentumTechnical Analysis: USNAS100
The price has reached the resistance line at 19,100, indicating a sustained bullish trend. If the price stabilizes above 19,100, it is expected to continue its bullish movement towards 19,440. However, a retest down to 18,940 is likely before the bullish trend resumes. A break below 18,930 on a 4-hour candle close would signal a bearish shift towards 18,820, leading to consolidation between 19,100 and 18,940.
Bullish Scenario:
For the bullish trend to persist, the price needs to break above 19,100, with potential targets at 19,250 and 19,450. As long as the price trades above 18,930, the bullish trend remains intact.
Bearish Scenario:
Stabilization below 18,930 would indicate a move towards 18,820. A further break below 18,820, confirmed by a 1-hour candle close, would signal a downtrend towards 18,600.
Key Levels:
- Pivot Line: 19,100
- Resistance Levels: 19200, 19300, 19450
- Support Levels: 18940, 18820, 18710
Today's Expected Range:
The price is expected to move between the support at 18,820 and the resistance at 19,450.

NASDAQ is on the top, i'm selling it now!From Elliot Wave perspective it showed a possibility of the last push of wave 5.
I believe the correction will come very soon.
And if we took a look on the MACD, on daily chart showing a huge bearish divergence too!
It's a good confirmation that the uptrend is losing its power.
LET'S GO, BEAR!
#bearish #NASDAQ

#nazdaq #Nas100 #stock #marketAccording to the previous analysis, the NASDAQ index formed a range zone between 19,490 and 19,630. It has now broken the resistance at 19,630 and reached 19,700. However, this breakout appears to be a false break. I expect a price drop from this level. If the resistance at 19,700 is broken, the price could potentially rise to 20,000.

NASDAQ100 TO MAKE A PRICE REVERSAL DOWN TO THE 19126 price Technically, there's a visible evening star pattern that just formed on the 4HR chart which may have exhausted the momentum of the NAS100 to rise beyond its level. So with that being observed i will looking for corrective shorting opportunities as price unfolds new market structure in the following trading day and trading week or so...

NAS100 is Ready???The NAS100 index is experiencing a bullish trend, consistently adhering to its established trendline and reaching new highs. It has encountered resistance at the upper trendline multiple times, suggesting another rejection at this level is likely.
Do not over risk. Stay consistent. TP and SL are marked. Follow risk management.

NAS100 Weekly Analysis 6/186/18 NAS100 Weekly Anaylsis:
If price breaks the 1H trendline, look for sells down to next zone at 19687.5. If price breaks below that zone/breaks 4H trendline to the downside, look for sells lower to @19609.38 @19531.25.
If price fails to break trendlines or breaks above a previous high, then price could continue to move to the upside.
Opinion: This analysis is for education purposes only and is just my opinion, this is not a trade idea.

NASDAQ BUY NOWHi traders we have NASDAQ buy trade. take trades now will send updates shortly. as it is moving already.

NASDAQNasdaq analysis
Weekly and daily time frame
The price can return to the midline of the daily trading range and move towards the weekly resistance from there.
