NAS 100: Price Surge Potential After Break and RetestHi everyone, Kilian here!
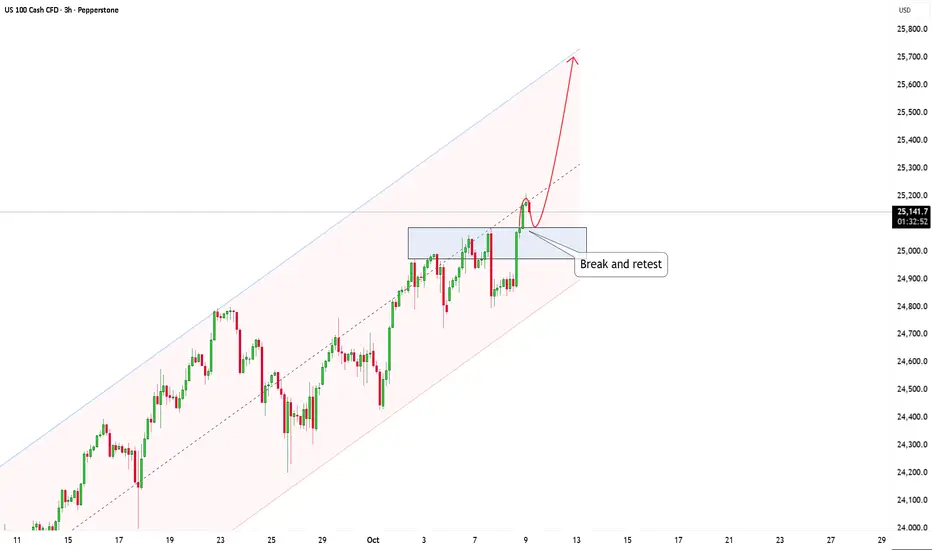
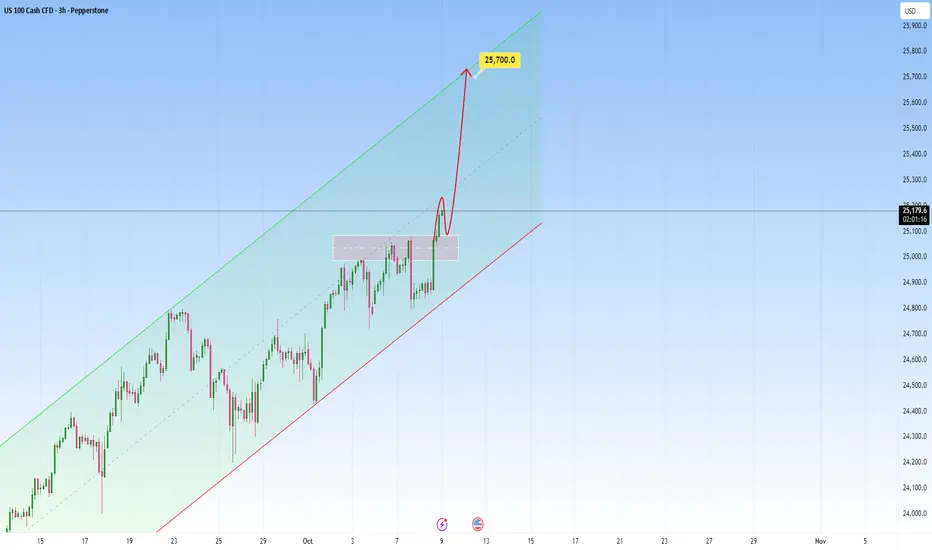
Let's take a closer look at the NAS 100 on a 3-hour timeframe, as it’s currently showing some interesting movements. The price has been steadily moving within an ascending channel, with the buyers continuing to dominate and push the price higher.
What’s particularly interesting right now is the breakout level. As the price approaches this level, we’ll be watching closely to see if the buyers can maintain control. A break and retest scenario could unfold here. If the price breaks through this level and then comes back to retest it (testing the broken level as support), and the buyers manage to hold it, this would be a strong confirmation that the buyers are still in control, and we could see price continuing to move towards the upper boundary of the channel.
However, if the price drops back below this level after the breakout, this could signal a false breakout, which may lead to a short-term correction as the sellers take control.
Currently, the momentum is still in favor of the buyers, and as long as the price holds above the breakout level, the bullish structure remains intact.
What do you think? Feel free to share your thoughts in the comments!
And remember, discussions within the TradingView community are a great way for all of us to improve our trading skills and grow together.
Trade ideas
Nas100 money4/1 h range on the left. We had a push down to sweep buyers and a new leg to the upside that broke highs and created the range. Waited for price to retrace sub 702 fib to sweep liquidity, mitigate the last time sellers were in control (last down candle). Once we see that we can then expect that price can continue in its desired direction. 15 min tf gave us clear break to that direction taking profit at the creation of sellers (top of higher tf range). Clean cut same thing over and over. I hope someone can learn from the simplicity of this idea.


short naslookign for this later, if nas opens, dumps, 1m, has some wick at the top, looking to enter this trade. break down first then back up for the wick.

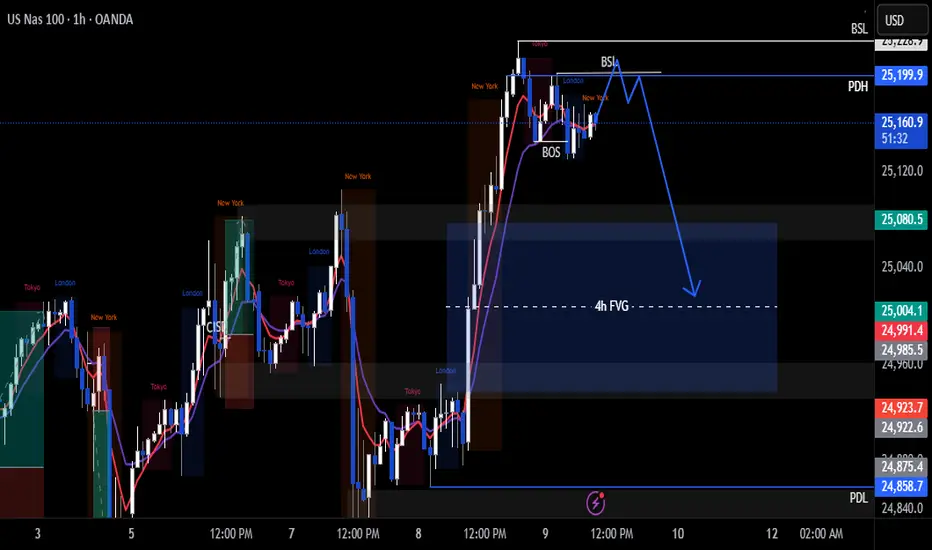
Nas100 Trade Set Up Oct 9 2025Price is currently making LH and broke structure so i want to see a sweep of BSL followed by a 1m IFVG/CISD to target 50% of the 4h FVG
www.tradingview.com
Bearish Outlook on NQ📉 Bearish Outlook on NQ
After completing the manipulation phase, NQ has tapped perfectly into the Bearish FVG (1H) zone around 25,366.45 – 25,392.25, sweeping both SSLs in the process. This confirms premium-level distribution, suggesting the market is ready for a downside move.
Scenario 1 – Primary (Bearish Bias):
Price rejects from the Bearish FVG 1H, fails to reclaim 25,366.45, and begins its descent. Liquidity below the BSL at 25,293.65 becomes the first target, followed by a clean run toward 25,264.95, completing a liquidity sweep below recent lows.
Scenario 2 – Rejection & Re-Test:
A short-term push above 25,330.55 (NAS100FT) to re-test the Bearish FVG 1H could offer another entry opportunity before the drop resumes toward 25,293.65 and 25,264.95.
Scenario 3 – Deep Liquidity Grab Before Reversal:
Should price tap deeper into the Bullish FVG 4H, we could see a final liquidity sweep below 25,264.95 before a stronger bullish reaction emerges.
🎯 Overall Bias:
Bearish — targeting liquidity below 25,293.65 and 25,264.95. Manipulation phase complete, distribution underway.
Follow and like for more.
Greetings,
MrYounity

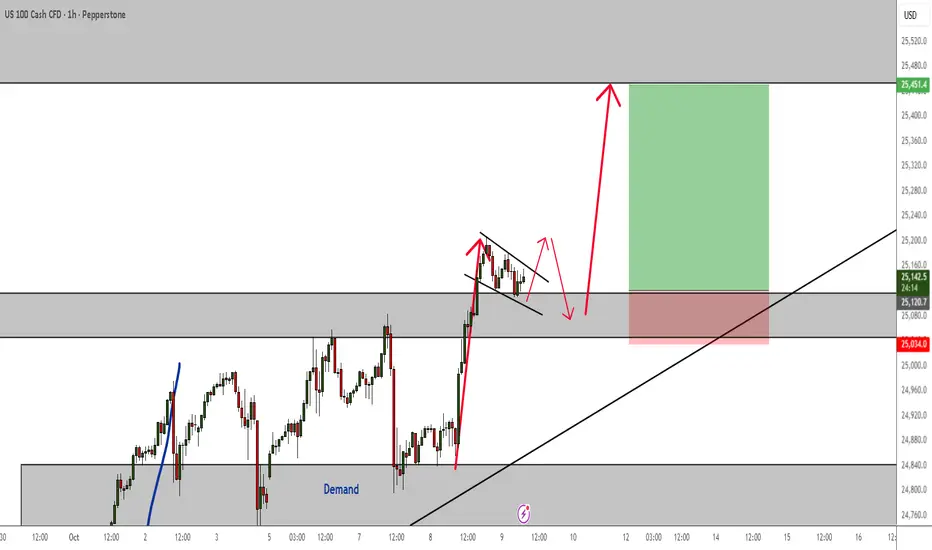
NASDAQ Bullish Continuation PatternsNAS100 is still pushing to the upside.
Currently on the H1 TF I am spotting a bullish flag. Confirmation to enter is on a breakout and a retest. Now, the thing about indices is that they love a nice false breakout, so expect the unexpected. Hence, the arrow points to the downside after the breakout and possibly retesting a support zone before we get a final bullish momentum.
Patience will pay you in this market.
The trend is still your friend.
Nasdaq longLondon has swept asia lows.
And it looks like it is going to manipulate them and reverse to the upside.
Longs looking good.

US100 MARKET OUTLOOK!US100 is looking structurally bullish but recently , I saw that it’s beginning to reject the current market price. Therefore I anticipate a slight correction to occur before the bullish trend can continue. I’m counter trending the pair

USNAS100 Extends Gains on AI Strength & Fed Cut Hopes?USNAS100 – Overview
Wall Street futures rose on Monday, extending last week’s rally as AI-related optimism and softer labor market data boosted expectations for a Fed rate cut later this year. The upbeat sentiment continues to support risk assets, though volatility remains sensitive to policy headlines.
Technical Outlook
The index has stabilized in a bullish zone, maintaining upward pressure above 24,900, with potential to extend toward 25,175, especially if it breaks 25,040.
To confirm a bearish reversal, the price must close a 4H candle below 24,810, which would expose downside targets near 24,580.
Pivot: 25,040
Resistance: 25,175 – 25,390
Support: 24,810 – 24,590 – 24,450
AI Bubble Burst in NasdaqChart is on logarithmic scale
Bet on price to correct back to the low of the shown logarithmic scale channel.
about 40-50% drop from an ATH at this price. (chance also that ATH can be established at the peak of the channel at 30,000$)
Bank of England and IMF started warning of an AI bubble crash similar to the dot-com bubble crash.

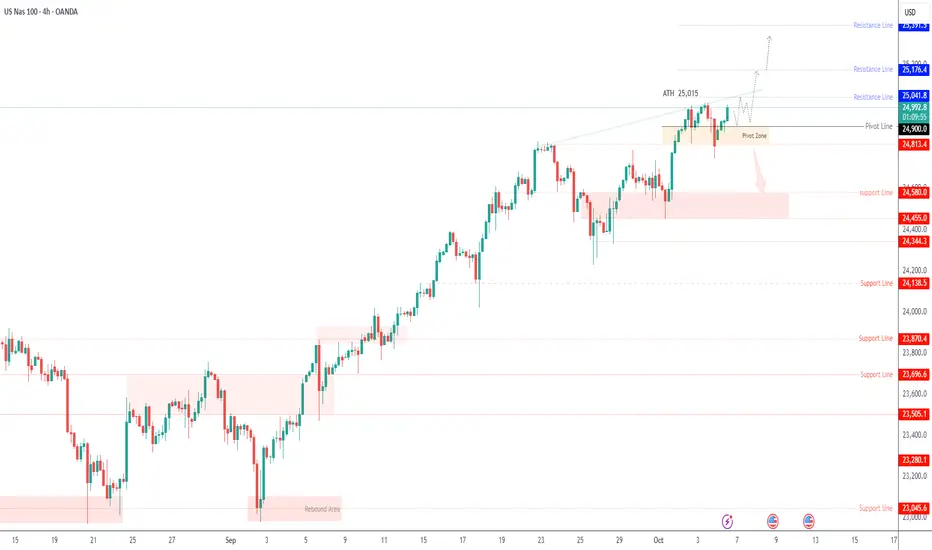
NASDAQ (US100) Analysis:✴️ Overall Trend: Bullish
The NASDAQ index showed strong performance yesterday, reaching 25,190, marking a new all-time high.
A price correction toward the Fibonacci golden zone at 25,000 is expected. If this level is broken, the price may move down to the liquidity zone near 24,820.
📌 Best Buy Zones: Watch for a rebound from 25,000 or 24,820
📍 Best Sell Zone: Upon breaking 25,100
⚠️ Disclaimer:
This analysis is not financial advice. It is recommended to monitor the markets and carefully analyze the data before making any investment decisions.

Nas100 sellsNasdaq is going to sell in the near term, because the price is making continuous lower lowers and it is going to take a very liquidity above and then continue the sell

NasdaqLit it that whole hour from the last post…..
Yum 🤤
Rolling stops, nothings going in the bin this time lol…
💵 💣
Lasssgooo!!!!

NAS shortsNasdaq attempts…
She looking for $25,012.
I’m allow $25,250 here, tag it all up….
Surely!!!
We take L here in leave her alone for a bit lmaooo
LFG light it up 🔥
Allow the next hour…

SILVER BULLET-CENTRAL STANDARD TIMESunday Open around 24,813 level..Market traded back into Sunday's open on 10/7/25 created a Silver bullet @ 1PM CST(2pm NYC)..began to trade to the upside 10/8/25..1:4-1:5 RR

NAS100 can continue higher inside the channelPrice has been moving steadily inside an ascending channel, with buyers maintaining control and pushing higher.
If buyers manage to defend this breakout zone on a retest, it would confirm their control and follow continuation toward the channel’s upper boundary. However, if sellers step in and force a drop back below, that could hint at a false breakout and short-term pullback.
For now, momentum favors the buyers, as long as price holds above the breakout area, the bullish structure remains intact.
Can NASDAQ Hold 24,600 and Push to New Highs?Hey Traders, in tomorrow’s trading session we are monitoring NAS100 for a potential buying opportunity around the 24,600 zone. NASDAQ remains in an uptrend and is currently in a correction phase, with price approaching a key support/resistance level at 24,600.
Structure: The broader trend is bullish, with price moving within an ascending channel.
Key level in focus: 24,600 — a critical support area aligning with the lower boundary of the channel.
Next move: Holding above this level could set the stage for a rebound toward 25,100, which represents the channel’s upper resistance and potential higher high formation.
Trade safe,
Joe.

USNASDAQ100 Correction will Trigger growth at 25,000The US100 (NASDAQ) edged slightly higher on Tuesday, with the benchmark index hitting a fresh intraday high. Investors remained cautious, awaiting comments from a series of Federal Reserve speakers for further clarity on the future direction of monetary policy.
Technically, a false breakout below support could signal continued upward momentum. If the index retests that support level and holds, weaker selling pressure may fade, paving the way for a move higher toward the next resistance levels and there target will 25,100.
You may find more details in the chart.
Trade wisely best of Luck Buddies.
Ps; Support with like and comments for better analysis Thanks For Support.

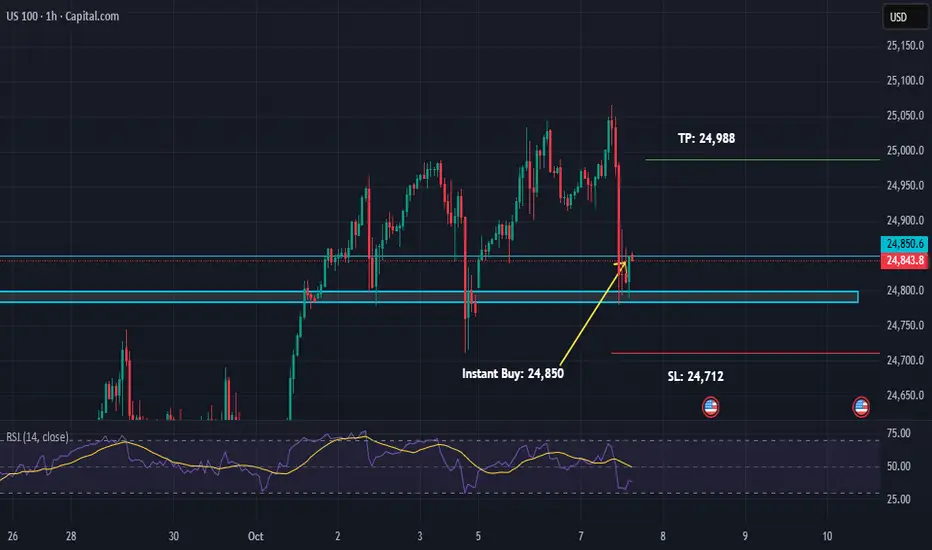
US100 Bounce from SupportUS100 is showing a bounce from Support. We can take a 1:1 trade here. Let's see how it goes.

NASDAQ BearishSince creating ATH earlier today, the index has come crushing down and there is a change in character, switching to bearish.
I do anticipate that the price might have pullback, before we continue going south

Nas100 Trade Set Up Oct 8 2025Price has made a LL indicating bearish structure so i will look for sells when BSL/London highs are swept to target PDL
www.tradingview.com
