US100 BULLISHbullish on all timeframes apart from 1min and 5min.
price has just broken through previous swing high.
ill be waiting for a correction and will be entering a long position with a 2:1 rrr.
but I will be looking to take partial profits and allowing trade to run if price action is still show bullish strength.
Trade ideas
NAS100US100 created a NH as price is changing direction creating a bearish peanant, price to retrace back to resistance before it dumps..Trade safe and be Blessed..

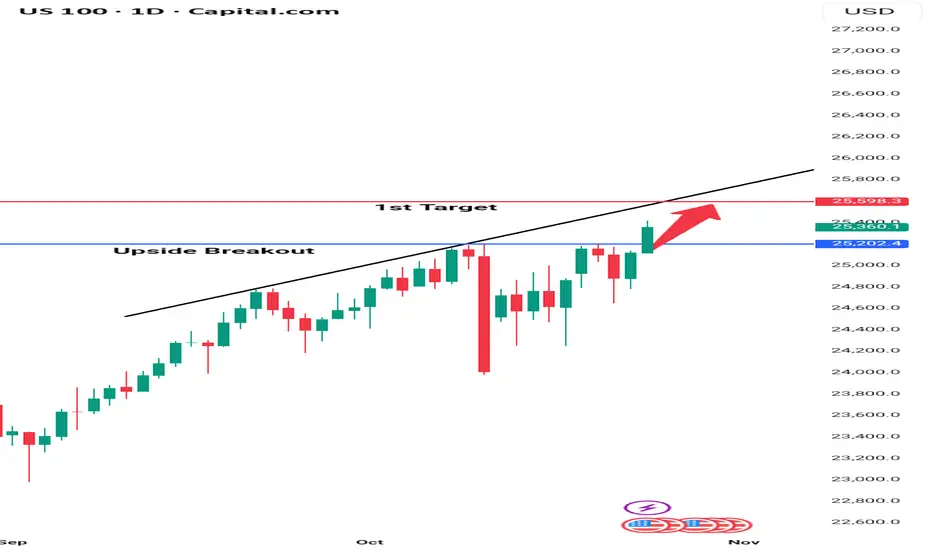
US 100 Upside Breakout – Target in SightUS 100 has broken above key resistance at 25,074, confirming a bullish breakout. Price is now at 25,508, supported by VWAP and 5 EMA. Momentum favors buyers, with the 1st target near 27,000, expected to be reached in the upcoming week if trend strength continues. Ideal entry on pullbacks or bullish continuation candles. Place stop-loss below breakout zone at 24,800 to manage risk. Watch for volume confirmation and sustained price action. This setup offers a short-term opportunity for swing traders aiming to ride the breakout wave.
Naz 100 into the new weekPop higher on good earnings.?
Or bad news and we get a retrace into support

NAS100 Intraday & Swing Trade Setup🎯 NAS100 (NASDAQ-100) Technical Analysis: Oct 27-31, 2025 | Intraday & Swing Trade Setup
Closing Price: 25,373.7 | Date: Oct 25, 2025 12:54 AM UTC+4 | Timeframes: 5M, 15M, 30M, 1H, 4H, 1D
━━━━━━━━━━━━━━━━━━━━━━━━━━━━━━━━━━━━━━━━━━━━━━━━━━━━
📊 ELLIOTT WAVE & STRUCTURAL ANALYSIS 🌊
From the daily chart perspective, NAS100 shows completion of Wave 4 correction around 25,100-25,200 support zone. Current positioning at 25,373.7 suggests early Wave 5 development with bullish impulse structure emerging. The 4H timeframe confirms impulsive uptrend with higher highs and higher lows—classic Elliott Wave signature for institutional accumulation phase.
💡 KEY INSIGHT: If 25,900-26,050 resistance breaks decisively on 4H close with volume confirmation, we target Wave 5 extension toward 26,400-26,800 range through mid-week.
━━━━━━━━━━━━━━━━━━━━━━━━━━━━━━━━━━━━━━━━━━━━━━━━━━━━
🔄 DOW THEORY & TREND CONFIRMATION ⬆️
Primary Trend: Bullish | Higher highs established above 25,600 on 1H charts
Secondary Trend: Consolidation above 25,300-25,350 support validates buyer control
Confirmation Signal: Volume surge on breakouts above 25,900 confirms institutional participation
The daily VWAP sits at 25,420, acting as dynamic support. Price trading above VWAP with 1D EMA(20) > EMA(50) > EMA(200) alignment signals strong bullish conviction for the coming week.
━━━━━━━━━━━━━━━━━━━━━━━━━━━━━━━━━━━━━━━━━━━━━━━━━━━━
⚡ INTRADAY SETUPS: 5M TO 1H TIMEFRAMES
5M & 15M: Utilize Ichimoku Cloud crosses for quick scalp entries. Tenkan-sen/Kijun-sen crossover signals 3-5 minute momentum trades. Bollinger Bands (20,2) show tight squeeze—breakout imminent. RSI <30 on 5M = panic-sell exhaustion reversal opportunity.
30M: This is the swing trader's sweet spot . Harmonic patterns—particularly Butterfly and Bat patterns—should be monitored around 25,200-25,100 support confluence. Gann angles from Oct 22 low project resistance at 25,888, 26,150.
1H: Primary intraday timeframe for entry/exit. Support: 25,300 (VWAP), 25,100. Resistance: 25,900 (breakout trigger), 26,050. RSI overbought above 70 = profit-taking zone. EMA(9) above EMA(21) = trend strength confirmation.
━━━━━━━━━━━━━━━━━━━━━━━━━━━━━━━━━━━━━━━━━━━━━━━━━━━━
🎪 WYCKOFF METHOD & ACCUMULATION PHASE 📈
Current price action displays classic Wyckoff accumulation: Spring formation around 25,200 + subsequent recovery above neckline. Effort (volume) on upside breakouts now exceeds effort on downside—textbook Wyckoff buying climax setup. Watch for secondary test of 25,300—if holds above with lower volume, expect breakout run to 26,000+.
⚠️ WARNING: Climax volume spike above 26,000 may indicate exhaustion—take profits on target.
━━━━━━━━━━━━━━━━━━━━━━━━━━━━━━━━━━━━━━━━━━━━━━━━━━━━
🔷 HARMONIC PATTERNS & FIBONACCI LEVELS 📐
Gartley Pattern forming in 4H with D-point targeting 25,850-25,920 (78.6% Fib retracement). Potential risk/reward ratio of 1:3+ makes this ideal swing entry zone. Support cluster: 25,300-25,420 (multiple MA confluence + VWAP). Extended Fib target: 26,400 (161.8% extension from Oct 22 impulse base).
━━━━━━━━━━━━━━━━━━━━━━━━━━━━━━━━━━━━━━━━━━━━━━━━━━━━
📍 TRADING PLAN: MON-FRI (OCT 27-31) 🗓️
INTRADAY SCALPERS (5M-30M): Target 25,750-25,850 breakout on Monday. Stop: 25,250. Take profit 1: 25,650 (+300 pips). Repeat breakout patterns on every higher low formation.
SWING TRADERS (4H-1D): Accumulate longs 25,300-25,420 on dips. Primary target: 26,150-26,250 (Wave 5 target). Secondary: 26,400-26,800. Stop loss: 24,900 (break below daily cloud). Risk/reward: 1:2.5 minimum.
⏰ OPTIMAL TIMING: US market open (13:30 UTC) provides best 5M-1H breakout volatility.
━━━━━━━━━━━━━━━━━━━━━━━━━━━━━━━━━━━━━━━━━━━━━━━━━━━━
🚨 REVERSAL & BREAKOUT SIGNALS 🎯
Reversal Alert: If RSI divergence forms (lower high on price, lower high on RSI) at 26,000+ = sell-off imminent. Initial support: 25,650. Hard stop: 25,420.
Breakout Confirmation: Volume >200M shares on 4H close above 26,000 = institutional breakout, extend targets to 26,600+. Failure to hold 25,900 three times = bullish setup invalidation.
━━━━━━━━━━━━━━━━━━━━━━━━━━━━━━━━━━━━━━━━━━━━━━━━━━━━
📊 VOLATILITY & BOLLINGER BAND SQUEEZE 📉
Current Bollinger Band width suggests compression before expansion . Watch 1H BB (20,2) for band walk breakout into 26,000+ on closing above upper band. ATR expansion above 250-300 points validates trending move. Consolidation below upper band = power accumulation before next leg up.
━━━━━━━━━━━━━━━━━━━━━━━━━━━━━━━━━━━━━━━━━━━━━━━━━━━━
⚖️ RISK MANAGEMENT CHECKLIST ✅
Daily loss limit: 2% portfolio | Use 1:2 minimum risk/reward ratio
Position sizing: Reduce entries above 26,200 (resistance cluster)
Breakout confirmation: Require 5-minute close above resistance + volume spike
Support holds: If 25,300 closes below on daily, trend invalidates—exit swings
━━━━━━━━━━━━━━━━━━━━━━━━━━━━━━━━━━━━━━━━━━━━━━━━━━━━
🎓 Technical Theory Applied: Elliott Wave (Wave 5 setup) | Wyckoff (Accumulation completion) | Dow Theory (Higher highs confirmation) | Harmonic Patterns (Gartley D-point) | Gann (Angular resistance) | Japanese Candlesticks (Bullish engulfing on 4H)
🛠️ Indicators Aligned: Bollinger Bands (squeeze breakout), RSI (bullish divergence), Volume (accumulation), VWAP (dynamic support), MAs (uptrend slopes), Ichimoku Cloud (bullish crossover).
📈 Bias: BULLISH with caution above 26,200
━━━━━━━━━━━━━━━━━━━━━━━━━━━━━━━━━━━━━━━━━━━━━━━━━━━━
⚠️ Disclaimer: This post is educational content and does not constitute investment advice, financial advice, or trading recommendations. The views expressed here are based on technical analysis and are shared solely for informational purposes. The stock market is subject to risks, including capital loss, and readers should exercise due diligence before investing. We do not take responsibility for decisions made based on this content. Consult a certified financial advisor for personalized guidance.

NSDQ100 ahead of US CPI Geopolitics dominated sentiment over the past 24 hours, setting the tone for today’s NASDAQ 100 session.
Market backdrop:
Fresh US sanctions on Russian oil sparked a surge in energy prices, with Brent crude posting its largest two-day gain since 2022. The move drove a sell-off in global bonds, as 10yr US Treasury yields rose +5.1bps, their biggest daily increase in over a month, ahead of the long-delayed September CPI report.
Despite the rise in yields, equities held firm, buoyed by improved risk appetite. The NASDAQ 100 gained +0.58%, supported by renewed optimism in the tech sector and positive sentiment following the White House confirmation of a Trump–Xi meeting next week, which helped temper trade war concerns.
Drivers for today:
US CPI (September) – the first major data point since the government shutdown. A softer print could reinforce expectations of a Fed rate cut next week, while a stronger reading risks unsettling both bonds and high-valuation tech names.
Geopolitical dynamics – Markets remain sensitive to any new developments in the US–China trade narrative and Russia sanctions, which continue to drive energy and inflation expectations.
Tech sentiment – Optimism in large-cap tech remains supportive, though rising yields could limit upside momentum.
Commodities:
Gold is on track to end its nine-week rally, down over 3% this week as investors rotate out of safe havens amid hopes of easing geopolitical tensions.
Outlook:
The NASDAQ 100 enters the session on firmer footing, with risk appetite improving thanks to trade optimism. However, volatility is likely around the CPI release, which will be the key determinant for near-term Fed policy and tech sector performance.
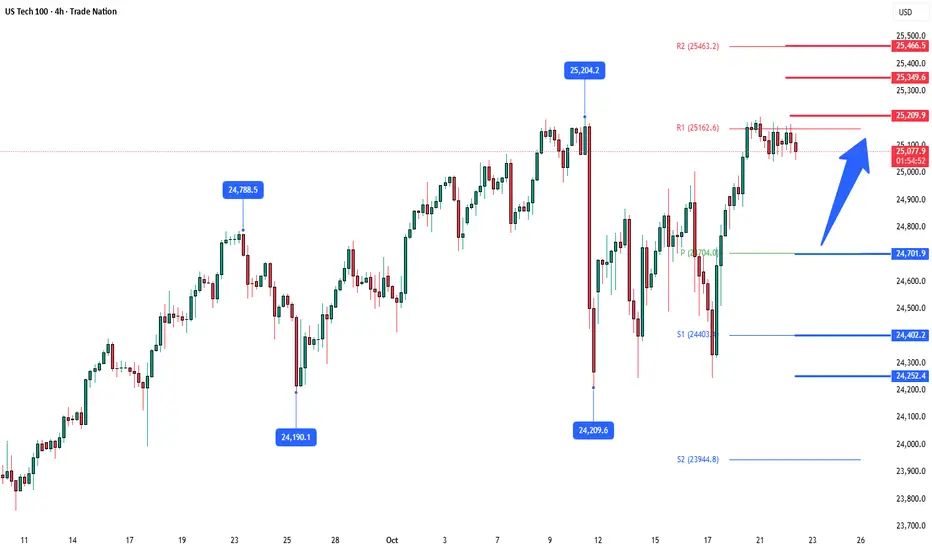
Key Support and Resistance Levels
Resistance Level 1: 25350
Resistance Level 2: 25466
Resistance Level 3: 25600
Support Level 1: 24917
Support Level 2: 24700
Support Level 3: 24400
This communication is for informational purposes only and should not be viewed as any form of recommendation as to a particular course of action or as investment advice. It is not intended as an offer or solicitation for the purchase or sale of any financial instrument or as an official confirmation of any transaction. Opinions, estimates and assumptions expressed herein are made as of the date of this communication and are subject to change without notice. This communication has been prepared based upon information, including market prices, data and other information, believed to be reliable; however, Trade Nation does not warrant its completeness or accuracy. All market prices and market data contained in or attached to this communication are indicative and subject to change without notice.

Nas100 Trade Set Up Oct 23 2025Price is highly bearish and has filled a 4h FVG already and swept SSL/Asia lows so i will want to see price come up to sweep 15m BSL/Equal highs before making internal structure making 1m-5m IFVG/CISD to target PDL

Nas100 Trade Secured 1500 PipsPrice closed under daily highs and swept daily BSL so i knew lower levels were the target so i waited to 15m BSL to be swept before taking sells to lower levels. Price ended up coming all the way down to fill 4h FVG

NQ Vision for the next daysWe swept 4h candles low. Shifted structure, I'm expecting the price to go into discount and to my enhanced OTE zone and reverse. If the price doesn't get accepted there and supply exceeds demand I expect further down movements.

22 OCT 2025: MARKET RECAP WITHIN DAILY PROFILEObserve how price delivered according to 20 OCT WEEKLY OUTLOOK
DISCLAIMER:
The owner of this page is an authorised Representative under supervision of TD MARKETS (PTY) LTD, an authorised Financial Services Provider (FSP No. 49128) licensed by the Financial Sector Conduct Authority (FSCA) under the Financial Advisory and Intermediary Services Act (FAIS).
The FSP is licensed to provide advice and intermediary services in respect of Category I financial products, including but not limited to derivative instruments, long-term deposits, and short-term deposits.
All investment ideas are provided in accordance with the scope of the FSP's license and applicable regulatory requirements. Derivative instruments is a leveraged products that carry high risks and could result in losing all of your capital, and past performance is not indicative of future results.
This idea and any attachments are informational/education and does not constitute a recommendation to buy/sell.
No guarantee is made regarding the accuracy or outcome of this trade idea.
If you choose to accept this idea, please do so at your own risk.

23 OCT 2025: MARKET OUTLOOK FOR THE DAYUpdate to 20 OCT 2025 Weekly Outlook
The devil is in the detail...
DISCLAIMER:
The owner of this page is an authorised Representative under supervision of TD MARKETS (PTY) LTD, an authorised Financial Services Provider (FSP No. 49128) licensed by the Financial Sector Conduct Authority (FSCA) under the Financial Advisory and Intermediary Services Act (FAIS).
The FSP is licensed to provide advice and intermediary services in respect of Category I financial products, including but not limited to derivative instruments, long-term deposits, and short-term deposits.
All investment ideas are provided in accordance with the scope of the FSP's license and applicable regulatory requirements. Derivative instruments is a leveraged products that carry high risks and could result in losing all of your capital, and past performance is not indicative of future results.
This idea and any attachments are informational/education and does not constitute a recommendation to buy/sell.
No guarantee is made regarding the accuracy or outcome of this trade idea.
If you choose to accept this idea, please do so at your own risk.

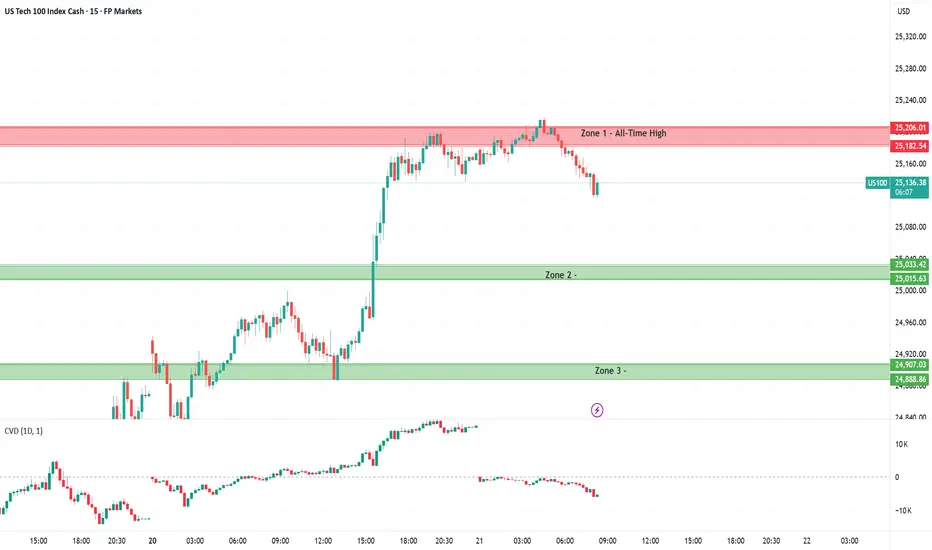
Nas100 caught in the crossfire – US–China trade fears returnToday's sentiment
After Tuesday’s pullback, the Nas100 is trading with a tone of cautious defensiveness. Yesterday’s decline was driven by renewed fears of US–China trade tensions after reports suggested Washington may impose new export restrictions on software-related products, sparking concern over supply-chain disruptions and rekindling risk aversion across global markets.
Today, sentiment remains fragile. Investors are still broadly optimistic about tech and AI-driven growth, but the willingness to chase the market higher has faded with the index sitting near record highs. The lack of new macro data due to the ongoing US government shutdown adds to uncertainty, leaving traders highly reactive to headlines.
Overall, the Nas100’s tone is structurally bullish but tactically cautious, the broader uptrend remains intact, yet momentum is vulnerable to any fresh trade-war headlines or disappointing corporate results.
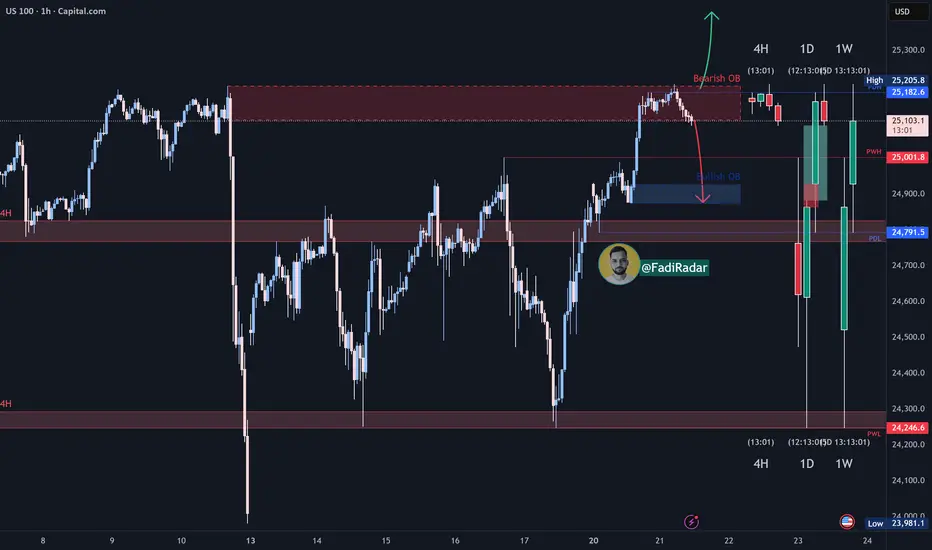
4H Technical Zone Analysis
Zone 1: All-Time High
This is the current all-time high region and the market’s strongest resistance. Price has tested this area several times but failed to sustain a breakout, indicating that sellers remain active and liquidity is being absorbed here. Until buyers manage to close decisively above this zone with strong volume, it remains a heavy supply level likely to trigger short-term rejections or liquidity grabs.
Zone 2: Intraday Supply / Seller Reaction Zone
This zone represents the area where sellers stepped in yesterday, driving the market lower from its upper range. It acts as a short-term resistance and could serve as a retest level if the price attempts another push higher. If buyers reclaim this zone with momentum, it would open the door for another test of the all-time high (Zone 1). However, repeated failures here could confirm seller strength and reinforce the current consolidation phase.
Zone 3: Asia Session Low
This area was defended during the Asian session and marks a near-term demand pocket. The strong rebound from this level shows that buyers are still willing to step in aggressively on dips. Holding above Zone 3 keeps the short-term structure bullish. If it breaks, however, the next area of interest lies at Zone 4.
Zone 4: Yesterday’s Low
This zone represents the lower boundary of the current structure — yesterday’s low and the last significant area of demand before a deeper retracement. It’s a strong liquidity zone where buyers previously absorbed selling pressure. A break below would signal a shift in sentiment and could trigger a move toward 24,500 or lower.


US100 To Make New ATH, Breakout From Range Expected on 1HUS100 can make a new All-Time-High if it breaks from this small range formed on 1H timeframe.
Nasdaq is in Bullish Momentum, and it looks like this new ATH is quite possible.
Let's take a 1:1 Buy-Stop trade here.
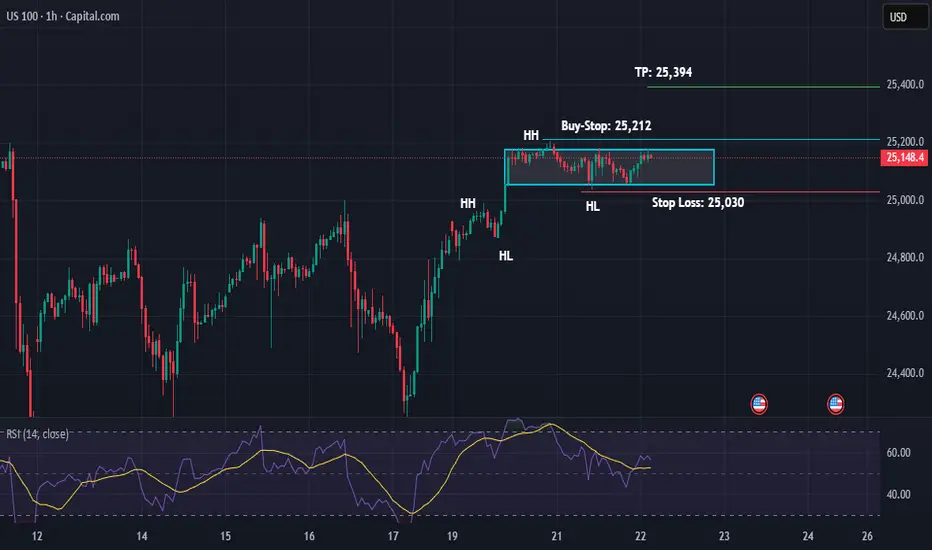
Scenario 2Scenario 2: Sideways 1H LTF, Bullish 4H HTF
Buy stop @ cambist red above (25208.8)
Risk 0.4%
R:R 1:1

NSDQ100 Focus today on key tech earnings (Tesla, IBM, SAP)Tech stocks held steady yesterday, with the Nasdaq 100 little changed, as broader markets consolidated near record highs. The S&P 500 (+0.003%) and STOXX 600 (+0.21%) both hovered just below their recent peaks, while the 10yr US Treasury yield slipped to a one-year low of 3.96%, supporting equity valuations.
The session’s standout move came from commodities, where gold (-5.3%) and silver (-7.1%) suffered their sharpest single-day declines in years, despite lower yields that would normally support precious metals. The drop appeared to be a technical correction after gold’s exceptional rally this year (+57% YTD).
On the macro front, sentiment was mixed. The US government shutdown entered its 22nd day, now the second longest in history, with few signs of resolution as President Trump urged Senate Republicans to hold firm. Meanwhile, Trump’s comments on trade offered some optimism — he suggested talks with China’s Xi Jinping could produce a “good deal,” though a meeting remains unconfirmed.
In corporate news, Anthropic and Google are reportedly discussing a multi-billion-dollar cloud computing deal, underscoring ongoing AI infrastructure investment — a potential positive for large-cap tech sentiment. Conversely, Apple faced minor headwinds amid reports that its foldable iPad project has hit development delays.
Overall:
The Nasdaq 100 remained stable as investors balanced easing yields, positive AI-sector momentum, and uncertainty over the government shutdown. Focus today will turn to key tech earnings (Tesla, IBM, SAP) and macro data for directional cues.
Key Support and Resistance Levels
Resistance Level 1: 25200
Resistance Level 2: 25350
Resistance Level 3: 25466
Support Level 1: 24700
Support Level 2: 24400
Support Level 3: 24250
This communication is for informational purposes only and should not be viewed as any form of recommendation as to a particular course of action or as investment advice. It is not intended as an offer or solicitation for the purchase or sale of any financial instrument or as an official confirmation of any transaction. Opinions, estimates and assumptions expressed herein are made as of the date of this communication and are subject to change without notice. This communication has been prepared based upon information, including market prices, data and other information, believed to be reliable; however, Trade Nation does not warrant its completeness or accuracy. All market prices and market data contained in or attached to this communication are indicative and subject to change without notice.
21 OCT 2025: US100 MARKET RECAPNOT A DAY FOR THE FAINT HEARTED
Study through the consolidation!
DISCLAIMER:
The owner of this page is an authorised Representative under supervision of TD MARKETS (PTY) LTD, an authorised Financial Services Provider (FSP No. 49128) licensed by the Financial Sector Conduct Authority (FSCA) under the Financial Advisory and Intermediary Services Act (FAIS).
The FSP is licensed to provide advice and intermediary services in respect of Category I financial products, including but not limited to derivative instruments, long-term deposits, and short-term deposits.
All investment ideas are provided in accordance with the scope of the FSP's license and applicable regulatory requirements. Derivative instruments is a leveraged products that carry high risks and could result in losing all of your capital, and past performance is not indicative of future results.
This idea and any attachments are informational/education and does not constitute a recommendation to buy/sell.
No guarantee is made regarding the accuracy or outcome of this trade idea.
If you choose to accept this idea, please do so at your own risk.

20 OCT 2025: US100 MARKET RECAPSTUDY!!
WELCOME TO MY ONLINE JOURNAL
DISCLAIMER:
The owner of this page is an authorised Representative under supervision of TD MARKETS (PTY) LTD, an authorised Financial Services Provider (FSP No. 49128) licensed by the Financial Sector Conduct Authority (FSCA) under the Financial Advisory and Intermediary Services Act (FAIS).
The FSP is licensed to provide advice and intermediary services in respect of Category I financial products, including but not limited to derivative instruments, long-term deposits, and short-term deposits.
All investment ideas are provided in accordance with the scope of the FSP's license and applicable regulatory requirements. Derivative instruments is a leveraged products that carry high risks and could result in losing all of your capital, and past performance is not indicative of future results.
This idea and any attachments are informational/education and does not constitute a recommendation to buy/sell.
No guarantee is made regarding the accuracy or outcome of this trade idea.
If you choose to accept this idea, please do so at your own risk.

NASDAQ 100 MID-WEEK OPINION SHARING by MrPhotonIt still hasn't broken the all-time high level. In line with the latest news, I expect a 2%-2.3% correction in the first stage. If the price breaks the uptrend channel and falls below 24300, it is likely to consolidate IG:NASDAQ .

Bearish outlook on nasdaq Price to put the previous engineered liquidity, I would expect to see price fall lower to take out the origin of the move that went to take out the engineered bearish liquidity

NAS100USD GOLD MIRROR EQ.1) NAS100USD — SNIPER ZONES (live levels from your charts)
Context: previous-week pivots you provided earlier (Tuesday/Thursday) and current price ~ 25,185.
Key levels (use these to draw horizontal zones on 1D / 4H / 1H / 15m)
Pivot Resistance (Prev Tue High): 25,228 (R1)
Immediate Resistance cluster: 25,250 – 25,300 (R2)
Current Bias / Mid: 25,185 (mid)
Support (session swing): 24,800 – 24,750 (S1)
Lower structural support (Prev Thurs Low): 23,998 (S2)
Draw these on 1D and 4H. On 1H/15m use the exact same horizontal lines and highlight the small intraday confluence zones inside them.
A — Bullish Sniper (Breakout + Pullback)
Trigger: Price closes above 25,228 on 15m or 1H and then pulls back into 25,150–25,200 zone (confluence: fib, VWAP or 1H/15m trendline).
Entry: Limit buy in 25,150–25,200 on the pullback (or market on confirmed rejection of the zone).
Stop: 25,100 (15–50 pts below entry depending timeframe; typical stop = 25–50 pts).
TP ladder:
TP1 = +30 pts → ~25,180–25,230 (close partial)
TP2 = +60 pts → ~25,260–25,320 (second partial)
TP3 = +100 pts → ~25,350–25,400 (final take)
R:R guideline: Aim ≥2.5:1 on full ladder (scale out).
Confirmation: Finviz breadth green & TimeMirror projection from Gold (see gold confirmation below) → increase size.
B — Bearish Sniper (Breakdown + Retest)
Trigger: Clear break and close below 24,800 with momentum OR rejection at 25,250 fails and price falls back under 24,800.
Entry: Sell on retest of 24,800–24,770 (rejection candle on 15m/1H).
Stop: 25,020 (approx 220 pts above, tighten for intraday to 25,000 if aggressive).
TP ladder:
TP1 = 24,500 (-30–50 pts)
TP2 = 24,200 (-100 pts)
TP3 = 23,900 (target S2 area)
Risk control: If CFTC shows net-long expanding (small-cap strength) or Finviz breadth strongly bullish, skip or reduce size.
C — Intraday Micro-Sniper (15m / 5m)
Range play between 25,228 and 24,800.
Entries: Look for wick rejections at zone edges on M15/M5. Tight stops (10–20 pts). TP small (20–40 pts). Only 1–2 units max per day.

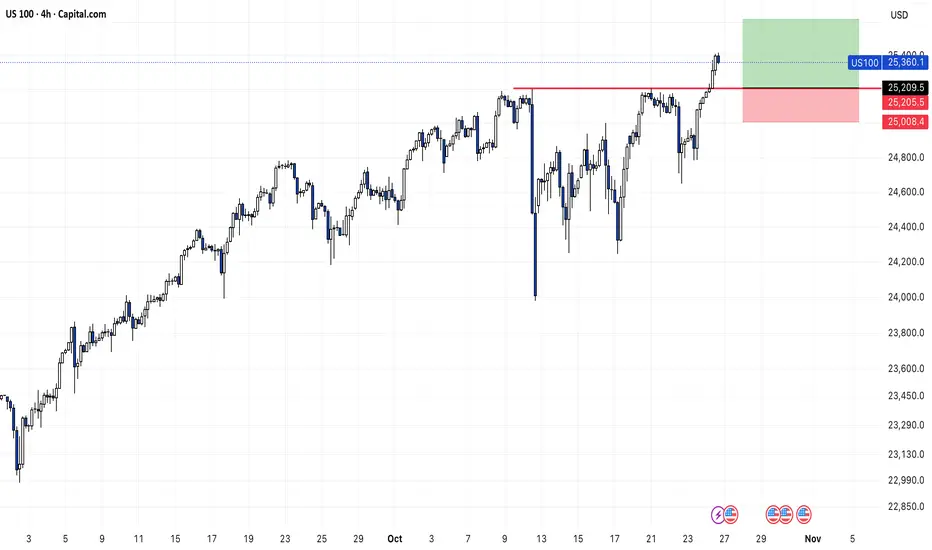
NASDAQ (US100) Analysis:The NASDAQ index recently tested its all-time high and is now showing signs of a potential corrective pullback after a strong bullish run.
📉 Expected scenario:
The price may retrace toward the 24,900 demand zone, which serves as an important support area.
If the index bounces from this level, it could resume its upward movement to form a new high.
However, if the price breaks below 24,900 and holds, a deeper move toward 24,600 is likely.
📈 Best buy zone: On a confirmed rebound from 24,900
📍 Best sell zone: On a confirmed rebound from 25,100, or Below 24,900 after confirmation
US100 Consolidates Below All-Time Highs-Can Bulls Break Through?US100 – 4H Technical Zone Analysis
Zone 1: All-Time High
This area represents the current all-time high and a clear supply zone where sellers previously absorbed aggressive buying pressure. It remains the strongest resistance in the current structure, a breakout above must be confirmed by sustained acceptance and volume before it can be trusted. Otherwise, this level continues to offer short opportunities or liquidity traps for late buyers.
Zone 2: Key Demand
This zone served as resistance before the most recent breakout and now acts as the first layer of demand. It’s a technical “flip zone,” where buyers stepped in to defend structure after the breakout attempt. As long as price holds above Zone 2, short-term bullish momentum remains valid. A clean break back below, however, would suggest a failed breakout and likely pull price toward deeper liquidity below.
Zone 3: Strong Buy Zone
This zone represents Monday’s low, the point where buyers stepped in decisively and drove the breakout move higher. It’s effectively the foundation of the current leg up and acts as a strong demand pocket created by institutional buying. As long as price remains above this area, market structure stays firmly bullish. A clean break below would invalidate the recent bullish impulse and indicate weakening buyer control.
Today’s market mood and outlook for US100
The US100 is holding a cautiously optimistic tone today, extending the strength seen on Monday. Yesterday’s rally was fueled by gains in major tech names, particularly Apple, alongside renewed hopes for progress in US–China trade relations and growing expectations of future Fed rate cuts.
That optimism continues into today, though investors remain wary. Falling oil prices and concerns about slowing global demand are tempering enthusiasm, and with the US government shutdown still delaying key data releases, visibility remains limited.
Overall, sentiment stays positive but measured, markets are leaning risk-on, supported by tech momentum and easing trade tensions, yet the rally remains vulnerable to any negative macro or geopolitical surprises.