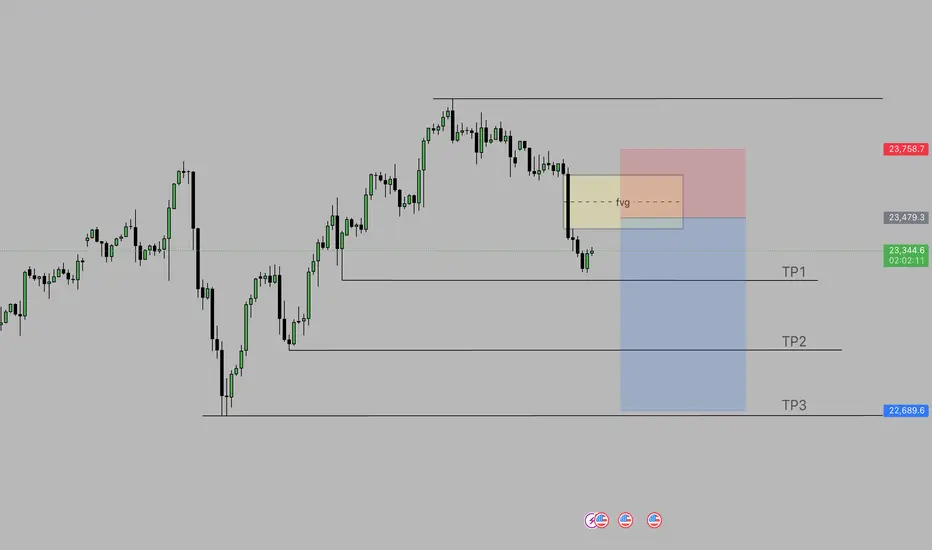
US100 SELLAfter us100 rises to its fvg in 4h, it will take the gap here and fall back to its targets below.
USTEC trade ideas
Nasdaq100 Triple bearish divergenceWe have a clear triple bearish divergence on the Nasdaq, and double bearish divergence on S&P500 which suggest downward movement sooner or later.
Disclaimer: This content is NOT a financial advise, it is for educational purpose only.

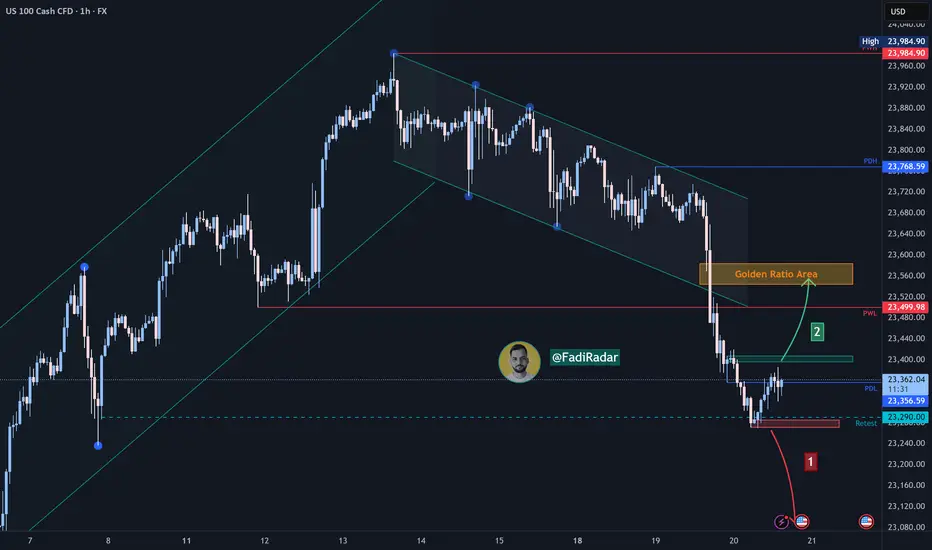
NASDAQ Index (US100 / NASDAQ) AnalysisThe index is moving in a bullish trend on the higher timeframes (Daily – H4), while showing a bearish move on the 1H timeframe. Currently, it is trading near the 23,340 area.
🔻 Bearish Scenario:
If the price breaks below 23,270 and holds, it may head to retest 23,080.
🔺 Bullish Scenario:
If the price manages to break and hold above 23,400, this could support a continuation towards 23,560 (a potential reversal zone – Fibonacci golden area). However, if buying momentum continues, the path could extend towards 23,680.
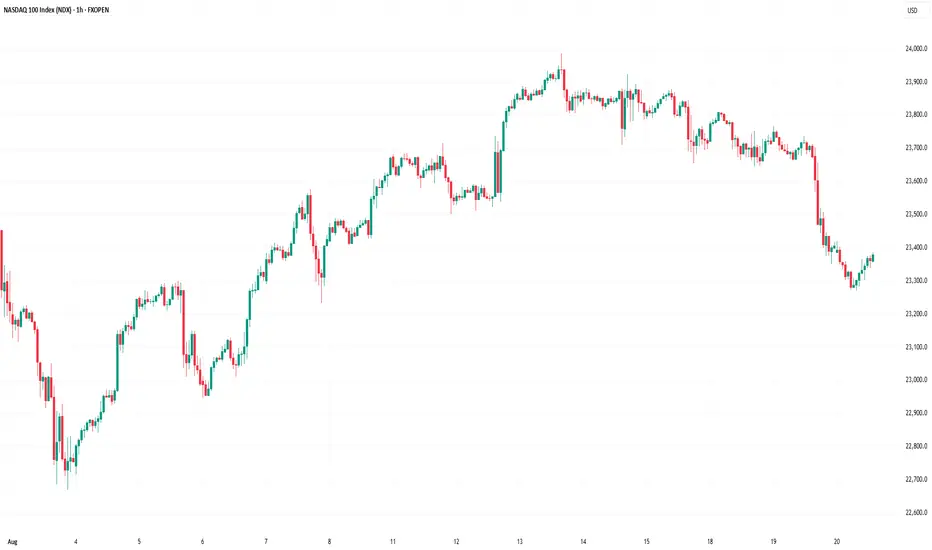
Nasdaq 100 Analysis: Tech Stocks Face Sell-OffsNasdaq 100 Analysis: Tech Stocks Face Sell-Offs
As the chart shows, the Nasdaq 100 index fell by approximately 1.6% yesterday.
According to media reports, bearish sentiment has been fuelled by the approach of key events:
→ the release of the FOMC meeting minutes (today at 21:00 GMT+3);
→ Jerome Powell’s speech at the Jackson Hole symposium on Friday. Market participants are preparing for remarks from the Fed Chair on the trajectory of interest rates.
Notably, the S&P 500 declined less significantly, while the Dow Jones remained virtually unchanged. This suggests that:
→ tech stocks are heavily overvalued due to AI-driven hype;
→ capital shifted yesterday from risk assets (including cryptocurrencies) into so-called safe havens.
Could tech stocks continue to decline?
Technical Analysis of the Nasdaq 100
Analysing the Nasdaq 100 index chart on 5 August, we plotted the main upward channel (shown in blue). It remains valid, as since then the price has:
1→ reached the upper boundary, which (as often happens) acted as resistance;
2→ retreated to the median line, where volatility decreased (a sign of balance between supply and demand), but only briefly.
Yesterday’s low coincided with the lower boundary of the channel.
From a bullish perspective, buyers might rely on:
→ a resumption of the uptrend from the lower boundary (as was the case in early August);
→ support at the 50% retracement level after the A→B impulse (located around the current price area);
→ a rebound from the oversold zone indicated by the RSI;
→ support at the 7 August low of 23,250 (a false bearish breakout remains possible).
On the other hand: the price has confidently broken through the channel median and then accelerated downwards (a sign of imbalance in favour of sellers). This imbalance zone (which, under the Smart Money Concept methodology, is considered a bearish Fair Value Gap) could act as resistance going forward.
Given the pace of yesterday’s decline, we could assume that sellers currently hold the initiative. Should we see weak rebounds (in the style of a dead cat bounce) from the channel’s lower boundary, the likelihood of a bearish breakout could increase.
This article represents the opinion of the Companies operating under the FXOpen brand only. It is not to be construed as an offer, solicitation, or recommendation with respect to products and services provided by the Companies operating under the FXOpen brand, nor is it to be considered financial advice.

NAS100 ShortElite Analysis
Executed off a 3m True OB
All confirmations met.
Targeting lower liquidity

Nasdaq 100 Holds Pivot Zone 23,280–23,360USNAS100 – Overview
The Nasdaq 100 reversed from the 23,045 support highlighted yesterday and is now trading above the pivot zone at 23,280–23,360.
Technical Outlook:
📈 Bullish scenario: As long as price holds above 23,280–23,360, upside momentum may extend toward 23,510 → 23,620 → 23,720. A confirmed breakout above 23,770 would strengthen the bullish trend and open the path to a new ATH near 24,090.
📉 Bearish scenario: On the downside, failure to hold above 23,280 would expose 23,045, with full bearish confirmation only if the index stabilizes below 22,990, targeting 22,720.
Key Levels:
Resistance: 23,510 – 23,620 – 23,720
Support: 23,280 – 23,045 – 22,720

NQ is still bullish on the HTFDespite NQ being bearish on the lower timeframes, it is very bullish on the higher timeframe. with good risk management, I would prefer siding with the buyers as per my analysis attached.

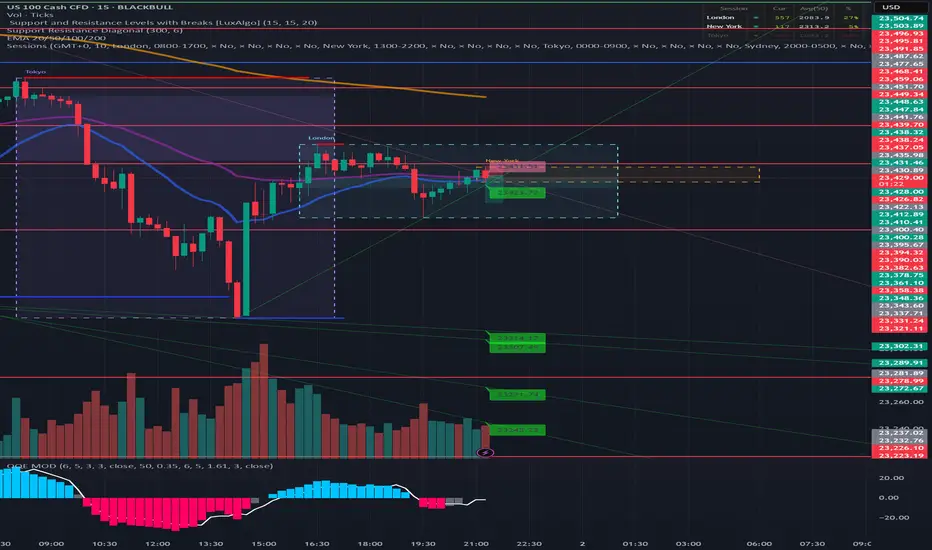
US100 – London Session OutlookTrading Focus
The marked zones on the chart highlight areas where I look for small but quick intraday moves. There are two potential sell zones and two potential buy zones. If a zone breaks, I look for continuation trades on a retest of that same level.
This approach allows me to capture short, tactical opportunities with clear risk levels, while adapting quickly if price breaks structure.
Macro Update – Manufacturing Still Under Pressure
Yesterday, the ISM Manufacturing PMI was released. The August figure came in at 48.7%, a slight improvement from July’s 48.0%, yet still below the 50% threshold that signals expansion. This indicates that U.S. manufacturing remains in contraction for the sixth consecutive month, though the slower pace points to some early signs of stabilization. New orders climbed back above 50%, suggesting demand may be recovering, but production and employment both weakened, and prices remained elevated, underscoring persistent cost pressures. Overall, the sector is still under strain, showing only tentative signs of recovery.
Market Sentiment
Overall, market sentiment is cautious. The rebound in new orders provides a hint of optimism, but weak production, soft labor data, and sticky input costs keep investors on edge. Traders remain defensive, seeking confirmation before committing risk in what is still a fragile backdrop.
What’s Next – JOLTS Job Openings
Today, all eyes are on the JOLTS Job Openings report, a key gauge of U.S. labor market strength.
A higher reading signals tight labor conditions, keeping wage and inflation pressures high and limiting the Fed’s ability to cut rates.
A weaker reading suggests cooling demand for workers, supporting the case for easing.
This release has the potential to move markets quickly, adding another layer of volatility.
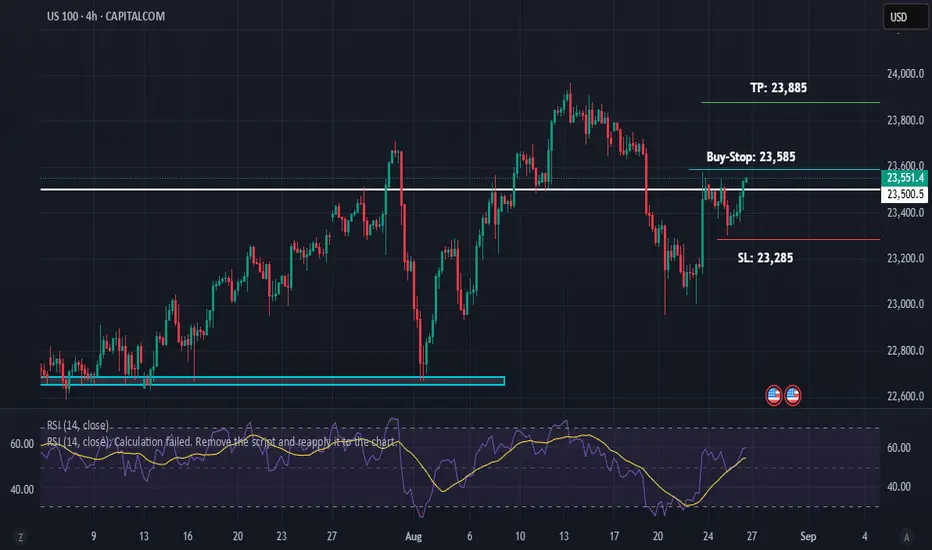
US 100 Buy-Stop, 4H/1D Close Above ResistanceUS 100 has closed above Resistance on 4 Hour and Daily Timeframe.
It is in Bullish Trend on Daily Timeframe. The trend is very likely to continue based on Technicals.
Moreover, it is likely that Federal Reserve will lower the interest rates in the Unied States. If that happens, financial markets will continue the upward trajectory. That however, is a long-term projection. Our trade setup here is just 1:1 but we can see more such trades in the future.
US 100 shortEntry: 23450
Stop Loss: above 1h Trendline: 23550
Target: just above 127 fibo level at 23208
Price clearly rejected from the 23,500 level.
Now I’m expecting a lower high (LH) followed by a lower low (LL) setup.

scalping this. didn't break higher high, we usa just found a new high, likely will try to find a new low first.
Slight push up - before a drop on NAS100A point of confluence to first be re-tested, before she'll drop.
I'm pretty confident that we'll see this move play out today... let's see what she does.
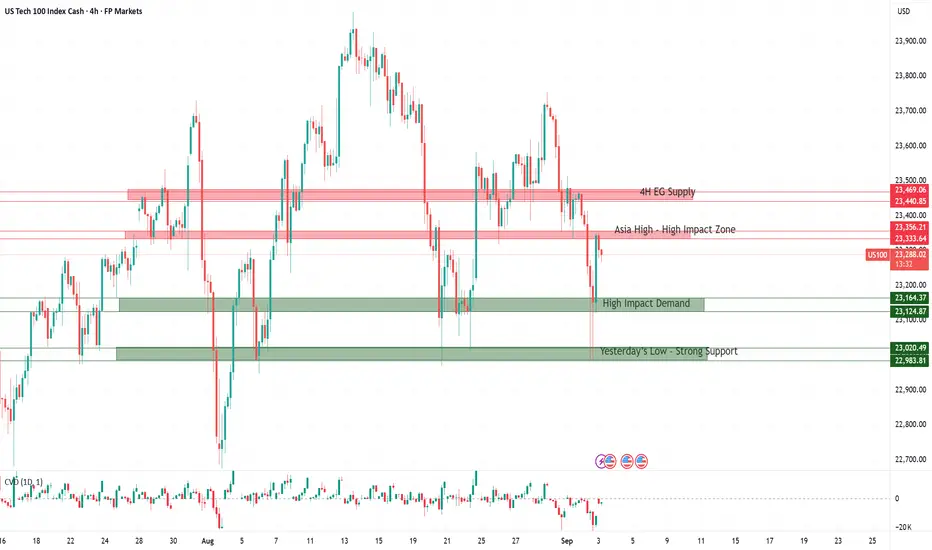
NAS100 4HTrading Outlook for Major Currency Pairs and Indices, Especially Gold and Silver, in the Upcoming Week
In this series of analyses, we have reviewed short-term trading perspectives and market outlooks.
As can be seen, each analysis highlights a key support or resistance area near the current price of the asset. The market’s reaction to or break of these levels will determine the subsequent price trend up to the next specified levels.
Important Note: The purpose of these trading outlooks is to identify key price levels and potential market reactions, and the analyses provided should not be considered as trading signals.

Nasdaq Pulls Back from Recent HighsToward the end of the week, the Nasdaq index began to retreat, posting a decline of at least 1.5% in the short term, as a new bearish bias has started to emerge strongly, preventing the index from reaching the historical highs again. For now, the momentum driven by expectations of lower interest rates has begun to fade in recent sessions, while corrections in stocks such as Nvidia—which represent a significant share of the index’s market capitalization—have limited buying pressure heading into the week’s close. Given this backdrop, as the market awaits key economic data, such as the upcoming U.S. employment report on Friday, uncertainty and sideways movements may continue to dominate trading sessions in the near term.
Short-Term Sideways Range
The lack of clear direction in recent movements has led to the formation of a sideways range in the Nasdaq, currently defined by resistance at 23,800 points and support at 22,800 points. As long as price action remains within these levels, neutrality will likely remain the prevailing scenario in the short term.
Technical Indicators
RSI: the RSI line is oscillating near the neutral 50 level, reflecting a consistent balance between buying and selling pressure over the past 14 sessions. This suggests that the neutral bias has begun to dominate short-term movements in the index.
MACD: the MACD histogram also hovers close to the 0 line, showing that short-term moving averages maintain a neutral bias. As long as this condition holds, the current sideways range is likely to remain relevant in upcoming sessions.
Key Levels to Watch:
23,800 points – Main Resistance: corresponds to recent highs in the Nasdaq. A sustained breakout above this level could open the door to a more consistent bullish trend in the short term.
22,800 points – Near-Term Support: aligns with the Ichimoku cloud and stands as the most important barrier for containing short-term downward corrections.
22,200 points – Critical Support: coincides with neutral price areas observed on the chart in February of this year and is also converging with the 200-period moving average. If this level comes under consistent pressure, it could pave the way for a more dominant bearish bias.
Written by Julian Pineda, CFA – Market Analyst

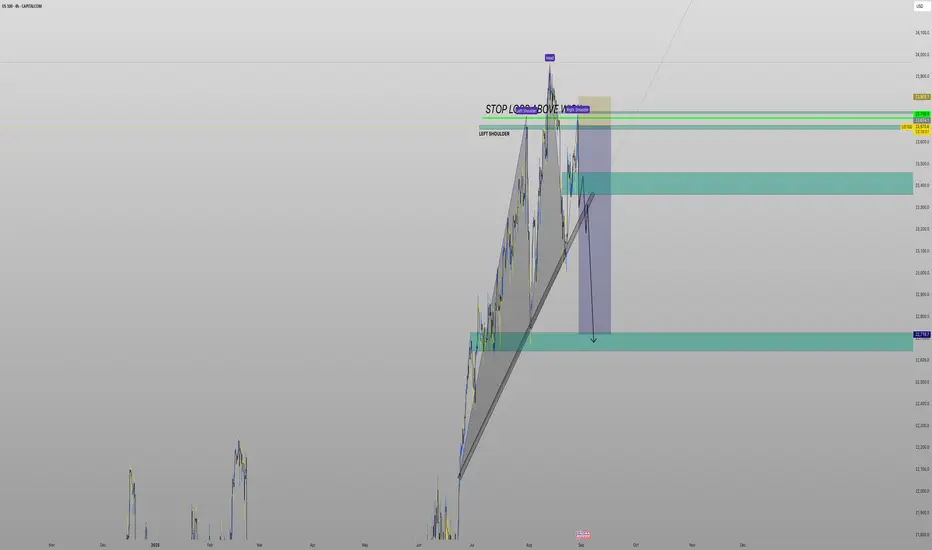
Possible ShortIm seeing Head & Shoulders on the 4hr time frame and I believe it has created a right shoulder to push to the downside
Nasdaq-100 Wave Analysis – 28 August 2025- Nasdaq-100 reversed from support zone
- Likely to rise to resistance level 24000.00
Nasdaq-100 index recently reversed from the support zone between the strong support level 23000.00 (which has been reversing the price from the middle of July), lower daily Bollinger Band and the 38.2% Fibonacci correction of the upward impulse from June.
The upward reversal from this support zone created the daily Japanese candlesticks reversal pattern Hammer – which started the active impulse wave (iii).
Given the strong daily uptrend, Nasdaq-100 index can be expected to rise to the next resistance level 24000.00 (which stopped the earlier impulse wave i).

us100 on buy till 23810 to sell#US100 we await for breakout 23700 2 times breakout to buy or M30 closure above there.
Possible target 23810-23850, stop loss at 23614.
Above 23810-23850 holds bearish reversal, price will fall till 23584.

US100 – Breakout or a Classic Bull Trap?
The US100 (Nasdaq Index) has recently shown what looks like a breakout on the 4-hour timeframe after a phase of consolidation. On the surface, this can easily be perceived as a bullish continuation. However, a closer look reveals that the breakout might just be setting up for a classic bull trap.
I am currently positioned short on the index with a view that the current move could fail to sustain. The price has entered into my marked supply zone, an area where selling pressure historically outweighs demand. If this zone holds true to its nature, we can see a strong rejection from here.
• LTP (Last Traded Price): 23,690
• Supply Zone: Highlighted on chart
• Downside Target: Around 22,500
The broader structure still suggests that while short-term euphoria pulls prices higher, the underlying momentum may not support sustained gains. If the bulls lose control here, the downside could open up swiftly, validating this thesis.
I’ll be watching how price reacts in this zone closely. For now, I remain short-biased, anticipating a rejection and a move towards the 22,500 mark.

Head and shoulder, right shoulder buildingShorting here, nullifed if it closed above 23800 today.
tp: 22000
NVDIA earning done and selling off now.
Core CPI and PPI have been hot, PCE might come high.
Movement into small cap and spread.
Not financial advice.

A Crucial Test Lies Ahead for the Nasdaq 100The Nasdaq 100 faces a major test over the remainder of this week, with Nvidia reporting results after the close on 27 August and the US PCE report due on the morning of 29 August. The index has struggled to regain its losses after peaking on 13 August, facing stiff resistance just below the 61.8% retracement level at 23,670. In addition, the 10- and 20-day moving averages have proved to be sticking points, with the index unable to break away from either.
Momentum, as measured by the relative strength index, has also turned lower, forming a series of lower highs. Furthermore, a bearish divergence has emerged, with the RSI making lower highs while the Nasdaq 100 registered higher highs from the end of July through to mid-August.
Looking more closely, we see that the Nasdaq 100 had a straight-line rally on 22 August, and such rallies can sometimes be treated in a similar fashion to gaps. As a result, it is entirely possible that the index could give back its recent gains and fall back to 23,210, especially if it continues to struggle to surpass resistance at 23,620.
A breakout above 23,620 would be a bullish development despite a number of bearish signals. It would suggest the potential for the index to rise to 23,800 and possibly back to the previous highs.
Written by Michael J. Kramer, founder of Mott Capital Management.
Disclaimer: CMC Markets is an execution-only service provider. The material (whether or not it states any opinions) is for general information purposes only and does not take into account your personal circumstances or objectives. Nothing in this material is (or should be considered to be) financial, investment or other advice on which reliance should be placed.
No opinion given in the material constitutes a recommendation by CMC Markets or the author that any particular investment, security, transaction, or investment strategy is suitable for any specific person. The material has not been prepared in accordance with legal requirements designed to promote the independence of investment research. Although we are not specifically prevented from dealing before providing this material, we do not seek to take advantage of the material prior to its dissemination.

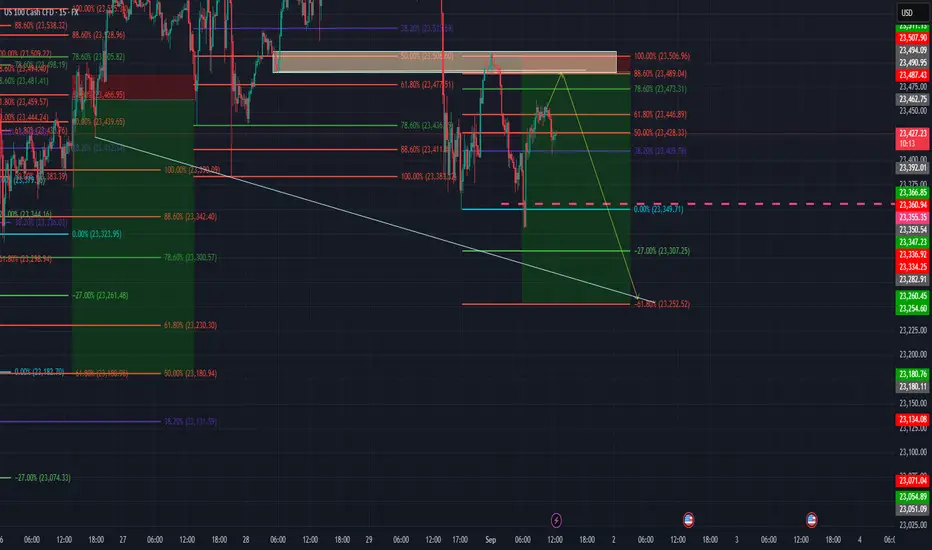
SHORT ON NAS100Using the 1h, 15m, and 5m bearish fvg the market need fill the gaps above 50% Fib range. Targeting the lows as the TPs

ict conceptsTrading foreign currencies can be a challenging and potentially profitable opportunity for investors. However, before deciding to participate in the Forex market, you should carefully consider your investment objectives, level of experience, and risk appetite. Most importantly, do not invest money you cannot afford to lose.
There is considerable exposure to risk in any foreign exchange transaction. Any transaction involving currencies involves risks including, but not limited to, the potential for changing political and/or economic conditions that may substantially affect the price or liquidity of a currency. Investments in foreign exchange speculation may also be susceptible to sharp rises and falls as the relevant market values fluctuate. The leveraged nature of Forex trading means that any market movement will have an equally proportional effect on your deposited funds. This may work against you as well as for you. Not only may investors get back less than they invested, but in the case of higher risk strategies, investors may lose the entirety of their investment. It is for this reason that when speculating in such markets it is advisable to use only risk capital.
