VIEW ANTAM ANTM looking for msci, if it can stay up 3400. It will get a great inflow fron MSCI up to 5-6B$
310 IDR
3.65 T IDR
69.19 T IDR
8.41 B
About PT Aneka Tambang Tbk
Sector
Industry
CEO
Achmad Ardianto
Website
Headquarters
Jakarta
Founded
1968
ISIN
ID1000106602
FIGI
BBG000BGW9S6
PT Aneka Tambang Tbk engages in the exploration, exploitation, processing, refining, and marketing of minerals, precious metals, and coal. It operates through the following segments: Nickel, Precious Metals and Refinery, Bauxite and Alumina, and Others. The Nickel segment refers to ferronickel and nickel ore sales. The Precious Metals and Refinery segment focuses on gold and silver mining, processing, refining, and marketing as well as precious metal refining services. The Bauxite and Alumina segment is involved in the production at the Tayan bauxite mine. The Others segment relates to coal commodities. The company was founded on July 5, 1968 and is headquartered in Jakarta, Indonesia.
Related stocks

ANTM - IDX outlookANTM shares have very good fundamentals. The current price is wrong because there are many issues that hit ANTM, such as the issue of 109 tons of gold which was thought to be fake gold, as well as the issue of Budi Said regarding demands for 1.1 tons of gold which was ultimately proven by Budi Said

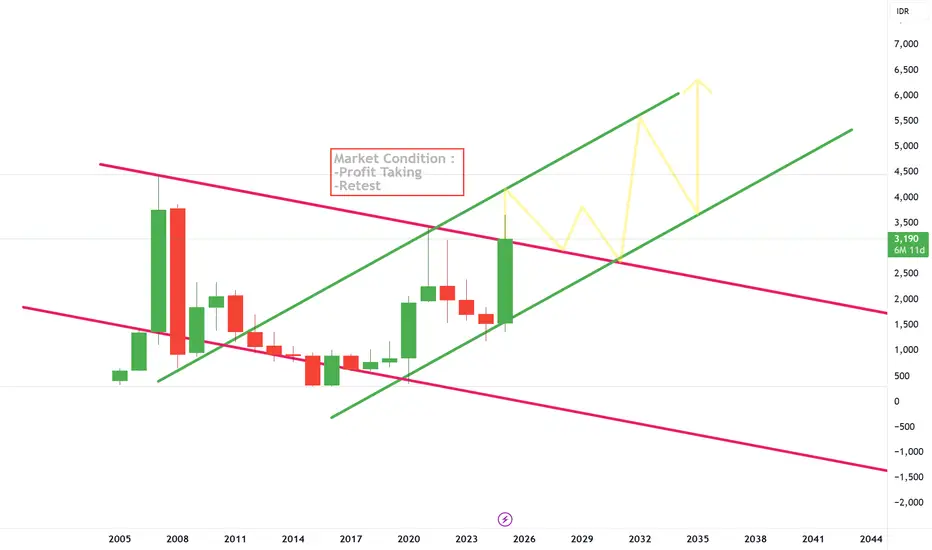
ANTM"There may be an initial phase of profit-taking, leading to a retest. If the breakout turns out to be false, the price is likely to revert to a bearish trend along the red line. However, if the breakout is confirmed, an uptrend may develop. The previous ATH must be broken first to validate the move.
ANTMDISCLAMER !!!!
I WILL SHARE ANTAM'S IDEA IN 2 STAGES
STAGE 1
with a long term and installment purchase, don't go all in
buy from a price of 1,400-1,175
SL 1,100
TP 1 1,865
TP 2 2,080
TP 3 2,290
stage 2
wait and see first
wait for price breakout 1,690 then buy and
sl 1,595
tp 1 1,865
tp 2 2,080
tp
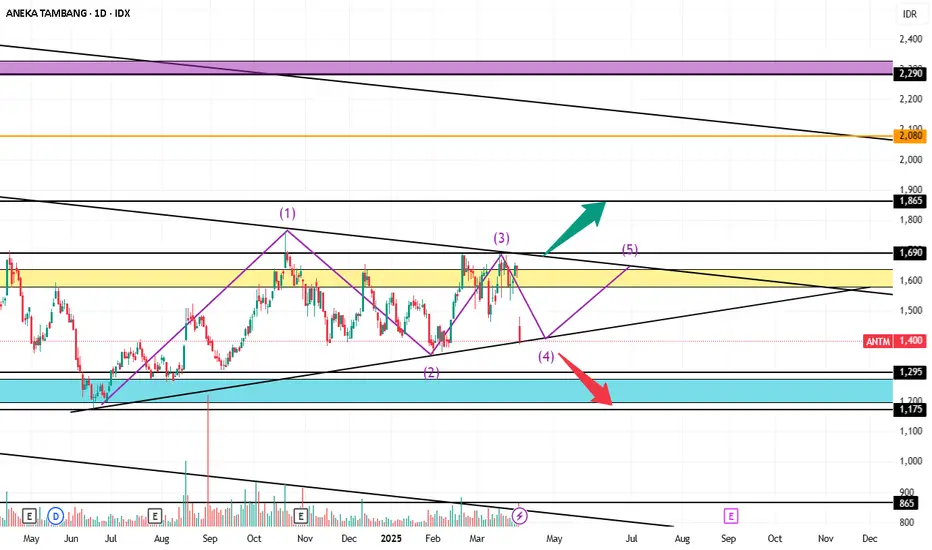
ANTM Elliott Wave CountQ4 2024 is set to be very shiny for ANTM. Gold sales for Q4 only equals to 15 tons, meanwhile the first 9 months of 2024 amounts to only 28 tons. Additionally, nickel sales also jumped in the fourth quarter.
Chart-wise, ANTM just finished its fourth wave yesterday, quite a steep drop. Volume duri


ANTM still in Cronic downward trend, in a year bullish? Looking into ANTM downward trend , ANTM has a good potential to reach the support 2 , maybe around S2. Watch its potential Golden cross. In no time, A year or two?


ANTM - December Potential BullishCandlestick pattern Nov 2023 was Hammer. Hammer is bullish reversal.
Resistance TF Mo: 1790, 1845, 200


See all ideas
Summarizing what the indicators are suggesting.
Neutral
SellBuy
Strong sellStrong buy
Strong sellSellNeutralBuyStrong buy
Neutral
SellBuy
Strong sellStrong buy
Strong sellSellNeutralBuyStrong buy
Neutral
SellBuy
Strong sellStrong buy
Strong sellSellNeutralBuyStrong buy
An aggregate view of professional's ratings.
Neutral
SellBuy
Strong sellStrong buy
Strong sellSellNeutralBuyStrong buy
Neutral
SellBuy
Strong sellStrong buy
Strong sellSellNeutralBuyStrong buy
Neutral
SellBuy
Strong sellStrong buy
Strong sellSellNeutralBuyStrong buy
Displays a symbol's price movements over previous years to identify recurring trends.
Frequently Asked Questions
The current price of ANTM is 2,910 IDR — it has increased by 0.34% in the past 24 hours. Watch PT Aneka Tambang Tbk stock price performance more closely on the chart.
Depending on the exchange, the stock ticker may vary. For instance, on IDX exchange PT Aneka Tambang Tbk stocks are traded under the ticker ANTM.
ANTM stock has fallen by −3.32% compared to the previous week, the month change is a −1.36% fall, over the last year PT Aneka Tambang Tbk has showed a 97.96% increase.
We've gathered analysts' opinions on PT Aneka Tambang Tbk future price: according to them, ANTM price has a max estimate of 5,000.00 IDR and a min estimate of 2,500.00 IDR. Watch ANTM chart and read a more detailed PT Aneka Tambang Tbk stock forecast: see what analysts think of PT Aneka Tambang Tbk and suggest that you do with its stocks.
ANTM reached its all-time high on Nov 29, 2007 with the price of 4,450 IDR, and its all-time low was 290 IDR and was reached on Dec 14, 2015. View more price dynamics on ANTM chart.
See other stocks reaching their highest and lowest prices.
See other stocks reaching their highest and lowest prices.
ANTM stock is 1.38% volatile and has beta coefficient of 0.20. Track PT Aneka Tambang Tbk stock price on the chart and check out the list of the most volatile stocks — is PT Aneka Tambang Tbk there?
Today PT Aneka Tambang Tbk has the market capitalization of 69.93 T, it has decreased by −0.68% over the last week.
Yes, you can track PT Aneka Tambang Tbk financials in yearly and quarterly reports right on TradingView.
PT Aneka Tambang Tbk revenue for the last quarter amounts to 13.01 T IDR, despite the estimated figure of 17.05 T IDR. In the next quarter, revenue is expected to reach 25.48 T IDR.
ANTM net income for the last quarter is 1.28 T IDR, while the quarter before that showed 2.57 T IDR of net income which accounts for −50.17% change. Track more PT Aneka Tambang Tbk financial stats to get the full picture.
Yes, ANTM dividends are paid annually. The last dividend per share was 151.77 IDR. As of today, Dividend Yield (TTM)% is 5.22%. Tracking PT Aneka Tambang Tbk dividends might help you take more informed decisions.
PT Aneka Tambang Tbk dividend yield was 9.95% in 2024, and payout ratio reached 100.00%. The year before the numbers were 7.51% and 100.00% correspondingly. See high-dividend stocks and find more opportunities for your portfolio.
As of Dec 7, 2025, the company has 3.73 K employees. See our rating of the largest employees — is PT Aneka Tambang Tbk on this list?
EBITDA measures a company's operating performance, its growth signifies an improvement in the efficiency of a company. PT Aneka Tambang Tbk EBITDA is 10.19 T IDR, and current EBITDA margin is 7.81%. See more stats in PT Aneka Tambang Tbk financial statements.
Like other stocks, ANTM shares are traded on stock exchanges, e.g. Nasdaq, Nyse, Euronext, and the easiest way to buy them is through an online stock broker. To do this, you need to open an account and follow a broker's procedures, then start trading. You can trade PT Aneka Tambang Tbk stock right from TradingView charts — choose your broker and connect to your account.
Investing in stocks requires a comprehensive research: you should carefully study all the available data, e.g. company's financials, related news, and its technical analysis. So PT Aneka Tambang Tbk technincal analysis shows the sell today, and its 1 week rating is neutral. Since market conditions are prone to changes, it's worth looking a bit further into the future — according to the 1 month rating PT Aneka Tambang Tbk stock shows the buy signal. See more of PT Aneka Tambang Tbk technicals for a more comprehensive analysis.
If you're still not sure, try looking for inspiration in our curated watchlists.
If you're still not sure, try looking for inspiration in our curated watchlists.