Trade ideas
Stock BBCA Hi all,
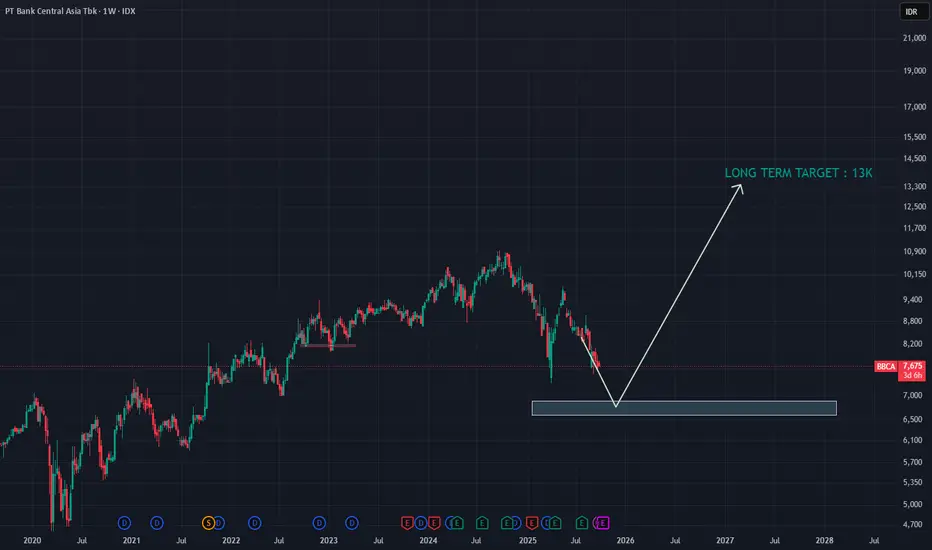
Just an idea..
for BBCA sangkuters & longterm holders..
Maybe if you have extra cash, can make entry to strong support around 6.6-7k..
Then you can hold for another 2-3 years..
your extra longterm target would be 13k..
Have a nice day..
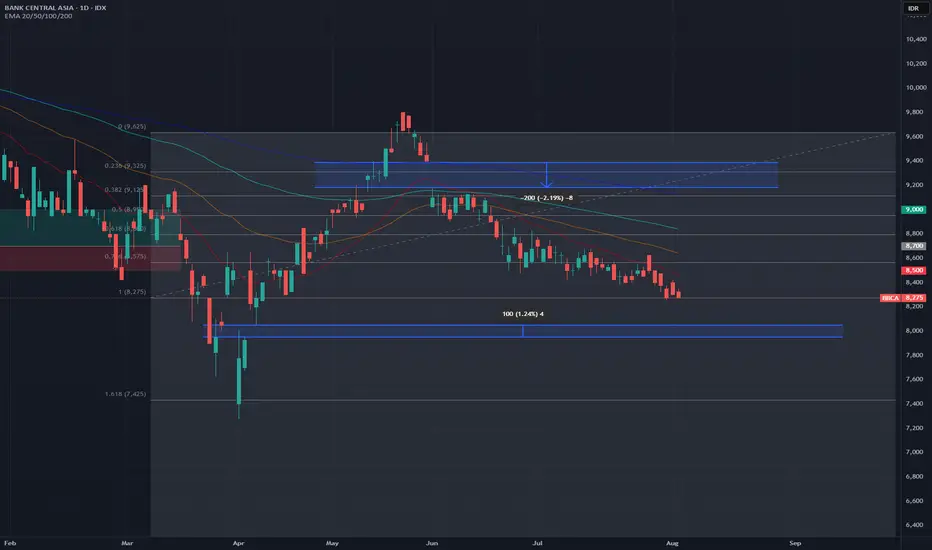
BBCAShort Term: There is a chance of a rebound to the 8,400 – 8,600 area if the 7,800 support holds.
Medium Term: As long as the price has not broken through and remains above 9,000, the trend is still likely to decline.
Important Levels:
Support: 7,800 – 7,600
Resistance: 8,600, then 9,600 – 10,000
Strategy
Aggressive traders: Can try to enter near support (7,800 – 8,000) with a target of 8,400 – 8,600, stop loss below 7,600.
Conservative traders: Wait for the price to break through and stay above 9,000 to confirm a reversal.
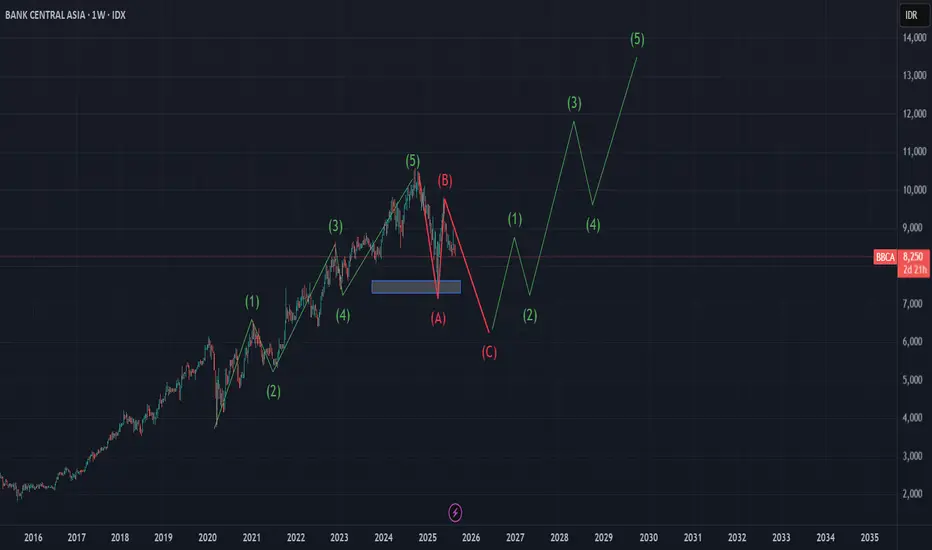
BBCA Elliott Wave Analysis: A Potential C-Wave Correction BeforeBased on a technical analysis using Elliott Wave Theory on the weekly timeframe, BBCA stock appears to have completed a significant 5-wave impulsive cycle (a major bullish run) since its 2020 lows. Currently, the price is in an A-B-C corrective phase, which is a natural occurrence after a strong uptrend. The projection suggests a potential for further downside to complete Wave C before initiating the next major bullish cycle.
Detailed Analysis
1. Completion of the Impulsive Cycle (Waves 1-5)
The chart shows a very clear 5-wave upward structure (marked with green numbers (1) through (5)), which peaked around early 2024. This indicates that BBCA's primary trend over the last few years has been exceptionally strong (super bullish).
Wave (1) & (2): The beginning of the uptrend.
Wave (3): The longest and strongest upward wave, reflecting high market optimism.
Wave (4): A healthy correction that did not fall below the peak of Wave (1).
Wave (5): The final push higher that created a new All-Time High, often accompanied by market euphoria.
2. The Current Corrective Phase (Waves A-B-C)
After a 5-wave impulse is complete, the market naturally enters a corrective phase, typically consisting of three waves (A-B-C).
Wave (A) : The initial sharp decline from the all-time high. This was the first signal that the uptrend is taking a "rest."
Wave (B) : A temporary rebound that failed to break the previous high (the peak of Wave (5)). This often acts as a bull trap, where the market appears to be resuming its uptrend but is actually just making an upward correction before continuing down.
Wave (C) : This is the final downward leg of the corrective phase. Based on the projection on the chart, Wave C has the potential to bring BBCA's price down further towards a strong support area.
3. Target Projection and the Next Cycle
Wave C Downside Target: The area marked by the blue rectangle represents a potential demand zone. Technically, this area aligns with the low of the previous Wave (4), which is in the price range of IDR 7,000 - IDR 7,500. However, a deeper projection as shown in the drawing (towards the IDR 6,000s) is also possible if selling pressure is strong enough.
The Next Bullish Cycle: Once this A-B-C correction is complete, Elliott Wave Theory suggests that BBCA is poised to begin a new 5-wave impulsive cycle to the upside. This opens up a very attractive long-term investment opportunity from a lower price point, with targets exceeding the previous all-time high in the coming years.
Key Levels to Watch
Strong Support (Potential Buy Zone): IDR 7,000 - IDR 7,500. Pay close attention to the price action if it enters this zone. Reversal signals such as bullish divergence or positive candlestick patterns could provide early confirmation that Wave C is ending.
Key Resistance (Scenario Invalidation): The peak of Wave (B) around IDR 9,800 - IDR 10,000. If the price manages to break above this level, this A-B-C corrective scenario would likely be invalidated or would have finished earlier than expected.
Conclusion
In the short term, investors and traders should be aware of the potential for further weakness in BBCA as it moves to complete Wave C. However, this weakness could present a golden opportunity for long-term investors to accumulate. Monitoring the price reaction in the key support zone will be a prudent strategy to potentially catch the beginning of the next major bullish trend.
BBCA - Strong weekly candleBBCA finish this week with strong bullish candle and nice inflow with accumulation.
This week BBCA will face Daily key level at 9900 and potentially BBCA will turn back to Weekly key level at 9300 then bounce back to next Weekly key level 10400.
Other scenario is BBCA will break Daily Key level 9900 and hit Weekly key level at 10400 and turn back to Daily key level (Res become Support) and then continue bounce back to bullish run.
Goodluck!

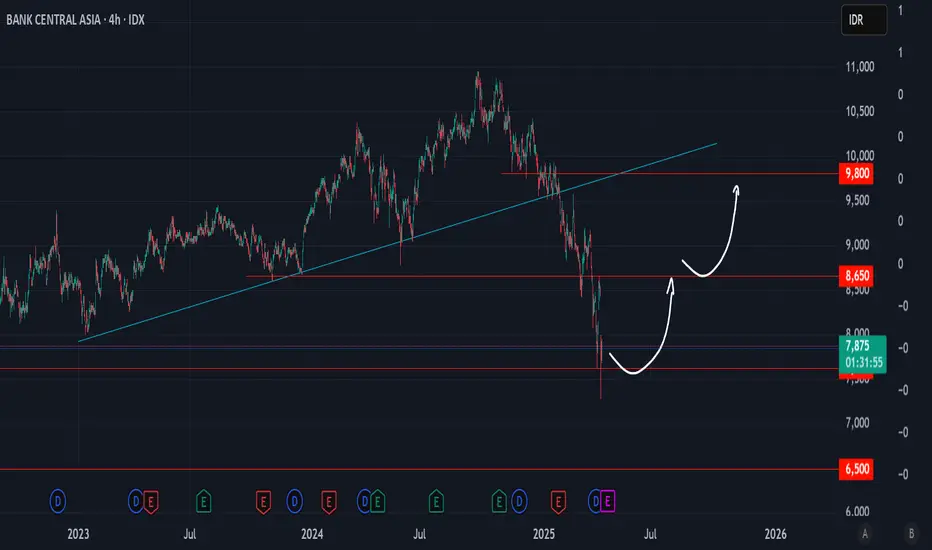
BBCA One of the best timesOne of the best times to buy blue chip stocks from Indonesia which is currently discounted 30% from ATH
Quite simple, if it breaks and closes below 7600 then the bearish trend will continue and maybe we will meet 6500, but if 7600 is strong then we will likely push up with the first target at 8600 then 9800
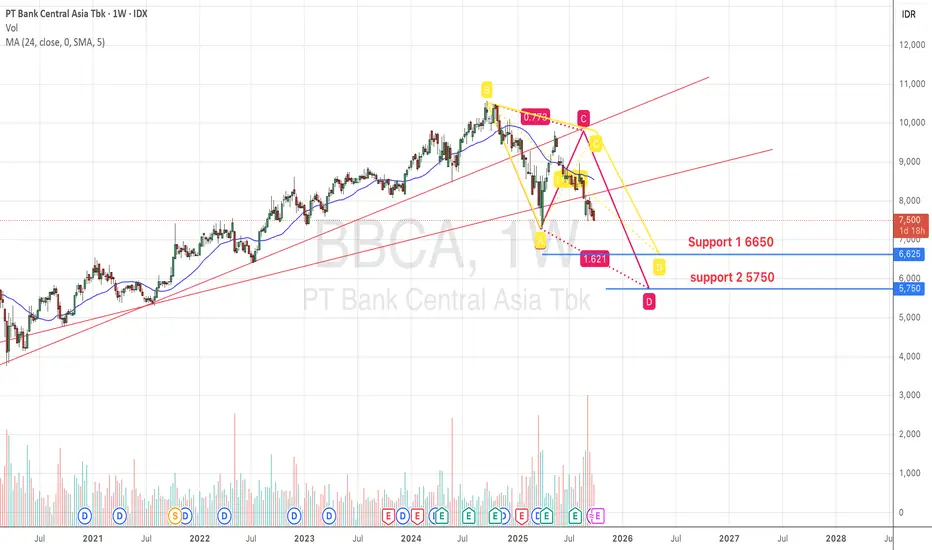
BBCACurrently BBCA still in bullish trend, I see BBCA will potential correction. If BBCA correction will going to :
support 1 6500
support 2 5500

BBCA My Personal Investment LevelIndonesan BBCA share, personally I'll only start to look for buy while price below 8775. Below 8775 would be ideal for investment.

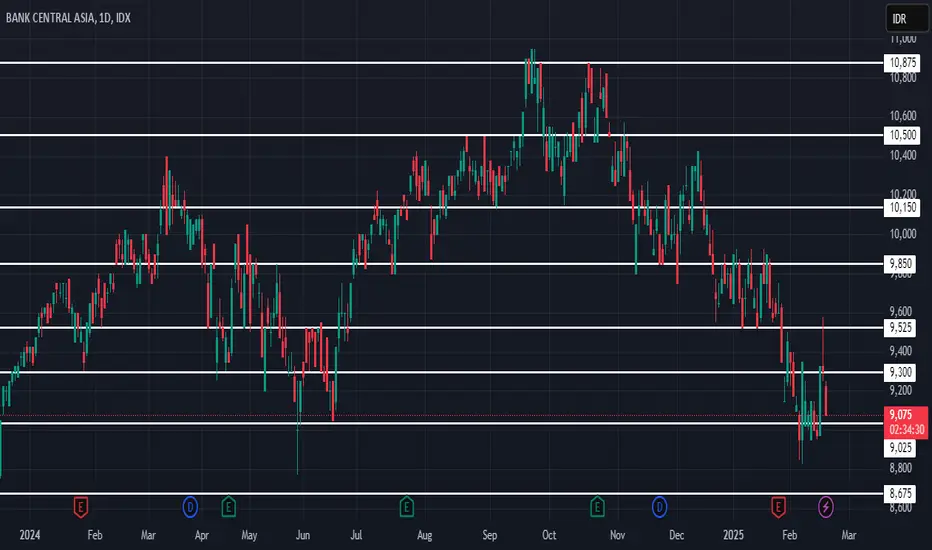
Technical Analysis BBCASupport Levels:
8,675 (Major Support)
9,025 (Minor Support, currently being tested)
Resistance Levels:
9,300 (Nearest Resistance)
9,525 (Next Resistance)
9,850 (Main Resistance in the Short Term)
Trading Plan
1. Buy Area (Entry Point):
Aggressive Buy: 9,025 – 9,100 with a target of 9,300 – 9,525.
Conservative Buy: 8,675 if the price breaks down from 9,025.
2. Sell Area (Take Profit):
TP1: 9,300 (first resistance)
TP2: 9,525 (second resistance)
TP3: 9,850 (if the trend starts turning bullish)
3. Stop Loss (SL):
If the price drops below 8,900, exit to minimize risk.
Posting for FUNSince I am in my free time, .. I'm checking on some local stock market..
This time is BBCA,
The long term idea on the trend might rest for a while around 8200-8500, before continuing it s uptrend. Since nothing go up forever.
Well, not a trading advise though, as me myself is not holding on this stock (because running tooo slooow xD)
IF im right, it will be a great timing for long term investors to add more investment in it..
Thank you and have a happy trading day!

BBCA (VCP - 26W 19/3 3T)IDX:BBCA - VCP
18-09-2024
Reason:
1. Low risk entry point
2. Volume dries up
3. Confirmed Stage 2
4. Price above MA 50 > 150 > 200 over 10 weeks
5. Price is within 25% of 52 weeks high
6. Price is over 30% of 52 weeks low
7. 200 day MA trending up over 1 month
Flaws:
1. RS rating less than 70
2. 5 biggest marketcap
3. No big volume on breakout

only up if break 10900 target 12200If we look at the news from 10/23/24, BCCA has an upward trend. If we look at it now, there is little chance of a double top.

#BBCA trade ideaprice is at support, wicked below, can go for one more wick close to S1, can be good short term trade, for higher levels need to break above orange zone

BBCA IdeaYesterday BBCA was down to 9200! i was confused neither hold nor buy more hahaha.
So i decided to buy more BBCA at 9225, base on my chart if BBCA go to 9300-9400 it is time to buy more in my opinion.

BBCA 5 APRthe last BBCA map already closed BEP (-0%)
yesterday price closed above 9775
this chart is 2nd try with new buy area.
remember that at this time, the wave already create new LowerLow means the risk is higher.. do your MM
or wait when the price near 9300 or above 10100 area if you dont want to take risk at current position.
Buy area 9775 ~ 9625
Price under 9575 = CL BEP or 9700
risk still the same, lower TL and SBR higher TF 9350 ~9200

BBCA 2 Apr '24Follow the trend, positive news
Buy 9800 ; 9750
If price D1 closed bellow 9600 = Cutloss 9775 and wait for confirmation for price to get above 9775
Tmax at extend fib 10650
Risk: high Tf pattern and RBS 9350~9200


Applying Technical Analysis in multiple time frames: $BBCA• Monthly
- Trend and momentum using Joe Rabil Method:
a. Uptrend since price continues making HH & HL. Price is above 18-month MA and 40-month MA; 18-month MA is rising and above 40-Month MA.
b. MACD shows improvement
- Elliot Wave Method: -
- Harmonic Trading Method: -
• Weekly
- Trend and momentum using Joe Rabil Method:
a. Uptrend since price continues making HH & HL. Price is above 18-week MA and 40-week MA; 18-week MA is rising and above 40-week MA.
b. MACD is rising as per price
- Elliot Wave Method: -
- Harmonic Trading Method: -
• Daily
- Trend and momentum using Joe Rabil Method:
a. Uptrend
b. Mapping: pinch setup for pullback. If this fails, will monitor price action when MACD is close to 0-line.
- Elliot Wave Method: 5 waves are up.
- Harmonic Trading Method: Price touches PRZ of bearish crab.
• 1H
- Trend and momentum using Joe Rabil Method:
a. Price breaks down its uptrend line.
b. 18-1H MA crosses down below 40-1H MA and both are down
c. Mapping: pullback and currently in presumptive downtrend
- Elliot Wave Method: Mapping AB – (C)
- Harmonic Trading Method: -
This analysis is made to track my TA's learning progress; my note: Target based on Elliot Wave and Harmonic Trading Methods is achieved in daily TF and 1H TF shows a different trend.

BBCA potential Cup&Handle pattern completionBBCA price reverse strongly and on track to complete the potential Cup&Handle pattern.
Strategy for Indonesia's 4 big banks is only buy buy and buy....


BBCA: Navigating Correction with Strategic Entry Points for PoteIn this analysis, we delve into the recent movement of BBCA stock, particularly observing a noticeable gap around the 8500 level on September 22-23. The common market tendency to fill such gaps implies a potential downturn for BBCA shares.
Navigating the potential downturn, Fibonacci retracement analysis identifies 8525 or the 0.618 level as a strategic point for considering purchases. This zone often becomes a focal point for traders seeking buying momentum, especially in proximity to the golden ratio.
Risk management takes center stage in this context. By setting a stop-loss at 7975, traders can shield themselves from significant potential losses. This restriction is designed to ensure that losses do not exceed predetermined limits, aligning with individual risk tolerance.
As the journey unfolds, bullish confirmation around 8525 becomes pivotal for making buying decisions. This may involve technical signals indicating potential reversals, validating the purchasing strategy at predetermined levels.
Looking ahead, the target price of 10900 or the 1.618 Fibonacci retracement level provides perspective on potential upswings after a corrective phase. This becomes a focal point where traders may contemplate taking profits or adjusting their trading strategies.
In conclusion, this approach reflects a profound understanding of market dynamics and wise risk management practices. Professional traders remain vigilant to changes in market conditions, basing their decisions on in-depth analyses and carefully formulated plans.

