NASDAQ trade ideas

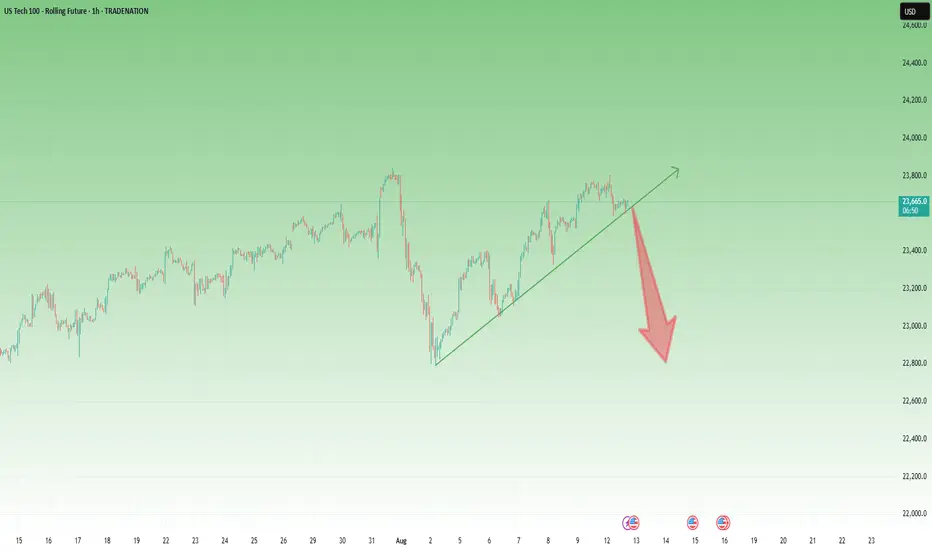
NASDAQ eyes 24300 as the Channel Up extends.Nasdaq (NDX) has been trading within a 3-month Channel Up since the May 12 candle. Throughout the whole time, the 1D MA50 (blue trend-line) has been in firm Support and right now the pattern is unfolding its latest Bullish Leg.
The last two rose by +6.67%, so that gives us a Target of 24300 by the end of the month.
Notice also that the 1D MACD is about to form a Bullish Cross. The previous one was a strong buy signal during the most recent Bullish Leg.
-------------------------------------------------------------------------------
** Please LIKE 👍, FOLLOW ✅, SHARE 🙌 and COMMENT ✍ if you enjoy this idea! Also share your ideas and charts in the comments section below! This is best way to keep it relevant, support us, keep the content here free and allow the idea to reach as many people as possible. **
-------------------------------------------------------------------------------
Disclosure: I am part of Trade Nation's Influencer program and receive a monthly fee for using their TradingView charts in my analysis.
💸💸💸💸💸💸
👇 👇 👇 👇 👇 👇

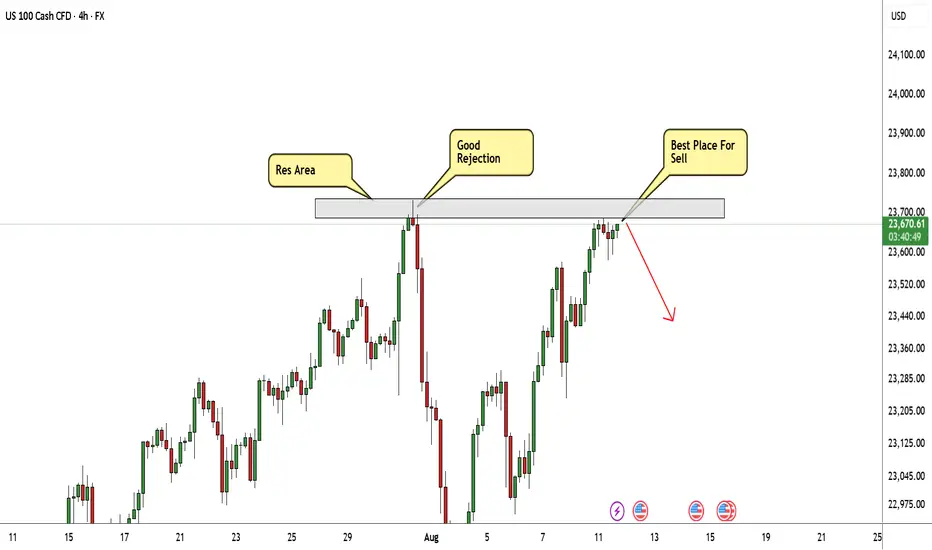
NASDAQ At Good Res , Is It A Chance To Sell To Get 200 Pips ?Here is my 4H Nasdaq Chart and my opinion is the price at very interesting selling area for me , and we have a very clear bearish price action and this Res Area forced the prices to go down Very hard and i think this Second Touch will be the best one , so i`m waiting selling this pair now and targeting from 100 to 200 pips . the only reason to cancel this idea if we have a clear daily closure above my res area .
Entry Reasons :
1- Clear Res Area .
2- Second Touch For The Res .
3- Bearish Price Action .
US100 BUY OPPORTUNITY Price is trading at a pullback support. From the technical standpoint, I anticipate bullish price action to develop away from that level. Couple of hours ago, we’ve seen a consolidation around that area. Therefore, a buy opportunity is envisaged from the current market price.

US 100 – US CPI in Focus, Could this Be Moving Day? Technology stocks in the US 100 have been leading the resurgence of US assets back up from their April lows for a while now, driven higher by fresh demand for magnificent 7 stocks, artificial intelligence capital expenditure and increased expectations for Federal Reserve (Fed) interest rate cuts, which its hoped by traders will restart again when the Fed have their next rate decision meeting on September 17th.
Dips in the US 100 have remained shallow, with the latest blip lower, caused by a weaker than expected US Non-farm payrolls report, causing a sell off from the record high set on July 31st at 23730 down to a low at 22678 (Payrolls Friday August 1st) before the uptrend resumed again, setting a new record closing high at 23660 on Friday since when prices have consolidated so far this week between 23500 and 23716.
Today could potentially be moving day for US 100 stocks with the latest US CPI release due at 1330 BST. Traders are very sensitive to US inflation updates right now as they await the effects of President Trump’s trade tariffs to feed through into higher consumer prices. US corporates initially absorbed the higher tariff costs which has helped to shield US consumers but there has been signs that this trend may be starting to change.
Any deviation in today’s US CPI release from market expectations may alter the current pricing for Fed rate cuts across the next 6 months, which could have an outsized impact on US 100 volatility across the remainder of this week.
Technical Update: Is the Trend Still Your Friend?
When an asset gains fresh buying support and approaches a previous all-time price high, it can be a very important period for both price action and traders. It can lead to the question being asked.
Will buying pressure be strong enough to break above this important resistance and extend the bullish trend, or will sellers re-emerge at the all-time high, triggering a potential reversal in price?
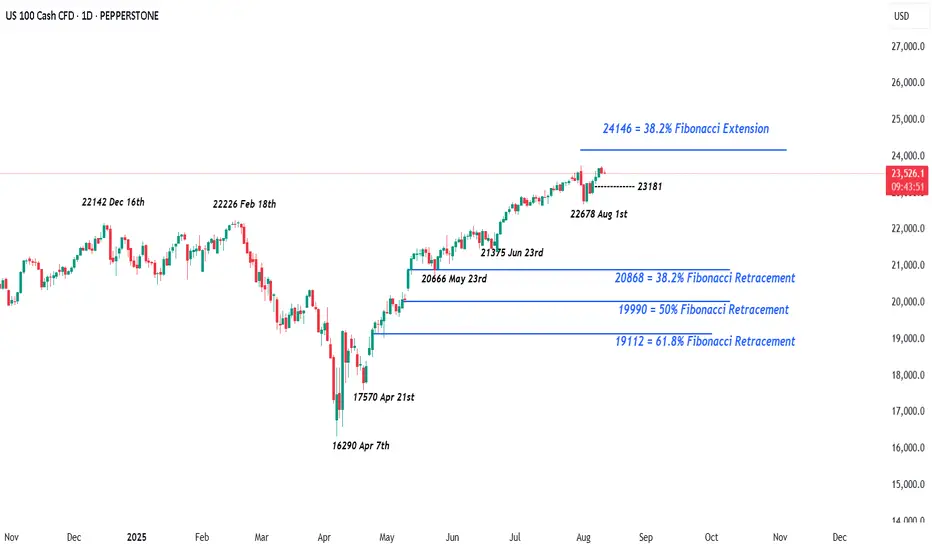
This appears to be the backdrop unfolding for the US 100 index, and as the chart above shows, having seen price weakness briefly post the August 1st low at 22678, the latest price strength since that dip is currently testing 23730 again, the all-time high registered on July 31st.
This 23730 resistance level could be an important focus for traders this week, as successful closing breaks above the all-time high are required to suggest potential for a more sustained phase of price strength, while failure to close above this 23730 resistance level, may lead to increased possibilities for deeper declines in price.
Potential Upside If a Closing Break Develops Above 23730:
If, and it could still be argued it is a big ‘if’, a successful closing break develops above 23730, it could open potential for further price strength towards the next resistance at 24146, which is equal to the 38.2% Fibonacci extension of the July 31st to August 1st price weakness, may be even further.
Potential downside If the Resistance at 23730 Holds:
It is equally possible, the resistance at 23730 can cap the current strength, even prompt fresh selling pressure to turn price activity lower for a phase of weakness.
While 23730 continues to limit current price strength, the focus may shift to possible support at 23181, which is equal to half the August price strength. Closing breaks below 23181 could potentially be a catalyst for further declines to test 22678, the August 1st low, and even lower if this level in turn gives way.
The material provided here has not been prepared accordance with legal requirements designed to promote the independence of investment research and as such is considered to be a marketing communication. Whilst it is not subject to any prohibition on dealing ahead of the dissemination of investment research, we will not seek to take any advantage before providing it to our clients.
Pepperstone doesn’t represent that the material provided here is accurate, current or complete, and therefore shouldn’t be relied upon as such. The information, whether from a third party or not, isn’t to be considered as a recommendation; or an offer to buy or sell; or the solicitation of an offer to buy or sell any security, financial product or instrument; or to participate in any particular trading strategy. It does not take into account readers’ financial situation or investment objectives. We advise any readers of this content to seek their own advice. Without the approval of Pepperstone, reproduction or redistribution of this information isn’t permitted.
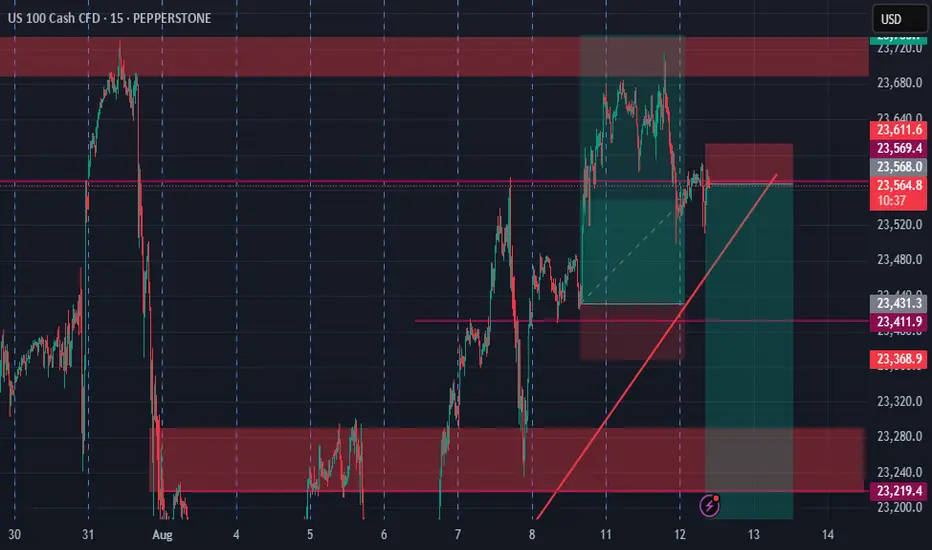
NASDAQ Index Analysis (US100 / NASDAQ)The index is moving within an upward channel in the broader trend and is currently trading near the 23,550 area, which is a pivotal zone between two possible scenarios:
🔻 Bearish Scenario:
If support at 23,500 breaks and holds below this level, we could first see a decline toward 23,400, followed by a potential drop to the 23,290 test zone.
Breaking this level may open the door for further downside corrections.
🔺 Bullish Scenario:
If the price successfully breaks and holds above 23,680, this could support a continued rally toward 23,800, and with sustained momentum, the market may target a new high.
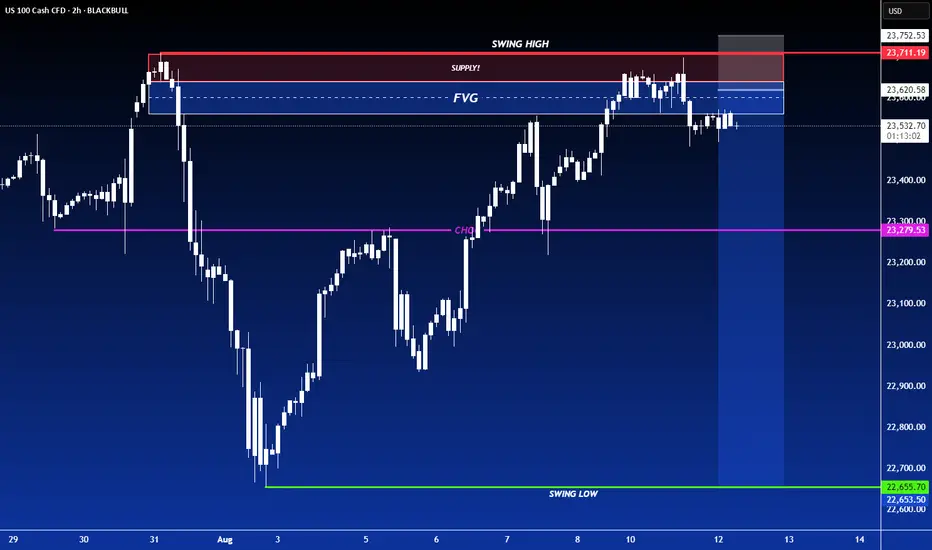
SHORT ON NAS100NAS has retested a major supply zone after a nice CHOC (Change Of Character)
I will be selling NAS looking to catch over 800-100 points.
DXY (USD) CPI economic news will also be a catalyst to more this trade this morning after 8:30am.
USNAS100 | CPI Day Setup – Breakout or Pullback Ahead?USNAS100 Overview
Markets found some relief after the U.S. and China extended their tariff truce until November 10, avoiding the imposition of triple-digit duties on each other’s goods.
Today, attention is firmly on the U.S. CPI release, which is expected to drive market direction:
A reading above 2.8% would likely support a bearish move toward 23440 and 23295.
A reading below 2.8% could fuel bullish momentum toward a new ATH at 23870.
Technical Outlook:
As long as the price trades below 23690, downside targets remain 23440 and 23295.
A 1H close above 23695 would turn the bias bullish toward 23870.
Support: 23440, 23295, 23045
Resistance: 23700, 23870

Nasdaq and S&P500 Short: Completed 5-wave structureIn this video, I explain my analysis of the Nasdaq and S&P 500 chart together with Gold (the risk-off indicator).
I point out 3 main reasons why I labelled the 5-wave structure as W-X-Y-X-Z instead of 1-2-3-4-5:
1. Wave 3 overlaps Wave 1.
2. 5th Wave did not make new peak.
3. Gold structure still supports a 5th Cycle level wave higher.
Regardless of how confident we are, remember to set your stop and respect it.
Good luck!

NASDAQ TP Adjusted for ShortingNow it is very clear that price will likely fall beyond my initial TP. So if you took the trade yesterday hold it for much longer. And don't let CPI intimidate you.

US100 – Dark Cloud Cover Signals Possible Reversal AheadAfter the drop to 22,800, NAS100 recovered strongly and yesterday retested the recent ATH in the 23,800 zone.
However, by the close of the trading day, the index erased the entire intraday advance and closed in the red – leaving a Dark Cloud Cover candlestick formation on the daily chart.
As explained in my previous analysis, I believe the US indices are ready for a deeper correction after the incredible run-up since April.
Technical Outlook:
• The US100 is still holding above its recent ascending trend line.
• A confirmed break below this trend line could trigger an acceleration in selling pressure.
• The first downside target for bears is the recent low at 22,800.
• In the medium term, if a full reversal unfolds, I would not be surprised to see the index trading near 20,000 within the next 2–3 months.
The market has been on an extraordinary bullish streak, but this candle formation combined with extended price action could be the first sign that momentum is shifting.
Disclosure: I am part of TradeNation's Influencer program and receive a monthly fee for using their TradingView charts in my analyses and educational articles.
NAS100 Sell Trade PlanThe market is showing a lower high formation on the 1H chart, indicating potential bearish continuation. Entry is planned at 23,481.2, with a stop loss at 23,584.6 to protect against upside breakouts. The first target (TP1) is set at 23,363.8 to secure partial profits, and the second target (TP2) is at 23,275.0 for extended downside potential. RSI is currently below the 50 level (44.70), supporting bearish momentum. Risk-to-reward ratio favors the setup, aligning with the recent downtrend structure.

US100 SHORTI see a short on Nas100 ahead of US CPI but we can monitor closely and keep those small positions. THE MARKET MIGHT BE VERY VOLATILE
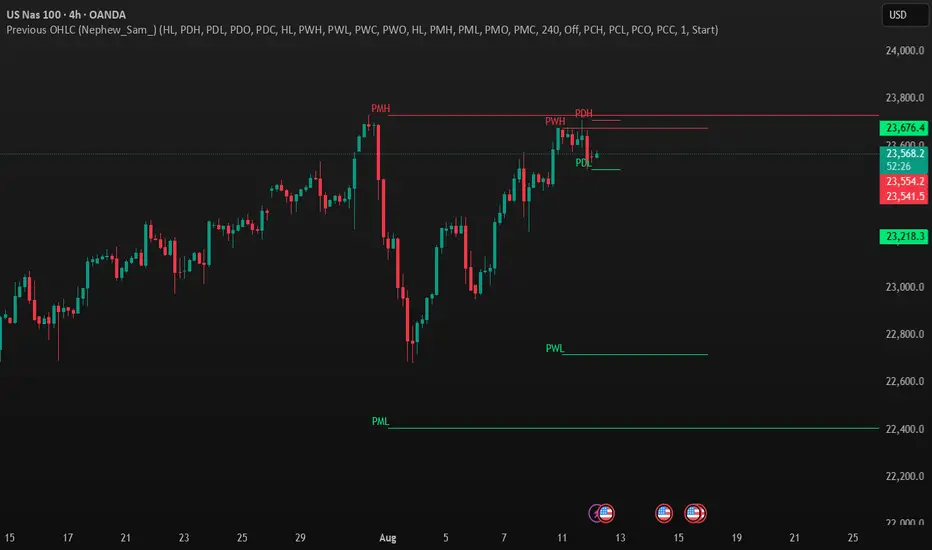
"NAS100USD – Bearish Reversal Setup Forming Below PDH with Key SOn the 4H timeframe of the NAS100USD index, after registering a new high around the **PMH** zone, price faced strong resistance near **PDH** and has recently formed a **Lower High (LH)** and **Lower Low (LL)** pattern. This behavior, along with repeated rejections from the 23670–23710 area, indicates weakening bullish momentum and the potential start of a short-term correction or pullback.
The **PDL** level currently acts as a key short-term support; a confirmed break and close below this level could open the path toward the significant support at **PWL**, followed by the 22940–23218 zone.
From an indicator perspective, decreasing volume near the top, combined with rising volume on recent bearish candles, confirms stronger selling pressure. The overall market structure, after the recent sharp bullish wave, is now in a time–price correction phase that may lead to the breakdown of these supports.
Therefore, if **PDL** is decisively broken, a short entry with a stop-loss above **PDH** and targets in the mentioned zones is the preferred scenario; however, sustained trading back abovEntry: sellstop @ 23,540.00 | Asset=NAS100USD | Side=Sell
SL: 23,676.00
TP1: 23,218.00
TP2: 22,940.00
Conf: 81%
NAS100 at mjaor resistance area Fib 0.5Price has reached the 0.5–0.382 Fibonacci retracement zone of the recent swing. If the bears are strong, we may see a rejection toward the trendline support. However, if this resistance is broken, a bullish continuation is also possible. Let's see how it plays out.

NASDAQ Short This is at the all-time high, showing a lot of resistance
There is an AABCD pattern on H1
All timeframes are overbought
There are multiple tops on M15 and M30 with divergence
Stop loss of 150 pips

US100 SHORT-TERM SELLPrice formed a triple top reversal pattern which signal’s possible correction from the high. Therefore, a sell opportunity is envisaged from the current market price. Target profit is 23508


Nasdaq Index Analysis (US100 / NASDAQ)The index is currently trading near $23,670, a pivotal zone between two possible scenarios:
🔻 Bearish Scenario:
If the support at $23,570 is broken and the price holds below it, we may see a decline first toward $23,400, followed by an extended move toward $23,290 as a test area. A break below this level could open the door for further downside corrections.
🔺 Bullish Scenario:
If the price successfully breaks and holds above $23,680, this could support a continuation of the uptrend toward $23,800, and with sustained momentum, a new high could be targeted.
⚠️ Disclaimer:
This analysis is not financial advice. Please monitor market behavior and analyze data carefully before making any investment decisions.
US100 Bullish Momentum Targets AheadThe US100 shows strong bullish structure after completing an ABCD correction, with price eyeing a potential move towards the 1st target at 23,791 and possibly the 2nd target at 24,053. A brief pullback may precede the continuation towards these key resistance levels.
1. Current Structure
The chart follows an ABCD pattern after a strong bullish impulse from the early August lows.
Points A–B–C–D suggest a completed correction phase, with momentum now shifting upward.
Price is currently around 23,629, approaching the first resistance zone.
2. Key Levels
Immediate Support: ~23,500 (recent swing low, short-term demand zone)
1st Target: 23,791 (minor resistance, potential profit-taking zone)
2nd Target: 24,053 (major resistance, psychological round area)
Major Support: 23,200 (break below here could invalidate bullish momentum)
3. Price Action Expectation
Short term:
A small pullback toward 23,500–23,550 is possible before continuing upward (healthy retracement to build buying pressure).

USNAS100 | Consolidation Before CPI –Breakout or Pullback Ahead?USNAS100 Overview
The index reached its all-time high ahead of recent speculation about a potential Fed rate cut. This week’s CPI data will be a key driver, indicating whether the Fed may cut rates in the near term.
Technical Outlook:
As long as the price trades below 23640–23690, a decline toward 23530–23435 is expected. A break below this zone could extend the drop toward 23295.
A 1H close above 23695 would turn the outlook bullish, targeting 23870.
Support: 23535, 23435, 23295
Resistance: 23870, 24040
previous idea:

NAS100 Bearish Correction/Third touch of Support trendlineA correction to the downside and a third touch of the trendline will provide more opportunities to go long. However, confirmations to short are looking strong right now.
