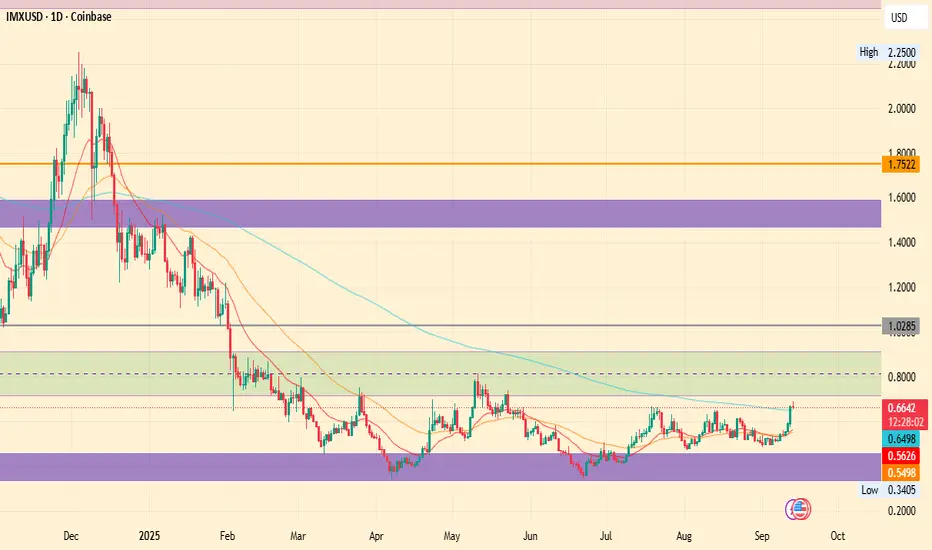
IMX headed for $1 in september but higher in Q4Technically, SEED_DONKEYDAN_MARKET_CAP:IMX just broke key resistance and is showing strong momentum. All signs point to more upside ahead.
We can see gain here upto 50%+ around $1
IMXUSD.P trade ideas
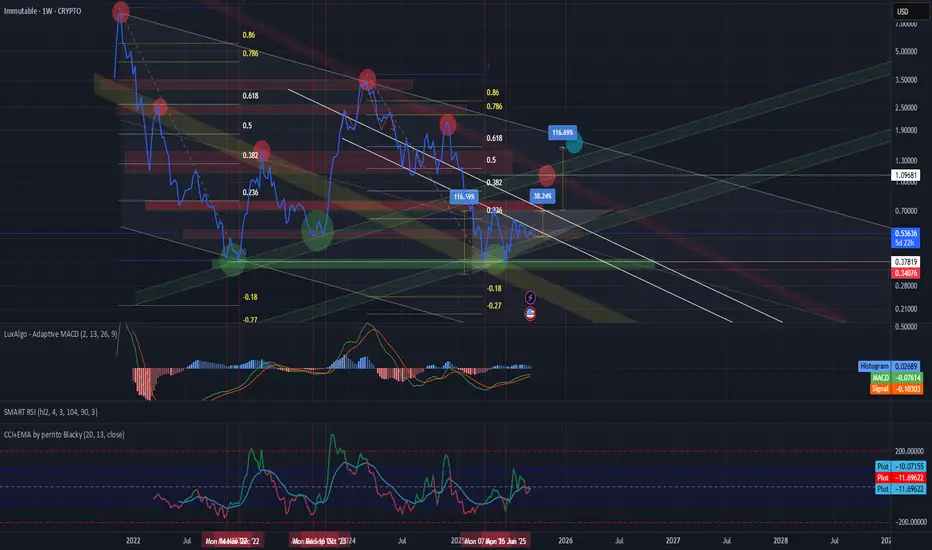
Immutable (IMX) IMXUSD 3-day and 1-week TFAs is ABSOLUTELY always the case, the time comes when a previous high becomes the new low — and this coin is no exception.
Pay attention to the yellow channel: every reversal has been marked by two key points, just like the current one — highlighted with green circles.
A potential inverted triangle with a right angle may have formed on the chart, suggesting a move toward the upper boundary of the global descending channel. Percentage targets are indicated.
Key zones are also marked — previous resistance levels that are likely to act as support going forward.
A new channel may already be forming, guiding price toward the outlined targets.
Fibonacci retracement shows confluence around the 0.5–0.618 levels, just like in the previous cycle.
MACD indicates ongoing accumulation, while CCI shows that highs are still far off.
I hope everything is clear.
IMX looks bullish (12H)The IMX pair has hunted a strong origin of movement, which is the key factor behind our bullish outlook on this coin.
After the hunt, this strong origin broke the trigger line, forming a bullish CH on the chart. Now, as the price pulls back toward support zones, we are looking for buy/long positions.
The targets are marked on the chart.
A daily candle close below the invalidation level will invalidate this analysis.
For risk management, please don't forget stop loss and capital management
When we reach the first target, save some profit and then change the stop to entry
Comment if you have any questions
Thank You

IMXUSD - LONG 4x - 12x Return ( Don't Miss This Opportunity) IMXUSD looks like it's setting up for a great long opportunity.
Price has been at this level of $0.60 multiple times over the last 3 years.
Can price go lower? YES
The next level will be $0.20
Target One: $2.60
This is a buy an hold opportunity.
Web3 Gaming - Future of blockchain technology.
Immerse yourself in an uncharted world of Web3 gaming, where creativity and innovation collide. Experience the depth and wonder of Web3 gaming on Immutable and reshape the future of play.

High spec, high reward Eth playI think Eth should show a bottom here around $2000. If that is the case, I expect a strong move up in Eth related Layer 2 coins including the likes of IMX. Posting my swing trade ideas here, buying the VAL and trading this up to the POC and potentially VAH.

A heads-up only if you trade Crypto. Bears r @ the door
Hey, I was going to try not to write anything today, but it seems when you got 'the-bug' its' a bit like overtrading. Hard to stop. But therein is how I trade less without compulsiveness, I write about trading and although some of it is self-serving, most of my writing is not geared that way, but I try to help and provide an occasional good setup to trade. Maybe you realise that by now if you are a regular reader of mine. Maybe not as well.
But a big digress I make, Cryptocurrency positions I sold out of recently, I was heavy in them in my 2 accounts, here is the thing with Crypto, if Bitcoin sells off on a particular day then that may trigger a lot more Crypto's to sell as well. You see, their chart patterns, not all but many will mirror each others'.
For example, the daily chart for BTCUSD is very bearish at the moment. Pull up a daily chart on MACD, I remove the histogram, what you have is a very high MACD line that is well above zero, that is Crossing-down on the Signal line which is also high like the MACD. You know that classic tipping-over bearish MACD image. As far as i'm aware, that's the Daily that needs to be sold very soon unless it stops crossing over and down on the signal line. I will provide an example.
BTCUSD, DOGE, Sol (over 4% off today) and many many other share this weak daily chart at the moment, it is particularly problematic if the weekly chart is the same because it moves slower but the bears have plenty of time to enter over the course of the next week.
Don't get caught out, when Cryptocurrency moves against you, especially if you have multiple different positions all sharing the same bearish chart, well it can put you into a margin call quickly. Theres a mammoth crypto called XRPUSD, guys don't short it because as I found it, it will quickly eat you up because its got a huge margin. Never buy more than 100 at a time as well, because when it moves against you, it will also take you into the red very quickly. Think trading the XAGUSD but 5 x worse.
But here is a Crypto thats chart looks good at the moment. In other words, not overbought. Theres plenty still around to buy, they are generally the smaller ones that have just risen to their 200EMA's on daily.

IMX has another 2x left in the tank before we enter the bear NFA, imx usd holding up well.. can see it go slighty under the april/may high before it goes lower into the bear.

IMX - Bullish SetupI don't see this dropping down to 0.0% Fib. Low risk/High Reward Position on the table.


IMX ON TRACK FOR $5Imx has retracted all the way back to the bottom of the channel which is perfect timing as just after the halving everything is primed to pump for a potential mid year cycle. May-July is about to get interesting, I don’t see how IMX doesn’t touch 5$

Buy ImmutableImmutable is one of my favourite coins for this bull run. Looks like it's ready to be bought again.

Buy Immutable Immutable should be able to make it to roughly a $36bil mkt cap, so it could increase approximately 8x. Right now, it seems like a reasonable entry point.

IMX --- Where is it heading?$7
W pattern
linear target already met
but still there's a double left in it.
(hope some of my followers got into this early and held)

IMMUTABLE X is definitely being added for the next cycle!#GAMING layer 2 technology for #ethereum
already doing volume for Gods unchained and the like.
zero gas technology
I think this will be a winner
"Every time you list an asset with ImmutableX it is instantly distributed to multiple marketplaces
True scale for games
ImmutableX supports up to 9,000 transactions per second, with zero gas fees when you mint, transfer, or trade"

IMX → Immutable Descending Wedge Bullish Pattern. Time to Long?IMX has been in a descending wedge pullback after a three-legged bull run. This appears to be a textbook long setup, but is it?
How do we trade this? 🤔
The long setup in front of us is reasonable, but there are a few data points in our way. What's in favor of a long position is the descending wedge pattern after a three-legged bull run. The pullback has three pushes down with some strong buy bars, signaling upward pressure.
However, we are still below the Daily 30EMA and a distance from the Support Zone top at $1.49 and the Daily 200EMA at $1.35. You can argue that the third bounce off the descending wedge support is out low and we can place our stop loss there, and that is reasonable. I am suggesting exactly that trade is reasonable after a break of the Daily 30EMA and a re-test of the descending wedge resistance as support. The stop loss can be placed below the previous wedge low of $1.70 with a profit target at a 1:1 Risk/Reward Ratio of $2.414.
💡 Trade Idea 💡
Long Entry: $1.990
🟥 Stop Loss: $1.566
✅ Take Profit: $2.414
⚖️ Risk/Reward Ratio: 1:1
🔑 Key Takeaways 🔑
1. Three pushes up in a bull channel.
2. Descending Wedge bullish pattern with three pushes down.
3. Strong bull signal bars on every wedge push.
4. Suggested to wait for a break of Daily 30EMA and a re-test of wedge resistance as support.
5. RSI at 48.00 and above the Moving Average, supports long bias.
💰 Trading Tip 💰
The longer a trend continues after 3 legs, the probability of that trend continuing lessens. Because of this decreased probability, we ought to reduce our risk when entering trades.
⚠️ Risk Warning! ⚠️
Past performance is not necessarily indicative of future results. You are solely responsible for your trades. Trade at your own risk!
Like 👍 and Follow to learn more about:
1. Reading Price Action
2. Chart Analysis
3. Trade Management
4. Trading Psychology

IMX to Reach $5 Soon After Halving DateWelcome to the 2024-25 Bull Run where whatever idea you make will inevitably hit their targets, I used targets from IMX history to map out the next targets eventually leading it to $5

IMX soon to hit 3$IMX has been in a slight dump where others coins are getting a push but this is one of those coins that will go insane this year and soon this will wake up and pump to 3$ easily.

IMXUSD This pull-back is the best buy entry.Immutable X (IMXUSD) has been rising non-stop since the January 23 Low and is now on a new 2 year High! However, the 1D RSI's Bearish Divergence, the entry on the Diagonal Resistance Zone since the June 2022 High, as well as the similarities with the previous Higher Highs formations, call for a short-term pull-back.
As long as that is contained above the 1D MA100 (green trend-line), we will buy it and target the All Time High Zone at 5.000.
-------------------------------------------------------------------------------
** Please LIKE 👍, FOLLOW ✅, SHARE 🙌 and COMMENT ✍ if you enjoy this idea! Also share your ideas and charts in the comments section below! This is best way to keep it relevant, support us, keep the content here free and allow the idea to reach as many people as possible. **
-------------------------------------------------------------------------------
💸💸💸💸💸💸
👇 👇 👇 👇 👇 👇

IMMUTABLEX #IMX to outperform #ETH by 3XCall it a 2024 Prediction
(Based on a technical foundation ofc :))
Simple trading range zone break out
and prediction of using that range to make a new trading range going forward.
You can also spot a W formation
which also would point towards a similar level
Hope you have profitable `24

IMX.usd heads up at 2.65: possible top or at least pullback oppIMX has just hit a key zone around $ 2.65
Confluence of local golden plus a high tf fib.
Previous two sister Goldens caused retreats.
It is PROBABLE that we see a pullback.
It is POSSIBLE that this is a Top for now.
It is PLAUSIBLE that strong bull breaks it.
$ 2.50 below would be first good support.
$ 2.28 below that will be key trend support.
$ 2.87 above would be next major resistance.
=========================================
.

IMX → Immutable Going Into a Nose Dive!? We're Almost There.IMX is deep into its bull trend along with the rest of the crypto market. We have fewer signs of a reversal on this chart compared to others, but many of the same themes are playing out.
How do we trade this? 🤔
We have three pushes to the upside in a bull channel, an RSI at 73.00, and an upcoming Resistance Zone that support the idea of a reversal. However, we're lacking any kind of confirmation. It's reasonable to look at this chart with a bullish bias and prepare for small position long scalps, but I wouldn't be swinging for the fences with a massive long to the upside, not without more price action and show of support to confirm.
One potential trade is to let the price reject from the Resistance Zone and with some confirmation candles closing on or near their lows, take a standard 1:2 Risk/Reward short position.
Until then, it's reasonable to stay on the sidelines until more price action plays out.
💡 Trade Idea 💡
Short Entry: $2.53
🟥 Stop Loss: $3.00
✅ Take Profit #1: $1.58
⚖️ Risk/Reward Ratio: 1:2
🔑 Key Takeaways 🔑
1. Bull Channel, Bias to Long.
2. Three pushes up in a bull trend. Could be near end of Trend.
3. Gap to 30EMA, look for Support.
4. RSI at 73.00 and above Moving Average. Need to fall below Moving Average for short.
5. Bitcoin is running hot to the upside, risk of trend change.
⚠️ Risk Warning! ⚠️
Past performance is not necessarily indicative of future results. You are solely responsible for your trades. Trade at your own risk!
Like 👍 and comment if you found this analysis useful!

IMX screaming "FU" to me is it 2.40 or 3.00 to F**k us? 🤬❓😢Not financial advice.
I will also reference the last time I saw this on BTC when everyone said it was going to 100k it was painting an FU to me. So I will share that chart when I called the top on BTC in 2021.
A chart that is too bullish I've learned over time will start to cuss you and give you and FU for being to bullish.
IMX is showing that to me as well as AVAX ,SOL and a few others
Setting up the typical December dump.
What I can't answer is if the "F" will be 2.40 or will it be 3.00.
Either way it's cussing me that we are too excited.
Just a fun way to play around with the charts.
#PIK
#TLAW
Patience Is Key
Think Like A Whale

IMX - Potential 430% Swing LongJust a late-night brain dump. I've been trading IMX and WOO for the past 6 months almost everyday and noticed they respect my strategy in similar fashion - so i wanted to look for a correlation between their price action.
To my limited FA knowledge, they don't have anything in common at all, but that doesn't matter at all. With fractals, I don't care too much about the internal moves, but mainly pay attention to the swing points. It's pretty straightforward and an easy 430% win at worst if you just sit on your hands for 8-12 months. Could be a lot better if you'd take profit and compound them in between, but sometimes that doesn't end well.
Let's see how that plays out.
