DXY trade ideas

Dollar Bloodbath = Risk On Assets Rally?Dollar Fundamentals:
The dollar posted modest gains on Friday due to higher T-note yields, which have strengthened the dollar’s interest rate differentials.
The University of Michigan US Sep consumer sentiment index fell more than expected to a 4-month low causing the weakening of the dollar.
Limiting the upside in the dollar are the increased expectations for Fed easing through year-end. The dollar is also being undercut by concerns over Fed independence, which could prompt foreign investors to dump dollar assets as President Trump attempts to fire Fed Governor Cook, and by Stephen Miran’s intention to be a Fed Governor.
What Can We Expect Going Forward?
- Due To High Resistance Over Multiple Weeks, There Will Be Massive Levels Volatility, Aiming To Trap The Retail Traders
- Next Week Wednesday Will Determine How Volatile Dollar Will Be. Anything More Than A .25 Basis Point Decline Will Cause Turmoil For Dollar.
- This Will Lead Risk-On Assets (e.g. GBPUSD, EURUSD, AUDUSD) Rallying Up Into Premium Arrays
Prices To Keep An Eye On:
- 99.078 (Last Line Of Defence)
- 96.377 Major Sellside Liquidity
- Medium-Term Draw To 95.716 - 94.313 HTF Array
GBPUSD
Fundamentals :
UK gross domestic product remained unchanged in July after growing 0.4% in June, the Office for National Statistics said, as manufacturing output, which makes up 9% of the economy, dropped by 1.3% on the month.
The BoE is widely expected to keep its benchmark Bank Rate unchanged on September 18, after a split decision to lower the rate to 4% in August.
What To Expect Going Into Next Week?
- Increased Volatility
- Trigger HTF Stop Losses
- Unusually High Levels Of Manipulation
Price Points To Keep A Eye On:
- 1.35950 Buyside Liquidity
- 1.36760 - 1.37036 Longer Term Premium Array
- 1.34458 Mean Threshold (Last Line Of Defence)


SPX PULLBACK SOON?SP:SPX could start pulling back as soon as this monday, TVC:DXY has double bottomed and ready to run up.
SP:SPX mostly go inverse TVC:DXY
will start short position as soon as i get the confirmation.

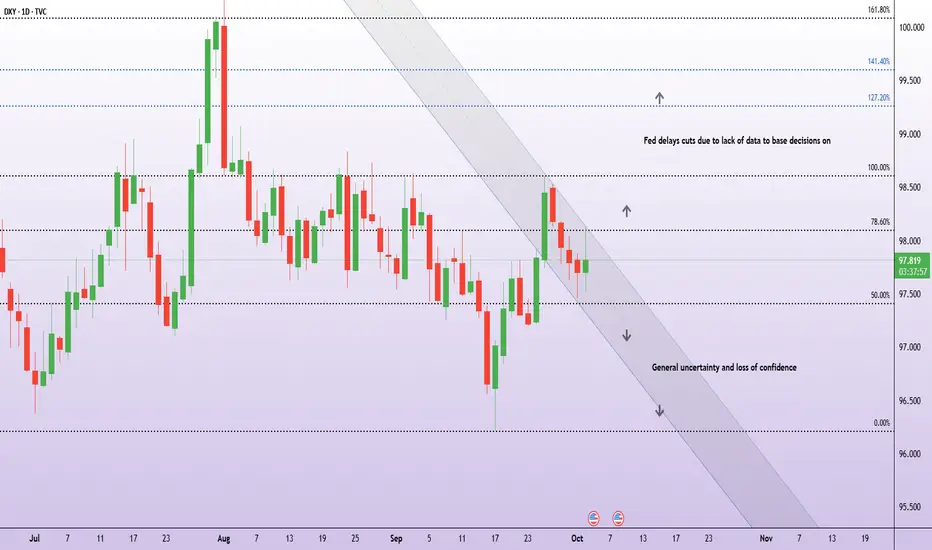
What data releases are at risk from the shutdown? The US dollar came under renewed pressure this week as the federal government entered its first shutdown in nearly seven years.
The shutdown, expected to last at least three days, means traders should not expect the September nonfarm payrolls (NFP) report this week. This key release, often one of the most closely watched on the calendar (by traders and the Federal Reserve), will now be delayed until government operations resume.
Other reports likely to be delayed or canceled include:
Wednesday, 8 October: FOMC Minutes
Wednesday, 15 October: Core and headline CPI inflation
Thursday, 16 October: Producer Price Index (PPI)
Thursday, 16 October: Retail sales
Friday, 17 October: Housing starts

EUR USD and DOLLAR UPDATE
The Dollar Index (DXY) is grinding through a daily order block and has just pierced 97.882.
Technical
If we close above 97.882, that confirms a break and opens continuation toward higher liquidity zones. With tomorrow’s heavy macro news, the setup has volume behind it for a potential massive move.
Macros
U.S. government shutdown is weighing on confidence and trimming growth forecasts (each week may shave 0.1–0.2pp off GDP).
The Fed remains cornered — markets price in rate cuts, but policy credibility is under scrutiny.
Safe-haven flows are mixed: gold at records, dollar stabilizing after Supreme Court support for Fed’s Cook.
Data releases are being delayed by the shutdown, which adds uncertainty and volatility.
EURUSD
We’re short and holding.
4-month rangebound structure remains
Be aware
Dollar strength is being fueled by technical break + macro volume. EURUSD is vulnerable if DXY confirms above 97.882.
But with policy risk and shutdown uncertainty, expect volatility spikes and liquidity hunts around tomorrow’s big data.

Bullish DXYPotential Inverted Head and Shoulders display.
Am very Bullish on USD Index right now and Bearish on most xxx/USD pairs.

U.S. Dollar Index (DXY) OutlookThe U.S. Dollar Index (DXY) is currently in a major corrective structure after topping out in 2022. On the monthly chart, price action suggests we are in the final stages of a Wave II correction, with a potential bottom forming around key Fibonacci retracement levels.
The correction appears to be forming a WXY/ABC structure, with wave c in progress.
Price is currently within the 0.618 – 0.786 retracement zone of the prior impulse.
The long term ascending channel from 2008 lows remains intact, with support aligning around this Fib cluster.
A bullish reaction from this zone could trigger the beginning of Wave III, which historically is strong and impulsive.
Invalidation: Sustained break below 87.00 would weaken the bullish count
Targets:
1 = 132.91
2 = 141.88
If this count holds, DXY could be setting up for a multi-year bullish cycle, suggesting that the dollar may regain strength in the coming years, impacting major USD pairs across the board.
Disclaimer:
This analysis is for informational and educational purposes only and does not constitute financial advice. Markets are dynamic and unpredictable.

DXY: Move Up Expected! Long!
My dear friends,
Today we will analyse DXY together☺️
The recent price action suggests a shift in mid-term momentum. A break above the current local range around 97.331 will confirm the new direction upwards with the target being the next key level of 97.393 and a reconvened placement of a stop-loss beyond the range.
❤️Sending you lots of Love and Hugs❤️
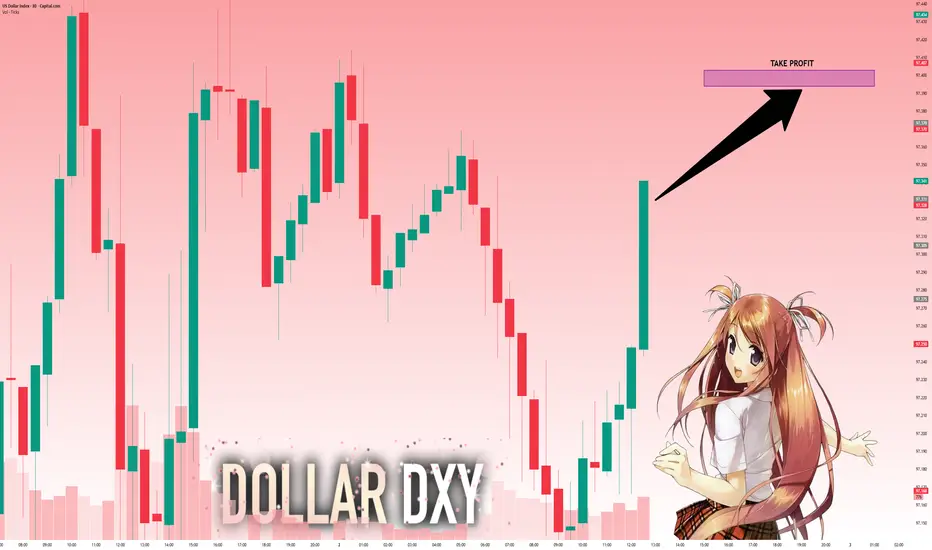
Dxy builds momentum The DXY remains firm in its bullish conception, setting up for a potential projection toward the 101.000 level. This reinforces sustained dollar strength as market structure aligns with bullish momentum.

1:1 GUSmall reversal area based off previous lows, momentum to the downside but this might work out as a mini retracement.

DXY in rangedxy strugling (september open /october open) levels above that is 38.2% fib from sep high also psychological level 98 with 50day moving average and 100 MA above them , in downside level 97.5 acted as support today, what do you think considering government shutdown?

My USD analysis 1st of October 2025I made a very long sophisticated USD post but it was taken down (thanks tradingview <3) where I called long on USD. My reason was just pure technical and how it was at a support range. I think there is still more upside despite the drama that's happening around the USD. I would wait for a retest at the support then make an attempt to go long. This might potentially be a formation of a double bottom. Gold and Silver skyrocketing, but I believe there is so much potential for USD.

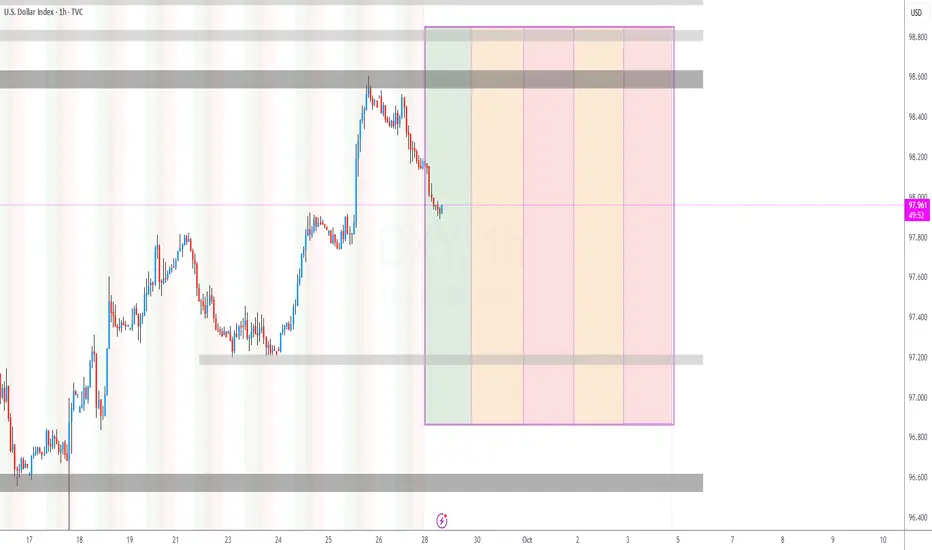
US DOLLAR LIQUIDITY GAMES🇺🇸 US Dollar Range Politics – Liquidity Before Clarity
The dollar isn’t trending — it’s negotiating.
📊 Current Setup
U.S. Dollar Index (DXY): 98.322 → testing the value area high
Range Floor: 96.747 → the value area low
Structure: Bearish range, with liquidity being hunted before any true direction emerges.
🏛️ Macro Backdrop
Tariffs are reshaping global flows.
Fiscal gridlock + shutdown risk clouds investor confidence.
Inflation + Fed policy signals remain mixed.
Every headline feels like an amendment to a bill no one fully understands.
The result: the dollar drifts sideways in a liquidity-seeking phase. Traders should expect chop inside the box until a decisive catalyst (data, Fed action, or policy shift) provides clarity.
🌍 Cross Pair Impact
This stalemate spills into the majors:
EURUSD & GBPUSD → reflecting the same sideways ranges and fake-outs.
USDJPY → volatility compressed, waiting for dollar direction.
Crosses are trading in sympathy — liquidity hunts on both ends, with no clean trend until DXY escapes its range.
🧭 Takeaway: The dollar is boxed in by politics and policy. Patience rules here: trade the range, wait for the breakout.

Dollar Index analysis at the start of the weekThe overall trend of the Dollar Index is still bearish, and today after the market opened it dropped again from a key support level. On the lower timeframe it looks bullish, but on the higher timeframe this could just be a correction


DXY (U.S. Dollar Index) – Bearish MomentumPrice is giving us signs of Bearish Momentum while respecting the larger descending channel structure, having recently tapped the upper trend line with a strong rejection.
Expecting:
A lower time frame correction to confirm continuation.
Targeting 90% if price breaks impulsively to the downside.
If price taps into our area of interest, we might expect a potential bullish reversal, depending on price action and correction quality.
Let price do the work, wait for the correction before entering short.

DXYU.S Dollar Index
- Bearish Channel as an corrective pattern in Short Time Frame
- Fair Value Gap
- Order Block
- Change of Characteristics
- Completed " 123 " Impulsive Waves

DXY update (29/09/2025)The upper rail of the descending parallel channel channel is waiting to be confirmed.
What matters is the fib target and bottom rail intersection. But most importantly is the bottom rail intersection.
Looks like it will be an aggressive dump.
Not financial advice

DXY outlook for the current week (WC29/09/25)DXY key levels to look out for this week, taking into consideration of manufacturing PMI, ADP & NFP
DXY 4H🔹 Overall Outlook and Potential Price Movements
In the charts above, we have outlined the overall outlook and possible price movement paths.
As shown, each analysis highlights a key support or resistance zone near the current market price. The market’s reaction to these zones — whether a breakout or rejection — will likely determine the next direction of the price toward the specified levels.
⚠️ Important Note:
The purpose of these trading perspectives is to identify key upcoming price levels and assess potential market reactions. The provided analyses are not trading signals in any way.
✅ Recommendation for Use:
To make effective use of these analyses, it is advised to manually draw the marked zones on your chart. Then, on the 15-minute time frame, monitor the candlestick behavior and look for valid entry triggers before making any trading decisions.

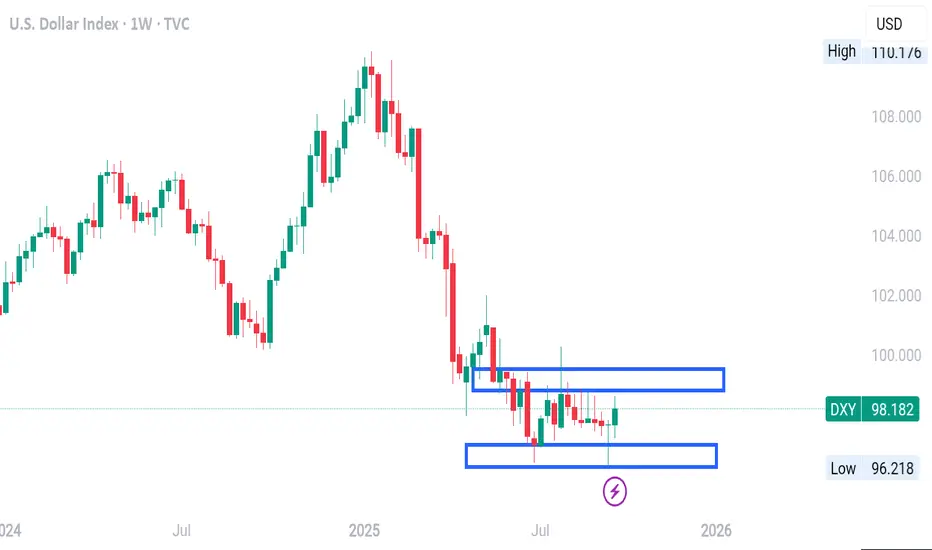
DOLLAR INDEX WEEKLY TIMEFRAME ANALYSIS Looking at the chart (USD Index, Weekly timeframe):
1. Current Context
Price has been in a clear downtrend from the highs above 110.
Recently, it has moved sideways between 96.90 – 99.30 (the two boxed ranges you marked).
Current weekly candle is green, showing a short-term attempt to bounce.
2. Key Zones
Resistance zone: 98.53 – 99.34 (upper box). Price has repeatedly failed to close above this region.
Support zone: 96.92 – 96.12 (lower box). Buyers have stepped in here multiple times to prevent deeper falls.
3. Directional Bias
Macro bias (weekly structure): Still bearish, because the overall trend is lower and price is consolidating near the bottom after a strong selloff.
Immediate/short-term bias: Neutral to slightly bullish, since the last candles show rejection of the lower end (around 97) and price is pushing back up toward resistance at 98.50+.
4. What to Watch
If price breaks and closes above 99.34, bias shifts bullish with room toward 100.95.
If price rejects the 98.5–99.3 zone again and rolls over, expect continuation lower toward 96.00 and potentially 95.30.
👉 Summary:
Bias is bearish overall, but short-term corrective bullish as price moves within the range. Directional confirmation will come only when price breaks out of either the 99.30 resistance or the 96.12 support.