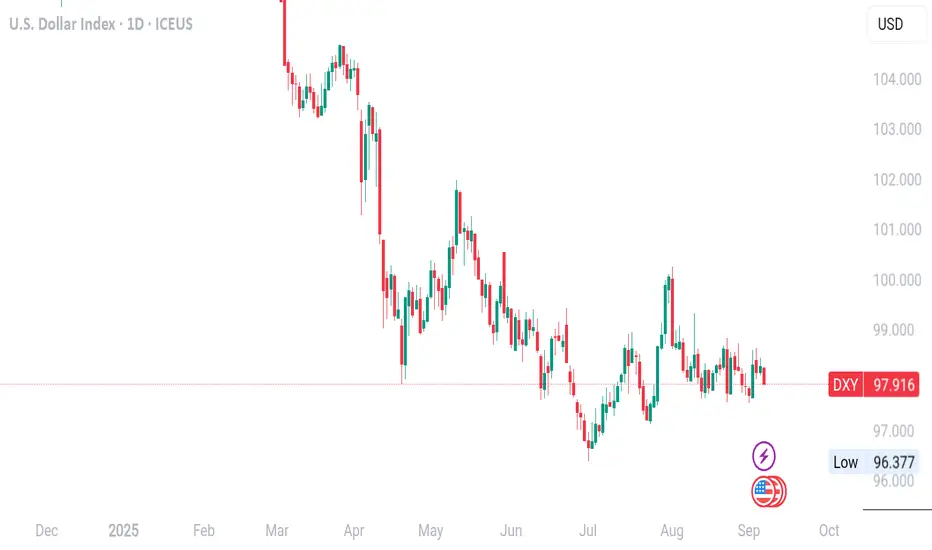
DXY Analysis – August 31, 2025In our past two weekly analyses, we highlighted the 98.00 zone as a key reversal area for the Dollar Index (DXY).
Once again, during the last week, price reacted to this level and started another bearish move.
📉 The recent candlestick structure suggests that sellers are still in control, but to fully confirm downside momentum, we need at least a daily close below 97.00.
🔻 If that happens this week, the index could gradually head toward our next downside targets at 96.00 and 95.00.
DXY trade ideas

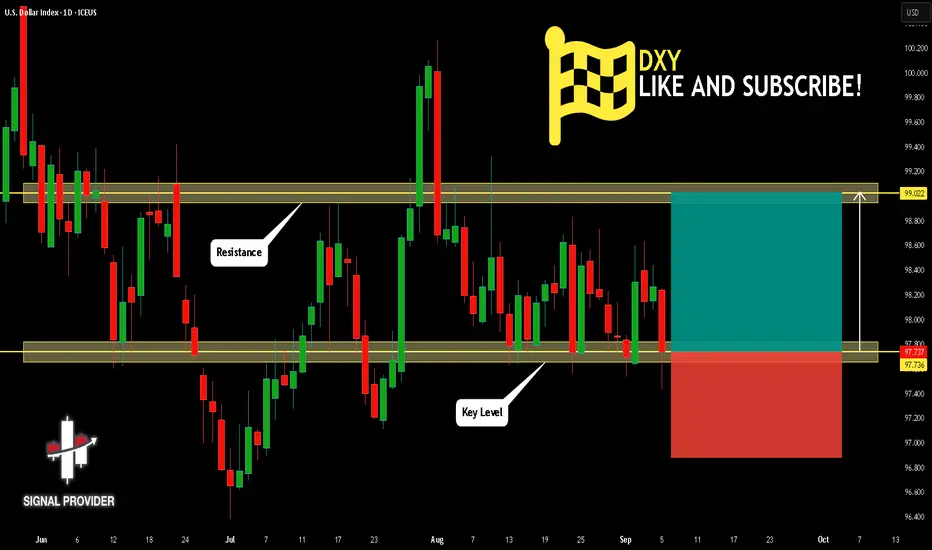
Bearish momentum to extend?The US Dollar Index (DXY) has rejected off the pivot and could drop to the 1st support.
Pivot: 98.63
1st Support: 97.12
1st Resistance: 100.21
Disclaimer:
The above opinions given constitute general market commentary, and do not constitute the opinion or advice of IC Markets or any form of personal or investment advice.
Any opinions, news, research, analyses, prices, other information, or links to third-party sites contained on this website are provided on an "as-is" basis, are intended only to be informative, is not an advice nor a recommendation, nor research, or a record of our trading prices, or an offer of, or solicitation for a transaction in any financial instrument and thus should not be treated as such. The information provided does not involve any specific investment objectives, financial situation and needs of any specific person who may receive it. Please be aware, that past performance is not a reliable indicator of future performance and/or results. Past Performance or Forward-looking scenarios based upon the reasonable beliefs of the third-party provider are not a guarantee of future performance. Actual results may differ materially from those anticipated in forward-looking or past performance statements. IC Markets makes no representation or warranty and assumes no liability as to the accuracy or completeness of the information provided, nor any loss arising from any investment based on a recommendation, forecast or any information supplied by any third-party.

Post NFP Analysis on GBPUSDThe market remains bullish for the DXY.
We'll keep an eye to see either scenario play out, then we Trade

DOLLAR INDEX (DXY)...one of the most important tools for a tradeHello TradingView community! Joseph here, just wanted to share some nuggets on the Dollar Index and how it has helped me in my personal trading and profitability in the markets.
In the video I go over
1. The significance of the USD in the markets
2. How using the USD index is necessary for correlation (multi-asset even)
3. How to use the USD index to help better time your own trades in the markets
So sit back, grab your notebook and take some notes because this information WILL help give you an immediate higher chance of success if applied!! Thanks for watching please boost/comment/follow my page for more trading nuggets!
Cheers!

correction If the index breaks through the current support level, it can advance to the next support level. Then there is a possibility of a trend change or a continuation of the downward trend.

US Dollar: Still Bearish-Neutral, But Is The Correction Ending?Welcome back to the Weekly Forex Forecast for the week of Sept 8-12th.
In this video, we will analyze the following FX market: USD Dollar
The USD is still grinding sideways, but it did sweep the low of the consolidation Friday on bad NFP numbers. Worth mentioning is it finally made contact with a significant demand zone as well. As bearish-neutral as the DXY has looked over the past several weeks, there is potential here that if has finally found support for higher prices.
As long as the market maintains the protected low, we are still in correction territory. The potential for a move higher remains.
React and do not predict.
Enjoy!
May profits be upon you.
Leave any questions or comments in the comment section.
I appreciate any feedback from my viewers!
Disclaimer:
I do not provide personal investment advice and I am not a qualified licensed investment advisor.
All information found here, including any ideas, opinions, views, predictions, forecasts, commentaries, suggestions, expressed or implied herein, are for informational, entertainment or educational purposes only and should not be construed as personal investment advice. While the information provided is believed to be accurate, it may include errors or inaccuracies.
I will not and cannot be held liable for any actions you take as a result of anything you read here.
Conduct your own due diligence, or consult a licensed financial advisor or broker before making any and all investment decisions. Any investments, trades, speculations, or decisions made on the basis of any information found on this channel, expressed or implied herein, are committed at your own risk, financial or otherwise.

Pre"DXY"ction The timeframes keep changing, but i believe the bottom band is absolutely and must be tested. I expect it'll be a 3.618 move down, which is also a fractal from the above.
Let's see,
Not financial advice.

DXY week 7/9/2025We have a lot of SSL on the DXY, we have EQL at the PDL.
So I would like to see a retracement to premium levels to see a sell I have to numbers on my head 98,256 and 98,00
We will see if it’s plays out.

MY POSSIBLE 3 OPTIONS FOR THE DXY NEXT WEEKTrading week 08 - 12 SEPTEMBER 2025
On Friday last week poor USD NFP readings caused a strong selloff of the Index however this didn’t leave the consolidating channel and we saw a re-bounce from 97.500 area of support.
This week a selloff in the 98.054 area could see the index testing the lower lows 96.700 and 96.470; if 98.054 is broken the next levels I will monitor are 98.300 and 98.743 as possible selloff entries. If the price breaks these levels and reaches 99.200 we could see more uptrend the DXY rallying to the 99.900 level of resistance.

DXYDXY is expected to give us correction or impulse upside.
Disclosure: We are part of Trade Nation's Influencer program and receive a monthly fee for using their TradingView charts in our analysis.

U.S. Dollar Index (DXY) Outlook | Gold (XAU/USD) Correlation📈 U.S. Dollar Index (DXY) at Key Support | 🪙 Gold at Record Highs
🔎 Quick Summary:
• DXY holding 97.70 support inside a descending channel.
• A rebound could push it back toward 98.25 – 98.50.
• Meanwhile, Gold is sitting near $3,600/oz, at all-time highs, fueled by safe-haven demand and central bank buying.
• The DXY’s next move will help decide if Gold keeps climbing or pauses.
⸻
💵 U.S. Dollar Index (DXY) Outlook
On the 4H chart, the Dollar Index remains inside a descending channel. It has been forming lower highs and lower lows, yet the 97.70 level has repeatedly held as strong support.
• 🔹 Buyers are defending this zone, showing demand.
• 🔹 A rebound could take price back to the 98.25 – 98.50 supply zone.
• 🔹 A breakout above 98.50 would be significant, opening room toward 99.00+.
This makes the 97.70 region a critical turning point for DXY.
⸻
🪙 Gold (XAU/USD) Context
Gold is trading at record highs around $3,600/oz 🚀 — a level never seen before.
• 🌍 Central banks continue to accumulate gold aggressively.
• 🏦 Expectations of Fed rate cuts reduce the opportunity cost of holding gold.
• ⚖️ Persistent economic and geopolitical uncertainty is fueling safe-haven demand.
Correlation with DXY:
• 📉 If the Dollar rebounds, Gold could slow down or consolidate after its massive rally.
• 📈 If the Dollar breaks below support, Gold could see further upside, possibly testing higher targets near $3,700/oz and beyond.
⸻
📊 Conclusion
The Dollar Index is sitting at make-or-break support. A bounce would show Dollar strength and may cool off Gold’s rally. But if DXY weakens further, Gold could extend its surge into new record territory.
At this point, Gold remains the undisputed leader in the market, with DXY’s next move likely deciding how fast momentum continues.
⸻
⚡ Summary in one line:
💵 DXY at critical support — 🪙 Gold shining at record highs, waiting for the Dollar’s next move.

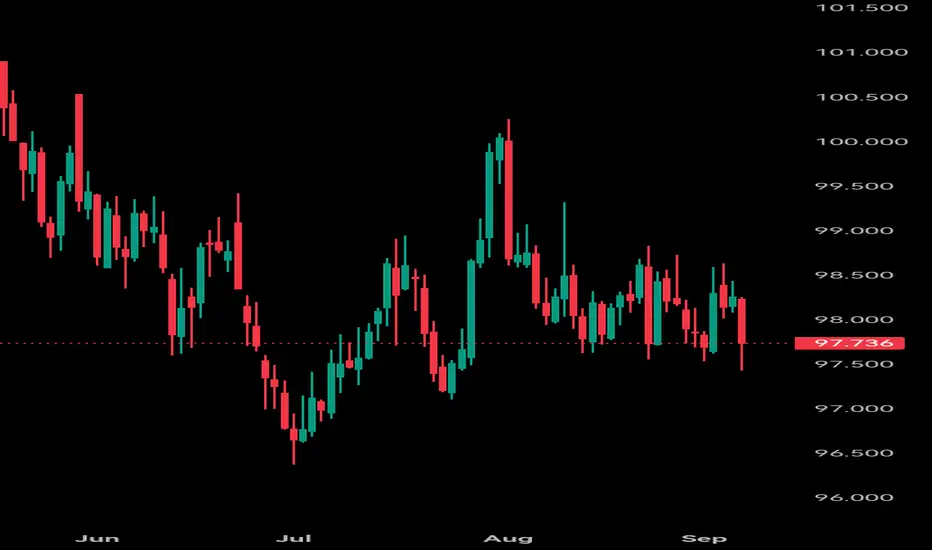
DXY Will Go Up! Long!
Please, check our technical outlook for DXY.
Time Frame: 1D
Current Trend: Bullish
Sentiment: Oversold (based on 7-period RSI)
Forecast: Bullish
The market is trading around a solid horizontal structure 97.736.
The above observations make me that the market will inevitably achieve 99.022 level.
P.S
Overbought describes a period of time where there has been a significant and consistent upward move in price over a period of time without much pullback.
Disclosure: I am part of Trade Nation's Influencer program and receive a monthly fee for using their TradingView charts in my analysis.
Like and subscribe and comment my ideas if you enjoy them!
DXY monthly chart ... bullish aheadDXY monthly chart trading at 97.300- according to channel shows DXY current price is at its cruicial support if it breaks may reach to 200 month EMA i.e. 91.864. As per previous pattern behavior it should reverse from here. If it crosses 100 month EMA i.e. @ 98.511 then price will touches to 50 month EMA 101.253 very soon. This month is only for buyers.

Dollar Index - How Low Can We Really Go?The U.S. dollar is having the kind of year that makes you check if someone switched its medication — down about 10% so far in 2025, its worst showing since Richard Nixon murdered the gold standard.
Momentum traders had a field day this week with low resistance from 98.100 to 97.500 within one trading session.
This draw towards sell side liquidity was covered in the previous analysis and if you participated in the short play this week, you should be proud of yourself!
GBPUSD and EURUSD (the only 2 FX pairs I track) rallied on dollar weakness, targeting premium arrays on the 1-hour timeframe.
Although my overall bias for dollar index is bearish which will provide risk on scenarios, it does not mean every single week will print limit down. Retracements are expected. For this reason, I am playing it safe by being neutral.

DXY consolidationWith the dollar consolidating over 20 trading days showed a "no impulse" month rather than prices moving during high impact news. WIth prices consolidating on the demand level but failing to take out the lowest area, signals hope for the coming week as bulls look to push prices higher.

Okay, here is a brief analysis of the US Dollar Index (DXY). **Okay, here is a brief analysis of the US Dollar Index (DXY).
**Fundamental Analysis:**
The US Dollar Index (DXY) is a composite measure of the dollar's value against a basket of major currencies. Its trajectory is primarily driven by the Federal Reserve's monetary policy stance and the relative strength of the US economy. The dollar typically strengthens when the Fed adopts a hawkish stance (hiking rates or signaling hikes), US economic data outperforms (e.g., NFP, GDP, CPI exceeding expectations), or global risk-off sentiment sparks safe-haven demand. Conversely, it often weakens on expectations of Fed rate cuts, weak US data, or improved global risk appetite.
**Technical Analysis:**
From a technical perspective, after a prolonged rally fueled by an aggressive hiking cycle, the DXY has recently been consolidating at high levels. The 105-106 zone is a crucial pivot point. A decisive break and hold above 107 could signal a resumption of the uptrend. However, a sustained break below key support near 104 might indicate exhausted bullish momentum and risk a deeper correction. Traders should watch its correlation with US Treasury yields closely.
**Summary and Outlook:**
In the short term, the DXY's movement will remain highly volatile, closely tied to Fed policy expectations and economic data releases. Its longer-term direction depends on the growth and interest rate differential outlook between the US and other major economies (particularly the Eurozone). The market is still pricing in the Fed's rate cut path, keeping the dollar's near-term direction uncertain.
***
*Disclaimer: The above content is market analysis and does not constitute investment advice. Markets are risky; invest with caution.*

DXY4H Trading Outlook for the Upcoming Week
In this series of analyses, we review trading perspectives and short-term outlooks.
As can be seen, in each analysis there is a key support/resistance zone near the current price of the asset. The market’s reaction to—or breakout from—this zone will determine the next price movement toward the specified levels.
Important Note: The purpose of these trading outlooks is to highlight key levels ahead of the price and the market’s potential reactions to them. The analyses provided are by no means trading signals!

DOLLAR INDEX DOLLAR INDEX holding on support floor, one more bearish drop will it tanking ,the US10Y is down .
#dollar #dxy
DXY DOLLAR INDEX GOLD BULLS WINS ON ECONOMIC DATA REPORT .
BREAKDOWN.
Indicator Current Forecast Previous
Average Hourly Earnings m/m 0.3% 0.3% 0.3%
Non-Farm Employment Change 22,000 75,000 79,000
Unemployment Rate 4.3% 4.3% 4.2%
Fed Interpretation:
Average Hourly Earnings (0.3% m/m): In line with forecasts and previous data, showing steady wage growth. Stable wage growth suggests moderate inflation pressure from labor costs.
Non-Farm Employment Change (22,000): Significantly below forecast (75,000) and previous month (79,000), indicating a sharp slowdown in job creation. This suggests labor market cooling, potentially reflecting economic slowdown or more cautious hiring by employers.
The agency responsible for the US Non-Farm Employment Change data is the U.S. Bureau of Labor Statistics (BLS), which is part of the U.S. Department of Labor
The report, often released on the first Friday of each month, measures the change in the number of people employed in the US excluding farm workers, private household employees, and nonprofit organization employees.
It is based on the Current Employment Statistics (CES) survey which covers about 141,000 businesses and government agencies, representing approximately 486,000 worksites.
The data provides detailed insights into employment, hours worked, and earnings across various industries.
The report is closely watched as a key indicator of labor market health and overall economic performance.
Unemployment Rate (4.3%): Slightly increased from previous 4.2%, matching forecast. A rising unemployment rate confirms some softening in labor market conditions.
The agency responsible for measuring and reporting the Unemployment Rate in the United States is the U.S. Bureau of Labor Statistics (BLS), which is part of the U.S. Department of Labor (DOL).
Key Points:
The Unemployment Rate is part of the monthly Employment Situation Report produced by the BLS.
It measures the percentage of the labor force that is jobless but actively seeking work.
Data for the unemployment rate is collected through the Current Population Survey (CPS), which surveys approximately 60,000 households.
The BLS releases the unemployment rate and other labor statistics on the first Friday of every month.
The Department of Labor oversees the BLS, which is responsible for gathering and disseminating this critical labor market data that influences economic policy, including Federal Reserve decisions.
Summary:
U.S. Bureau of Labor Statistics (BLS): the official source for the unemployment rate.
U.S. Department of Labor (DOL): the parent department supervising BLS operations.
The unemployment rate data helps assess economic health and guides policy decisions on employment and inflation.
Overall Fed Takeaway:
The marked slowdown in job growth combined with a slight rise in unemployment signals weakening labor market strength
Stable wage growth limits upside inflation risks from labor costs.
These signals suggest easing inflation pressures and a slowing economy, which might encourage the Fed to pause further rate hikes or consider cutting rates soon to support growth.
The Fed will likely weigh this data alongside other inflation and economic indicators to decide the next policy step but may lean cautiously towards easing given the weaker jobs data.
In summary, today’s data points to a moderating labor market with controlled wage inflation that supports a more dovish Fed approach in upcoming meetings.
DXY DEFENDED 97,428 ON DATA RPORT AND CLOSE THE 4HR ABOVE KEY SUPPORT STRUCTURE TO 97.722 AS AT REPORTING.
THE US 10Y BOND YIELD 4.056% SINKING TODAY BUT ON STRUCTURE THE US10Y IS ON DEMANDFLOOR AND BOND BUYING COULD OFFSET GOLS GAINS TODAY.
OPEN OF NEXT WEEK GOLD WILL CORRECT BECAUSE ITS OVER BOUGHT.
#GOLD #DXY #US10Y #DOLLAR

DXY Trust and PatientPatient is a key
Flip the chart then we will see the pattern
Everything is on the chart
Goodluck to all of us

DXY Update📉 Outlook:
USD remains under pressure as weak August NFP (22K jobs vs. 75K expected) reinforces bets on a Fed rate cut in mid-September.
📊 Key Levels:
Support: 97.90 → 97.50 → 97.00
Resistance: 98.35 → 98.80 → 99.20
🎯 Scenarios:
Bearish: Break below 97.90 → 97.50–97.00
Bullish: Recovery above 98.35 → 98.80–99.20
⏱ Next Catalyst: US CPI (Sept 11) – a hotter print could trigger a USD rebound; soft data may extend the decline.
Summary: DXY in medium-term downtrend. Short-term price trapped near critical support. Watch CPI for the next directional move.

EDUCATION -HOW TO TRADE NFP
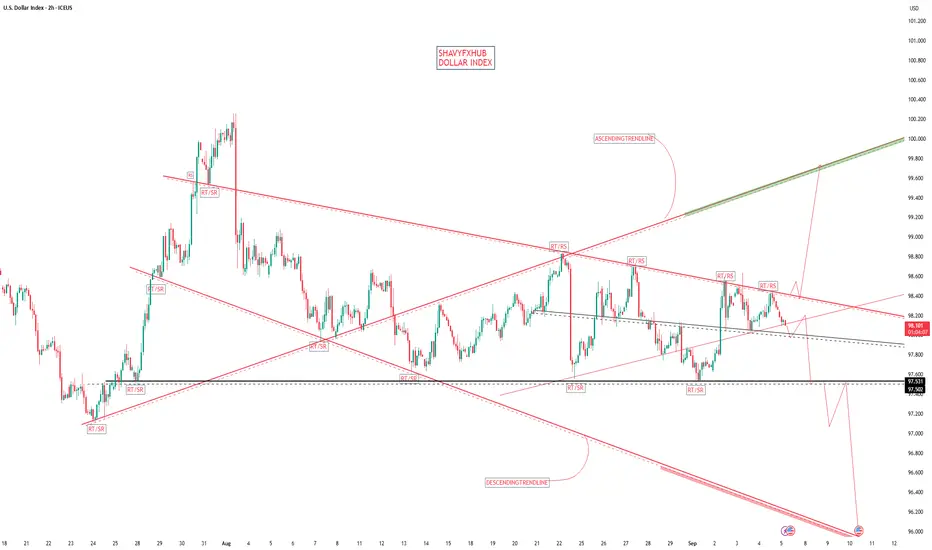
🔎 Current Chart Context (Sept 1–4)
Price rallied strongly from 97.60 → 98.60 on Sept 1 (likely institutional accumulation).
Since then, we’ve been in a range/consolidation:
Support zone: 97.90 – 98.00
Resistance zone: 98.55 – 98.65
Liquidity pools:
Buy-side liquidity above 98.65 (equal highs).
Sell-side liquidity below 97.90 (equal lows).
This is a perfect pre-NFP “box” setup.
---
📌 Likely NFP Scenarios (Sept 5)
Based on technical footprints:
1. Liquidity Sweep to the Upside → Reversal Down (High Probability)
Price spikes above 98.65 resistance on the NFP release.
Retail traders chase the breakout.
Institutions sell into that liquidity.
Reversal targets 98.00 / 97.90 support (maybe deeper toward 97.70).
This would match the typical “NFP fake breakout” play.
---
2. Liquidity Sweep to the Downside → Reversal Up (Alternative)
Price sweeps below 97.90 support first.
Sharp rejection back inside the box.
Real move then pushes back above 98.40–98.60.
This scenario requires a strong rejection wick — otherwise, a clean break of 97.90 means sellers fully take control.
---
🔑 Technical Clue
Institutions already built longs from 97.60.
They might use NFP to take profit by running price above 98.65, then selling off.
If the spike and reversal play happens → expect USD weakness after the news.
---
🎯 Trading Playbook for Tomorrow
1. Mark the range box: 97.90 (support) – 98.65 (resistance).
2. Wait for the first spike on NFP (don’t chase it).
3. If it sweeps liquidity (either side) and rejects sharply → trade the opposite direction.
4. Targets: opposite side of the box (98.65 → 97.90, or 97.90 → 98.65).
---
✅ In short: Technically, todays NFP will likely grab stops above 98.65 first, then reverse lower toward 98.00/97.90. But always wait for confirmation — the first spike is usually the trap.