PSU internal money shift likely?psu bank in strong trend and now with strong results and momentum
the selling volume a day ago and buying volume today show a different story for this script .however a short sell may trigger below 870 for 830 and 810 & 785 target areas .
Next report date
—
Report period
—
EPS estimate
—
Revenue estimate
—
83.70 INR
112.61 B INR
719.16 B INR
352.41 M
About Indian Bank
Sector
Industry
CEO
Binod Kumar
Website
Headquarters
Chennai
Founded
1907
ISIN
INE562A01011
FIGI
BBG000DYKKG6
IPO date
Mar 5, 2007
IPO offer price
2.06 USD
Indian Bank engages in the provision of banking products and services. It operates through the following segments: Treasury, Corporate/Wholesale Banking, Retail Banking, and Other Banking Operations. It offers NRI-Foreign Exchange, Applications Supported by Blocked Amount for IPO, wealth management services, supreme current accounts, educational loan, centralized pension processing, interest subsidy for educational loans, and financial inclusion plan. The company was founded by V. Krishnaswamy Iyer on March 5, 1907 and is headquartered in Chennai, India.
Related stocks


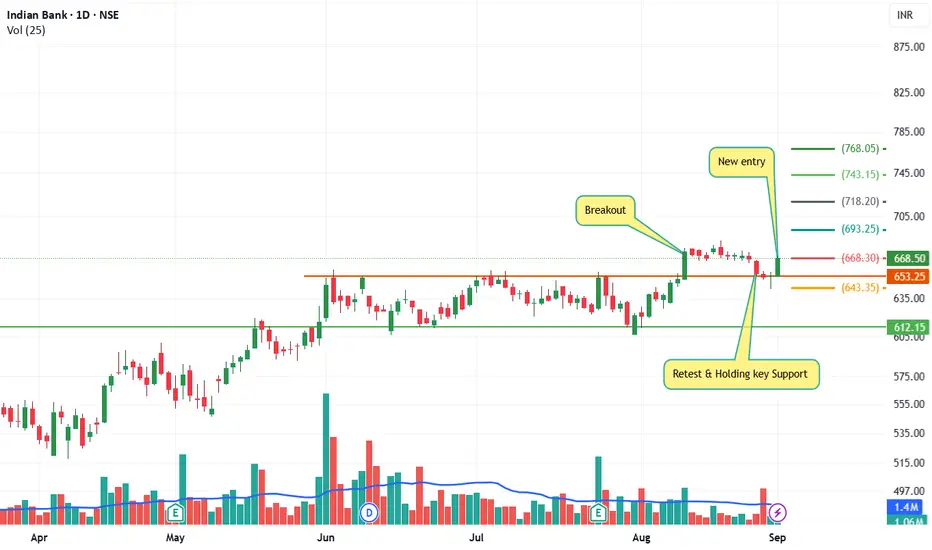
Indian Bank (NSE) (1D) - Break , RetestedKey Observations
Breakout: Stock broke out above resistance (~₹653) in mid-August.
Retest: Price pulled back, successfully retested that breakout level (~₹653) as support.
Support Holding: Holding above this level signals strength.
New Entry Zone: Current move above ₹653 confirms continuation of u
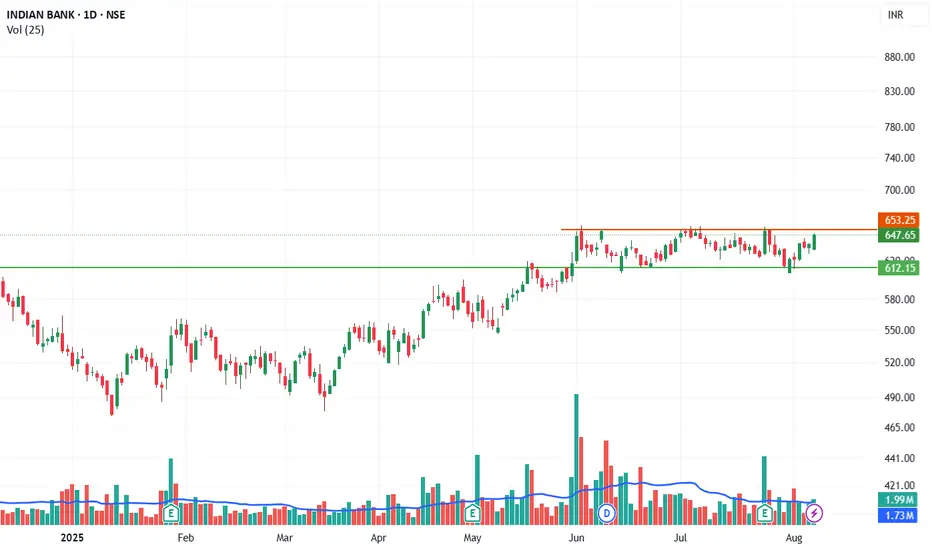
Indian Bank (NSE: INDIANB)- a precursor to a breakout⚠️ Disclaimer: This chart is for educational purposes only.
Price Action & Resistance Analysis
Current Market Price: ₹647
Upper Resistance Zone: ₹653
This level has been tested multiple times since early June but has not yet been convincingly broken, indicating a strong horizontal resistance.
S
INDIANB - 640 ABOVEIndianb no have in very good levels, long consolidation breakout and sustaining near
ATH...
Above 640 possible good rally up side for short term gain


INDIANB - 1 year RECTANGLE══════════════════════════════
Since 2014, my markets approach is to spot
trading opportunities based solely on the
development of
CLASSICAL CHART PATTERNS
🤝Let’s learn and grow together 🤝
══════════════════════════════
Hello Traders ✌
After a careful consideration I came to the conclusion that:
-
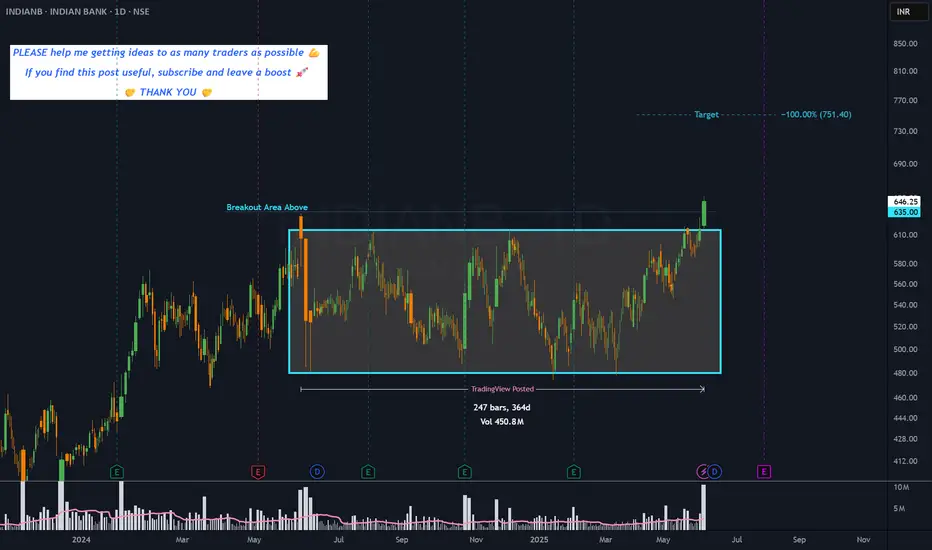
Indian bank near Resistance breakout.No need to address here; look simple resistance seem, if bo give good potential to move. But key level is last up swing. Keep it wait and watch.

INDIANB Trading Near Tested Demand ZoneINDIANB is currently trading at ₹500.25, near a tested demand zone that spans ₹504.8 to ₹487.35, formed on 29th October 2024. Since this zone has been tested, it may provide limited support, and cautious monitoring is advised.
Disclaimer: This analysis is for informational purposes only and should

Just a view (educational purpose only)Just a view (educational purpose only)
strictly buy above 560,
Target 620, 635 650
Completely on market condition

See all ideas
Summarizing what the indicators are suggesting.
Neutral
SellBuy
Strong sellStrong buy
Strong sellSellNeutralBuyStrong buy
Neutral
SellBuy
Strong sellStrong buy
Strong sellSellNeutralBuyStrong buy
Neutral
SellBuy
Strong sellStrong buy
Strong sellSellNeutralBuyStrong buy
An aggregate view of professional's ratings.
Neutral
SellBuy
Strong sellStrong buy
Strong sellSellNeutralBuyStrong buy
Neutral
SellBuy
Strong sellStrong buy
Strong sellSellNeutralBuyStrong buy
Neutral
SellBuy
Strong sellStrong buy
Strong sellSellNeutralBuyStrong buy
Displays a symbol's price movements over previous years to identify recurring trends.
724INBK34.N0
Indian Bank 7.24% 13-SEP-2034Yield to maturity
—
Maturity date
Sep 13, 2034
712INBK34.N0
Indian Bank 7.12% 25-OCT-2034Yield to maturity
—
Maturity date
Oct 25, 2034
See all INDIANB bonds
Frequently Asked Questions
The current price of INDIANB is 862.65 INR — it has decreased by −0.36% in the past 24 hours. Watch Indian Bank stock price performance more closely on the chart.
Depending on the exchange, the stock ticker may vary. For instance, on NSE exchange Indian Bank stocks are traded under the ticker INDIANB.
INDIANB stock has risen by 1.71% compared to the previous week, the month change is a 7.24% rise, over the last year Indian Bank has showed a 64.61% increase.
We've gathered analysts' opinions on Indian Bank future price: according to them, INDIANB price has a max estimate of 930.00 INR and a min estimate of 700.00 INR. Watch INDIANB chart and read a more detailed Indian Bank stock forecast: see what analysts think of Indian Bank and suggest that you do with its stocks.
INDIANB reached its all-time high on Nov 3, 2025 with the price of 887.80 INR, and its all-time low was 41.55 INR and was reached on Mar 25, 2020. View more price dynamics on INDIANB chart.
See other stocks reaching their highest and lowest prices.
See other stocks reaching their highest and lowest prices.
INDIANB stock is 2.44% volatile and has beta coefficient of 1.33. Track Indian Bank stock price on the chart and check out the list of the most volatile stocks — is Indian Bank there?
Today Indian Bank has the market capitalization of 1.19 T, it has decreased by −0.52% over the last week.
Yes, you can track Indian Bank financials in yearly and quarterly reports right on TradingView.
Indian Bank is going to release the next earnings report on Jan 28, 2026. Keep track of upcoming events with our Earnings Calendar.
Indian Bank revenue for the last quarter amounts to 90.38 B INR, despite the estimated figure of 79.41 B INR. In the next quarter, revenue is expected to reach 92.90 B INR.
INDIANB net income for the last quarter is 31.08 B INR, while the quarter before that showed 22.76 B INR of net income which accounts for 36.53% change. Track more Indian Bank financial stats to get the full picture.
Yes, INDIANB dividends are paid annually. The last dividend per share was 16.25 INR. As of today, Dividend Yield (TTM)% is 1.84%. Tracking Indian Bank dividends might help you take more informed decisions.
Indian Bank dividend yield was 3.00% in 2024, and payout ratio reached 19.44%. The year before the numbers were 2.30% and 18.17% correspondingly. See high-dividend stocks and find more opportunities for your portfolio.
As of Nov 21, 2025, the company has 40.07 K employees. See our rating of the largest employees — is Indian Bank on this list?
Like other stocks, INDIANB shares are traded on stock exchanges, e.g. Nasdaq, Nyse, Euronext, and the easiest way to buy them is through an online stock broker. To do this, you need to open an account and follow a broker's procedures, then start trading. You can trade Indian Bank stock right from TradingView charts — choose your broker and connect to your account.
Investing in stocks requires a comprehensive research: you should carefully study all the available data, e.g. company's financials, related news, and its technical analysis. So Indian Bank technincal analysis shows the neutral today, and its 1 week rating is buy. Since market conditions are prone to changes, it's worth looking a bit further into the future — according to the 1 month rating Indian Bank stock shows the buy signal. See more of Indian Bank technicals for a more comprehensive analysis.
If you're still not sure, try looking for inspiration in our curated watchlists.
If you're still not sure, try looking for inspiration in our curated watchlists.