INIT/USDT — The Big Battle at the Trendline!Is it time for a breakout and reversal, or just another false hope before the downtrend continues?
---
🔎 Overview
INIT/USDT is currently trading around 0.3626 USDT, after a prolonged downtrend since its peak in May. Price has formed a series of lower highs & lower lows, with the yellow descending trendline acting as the main “wall” suppressing every rally.
Interestingly, the market is now approaching a critical test at the trendline. From here, the market will reveal its true intention:
If it breaks above, a major reversal could begin.
If it fails and gets rejected, the downtrend may continue, retesting lower supports.
---
🧩 Pattern Analysis
1. Dominant Descending Trendline
The psychological barrier for sellers since the top.
As long as this trendline holds, the primary trend remains bearish.
2. Local Base / Consolidation
Price has recently formed a local bottom around 0.28–0.32.
This zone serves as the current foundation for potential upside.
3. Key Horizontal Levels (Dashed Lines)
0.4053 → nearest resistance and first “gate” to bullish bias.
0.4782 → next resistance, momentum confirmation.
0.5317 & 0.5799 → mid-term upside targets.
0.7972 → key psychological area if a full reversal unfolds.
---
🚀 Bullish Scenario
Key trigger: Daily close above trendline + 0.4053.
Confirmation: Breakout supported by higher volume + successful retest of trendline as new support.
Upside targets:
0.4782 → +31.9% from current price.
0.5317 → +46.6%.
0.5799 → +59.9%.
Longer-term potential: If momentum builds, price could aim for 0.7972 up to 1.1662.
---
🩸 Bearish Scenario
Rejection at the trendline: Reversal candles here would signal sellers remain in control.
Downside targets:
Retest support at 0.32–0.28.
If this zone breaks, likely move down to historical low at 0.20 (−44.8% from current price).
False breakout risk: A breakout without volume could turn into a bull trap.
---
📌 Strategy & Risk Management
Conservative entry (low risk): Wait for daily close above 0.4053 + retest → enter with staged profit-taking.
Aggressive entry: Buy directly on breakout above trendline with tight stop-loss under recent swing low.
Short plan: Enter on strong rejection at the trendline, with first target near 0.28 support.
Stop-loss: Always place SL based on structure (e.g., under 0.28 for longs, above rejection high for shorts).
Money management: Risk ≤ 1–2% of capital per trade.
---
⚖️ Conclusion
INIT is at a critical juncture.
Breakout above the trendline + 0.4053 = early reversal signal with multi-stage upside potential.
Rejection at trendline = continuation of downtrend toward 0.28–0.20 support.
In this condition, discipline is key: don’t FOMO, wait for confirmation, and stick to strict risk management.
---
#INIT #INITUSDT #CryptoAnalysis #TechnicalAnalysis #Breakout #SupportResistance #Trendline #CryptoTrading #MarketUpdate
INITUSDT.P trade ideas

$INIT Epic Dip & Reversal Strategy Revealed!BINANCE:INITUSDT
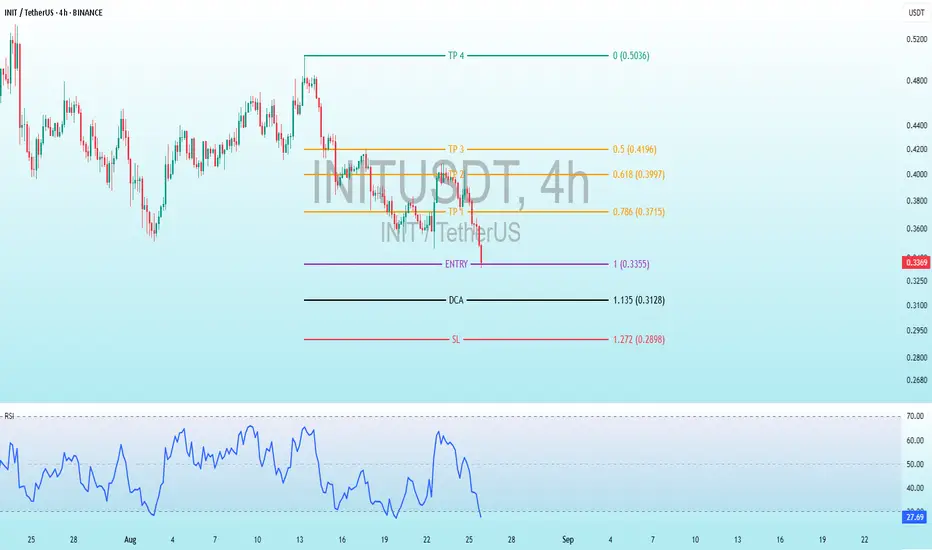
Entry Level:
Marked at 1 0.3355 - 0.3370 USDT, indicating the intended entry point for a long position.
DCA (Dollar Cost Averaging): Set at 1.35 USDT, suggesting a level to add to the position if the price dips further.
Take Profit (TP) Levels:
TP1: 0.786 (0.3715) USDT
TP2: 0.618 (0.3997) USDT
TP3: 0.5 (0.4196) USDT
TP4: 0.0 (0.5036) USDT
Stop Loss (SL): Set at 1.272 (0.2898) USDT, above the entry to limit potential losses.
The price has recently dropped below the entry level, indicating a potential need to reassess the strategy or wait for a bounce.
Technical Indicators
RSI (Relative Strength Index): The RSI at the bottom shows a decline from around 50 to below 30 (oversold territory) in the recent period. This suggests the price may be oversold and could see a reversal or consolidation soon.
It is a time for INITUSDT! 50% potential profit-0.65 USD targetThe chart displays the INT/USDT pair on a 4-hour timeframe from Binance, covering the period from June to August 2025. The Y-axis shows the price scale in USD, ranging from approximately 0.3000 to 0.8000, with the current price hovering around 0.447 USD. Candlesticks in turquoise (bullish) and red (bearish) indicate high volatility, with a dominant downtrend from the chart's start. The red line, likely a moving average (MA), runs above the price for most of the period, confirming bearish momentum and acting as a dynamic resistance. The green line below the price may represent the lower boundary of a channel or another average, highlighting support levels. In early June, the price started above 0.7000 USD, followed by a sharp drop to around 0.4000 USD by late June, with brief rebounds and further declines in July. In August, we observe consolidation with smaller price swings, where the price tests the support around 0.4200-0.4400 USD, but more green candlesticks suggest growing buying pressure. Trading volume (visible at the bottom as green and red bars) shows increased activity at turning points, which may indicate accumulation by investors. The overall picture is a market in a correction phase after a strong decline, with signs of seller exhaustion and a potential reversal.
Considering these factors, I am convinced that the INT/USDT price will reach a target of 0.65 USD in the near future. Firstly, the chart is forming a classic double bottom pattern around the 0.4200 USD level, a strong bullish signal often preceding significant rebounds – historically, such formations in cryptocurrencies have led to 40-50% increases, perfectly aligning with the 0.65 USD target as the first resistance level (visible at earlier highs from June). Secondly, the red MA is flattening, and the price is approaching it from below, suggesting an upcoming bullish crossover, similar to those that have previously triggered rallies in high-volatility assets like INT. Additionally, the green support line holds firm, preventing further declines, while the growing number of green candlesticks with longer lower wicks indicates market rejection of lower prices. In the broader cryptocurrency market context, where altcoins like INT often rebound after an accumulation phase, the 0.65 USD target seems not only realistic but also conservative – it could be achieved within the next 2-4 weeks, driven by potential FOMO from investors and positive catalysts, such as INT project updates. This is not speculation, but a logical continuation of current technical patterns, which rarely fail in such scenarios.
Potential TP: 0.65 $

INITUSDT Forming Falling WedgeINITUSDT is showing signs of a classic Falling Wedge Pattern, a bullish chart formation that typically indicates a strong reversal or continuation to the upside. This pattern occurs when price action narrows within a descending range, creating lower highs and lower lows while momentum starts to fade. Once price begins to break out of the wedge with volume confirmation, it often sparks significant upward momentum. The current technical structure of INITUSDT suggests an imminent breakout, with the potential to generate gains between 90% to 100% based on historical wedge breakouts and price projection targets.
Volume for INITUSDT has been consistent and notably supportive, which adds weight to the bullish case. A breakout from a falling wedge pattern on increasing volume typically validates the strength of the move. This surge in volume indicates growing interest and accumulation by market participants who are positioning early for the expected rally. As the pattern tightens and nears its apex, any breakout candle should be watched closely for entry signals.
Investor sentiment around INIT is also turning positive, with attention picking up due to the coin’s underlying potential and recent developments in its ecosystem. Technical traders and crypto enthusiasts alike are keeping a close watch on INITUSDT as it sets up for a major move. Such high-probability bullish setups are rare and offer lucrative risk-reward ratios, especially when backed by both price action and market activity.
This setup reflects a confluence of favorable technical indicators and growing investor interest, making INITUSDT one of the more attractive bullish opportunities on the market right now. Traders should prepare for confirmation and watch resistance levels closely for a potential explosive move upward.
✅ Show your support by hitting the like button and
✅ Leaving a comment below! (What is You opinion about this Coin)
Your feedback and engagement keep me inspired to share more insightful market analysis with you!
Initia · Higher Highs & Higher Lows, The Market GrowsI can see it moving. I can clearly see the end of a bearish move and trading conditions being 100% different to just a few months back.
I can see the difference between the down period and the sideways period. Initia is no longer going down, the bottom has become flat. I can see the change. Change implies something different will happen and this is the market going up. It is no longer down, it has been sideways and now looking to change. A major rise is upon us. This chart can be used as a short-term trade setup.
Here is another one, notice the low 2-August. We have a higher low compared 8-July and the action is already happening back above the 22-June low which was a main low. Some pairs produced a strong higher low two days ago and I mentioned that the possibility exists for lower prices before rising. Here you can see why lower prices is not the most likely scenario. The market already hit bottom and is recovering and the recent bottom was a higher low. For a lower low, we know this last low would have been pierced as support and then taken out. The fact that it wasn't even tested is a signal of strength.
We still have to wait, but market conditions are looking good and we experienced only a very small retrace. It is normal, the market will continue to rise but as it rises prices will continue to fluctuate. A retrace can last 3 days but it can also last 2-3 weeks. A correction can last 2-3 weeks but sometimes it can extend into several months.
What we need to know is that these fluctuations are temporary and for as long as the market is bullish, each time the drop stops we get a new wave of growth. Each wave will produce a higher high and in this way the market grows.
Namaste.

INIT / USDT : Momentum building..Keep a close watchINIT/USDT Breakout Alert
INIT/USDT is showing a strong breakout from a descending channel pattern, signaling a potential bullish move. This setup has great potential, and if the breakout continues, we could see significant upward momentum.
Target: Keep an eye on the next resistance levels, with a move potentially reaching towards $0.5.
INIT/USDT - Double bottom INIT has successfully double-bottomed around the $0.35 zone, confirming it as a strong demand area. The first leg off this support showed a powerful push from buyers, signaling renewed interest and a potential trend shift. Now, price action is heating up again as buyers step in aggressively with rising volume, reinforcing the bullish momentum.

INITUSDT at a Crossroads: Bounce or Break Break Down?📊 Comprehensive and Relevant Analysis
On the 12-hour timeframe, the INIT/USDT pair is currently retesting a crucial demand zone between $0.3500 – $0.3685. This zone previously acted as a strong support that triggered a sharp upward move in mid-July.
Now, price is sitting just above the lower edge of that demand box — a critical moment that could dictate the short- to mid-term trend.
---
🐂 Bullish Scenario (Potential Rebound):
Price has tested the $0.35 - $0.3685 zone multiple times and continues to reject further downside.
A micro higher low structure is forming inside the demand zone, indicating that buyers may be regaining control.
If a bounce occurs and price breaks above the minor resistance at $0.4045, the next upside targets are:
$0.4805 – previous consolidation area
$0.5843 to $0.6421 – historical high-volume zones
Confirmation will be stronger if a bullish engulfing, hammer, or volume spike candle forms at this level.
---
🐻 Bearish Scenario (Breakdown of Support):
If price closes convincingly below $0.35, the demand zone will be invalidated.
This could trigger a continuation of the downtrend toward:
$0.3000 – next psychological support
Possibly as low as $0.2650 – the major long-term support
A breakdown will confirm a new lower low structure, validating seller dominance and increasing bearish momentum.
---
📐 Visible Patterns and Structures:
Range Consolidation between $0.35 – $0.48: suggests either accumulation or distribution before a breakout.
Descending Channel on the mid-term structure: indicates a controlled bearish trend.
Potential Double Bottom: if the price bounces and reclaims $0.48, a reversal pattern may play out.
Support Zone Compression: repeated hits to the same support often lead to a break if buyers lose strength.
---
📌 Key Takeaway:
INIT is currently at a decision point. This level is known to precede large directional moves — either a strong bounce or a significant breakdown.
📉 A confirmed breakdown below the demand zone = a strong short setup.
📈 A bullish reaction with volume and reversal signals = a potential buy opportunity.
Traders should wait for confirmation from the next few candles and watch for reaction volume before committing to a position.
#INITUSDT #CryptoAnalysis #DemandZone #BreakoutOrBreakdown #AltcoinWatch #SupportAndResistance #VolumeAnalysis #TechnicalOutlook #PriceActionSetup #CryptoTrend

INITUSDT 1D#INIT is moving inside a falling wedge pattern on the daily chart. Consider buying at the current price and near the support level at $0.3992.
In case of a breakout above the pattern resistance, the upside targets are:
🎯 $0.5794
🎯 $0.7291
🎯 $0.8502
🎯 $0.9712
🎯 $1.1435
🎯 $1.3630
⚠️ As always, use a tight stop-loss and apply proper risk management.

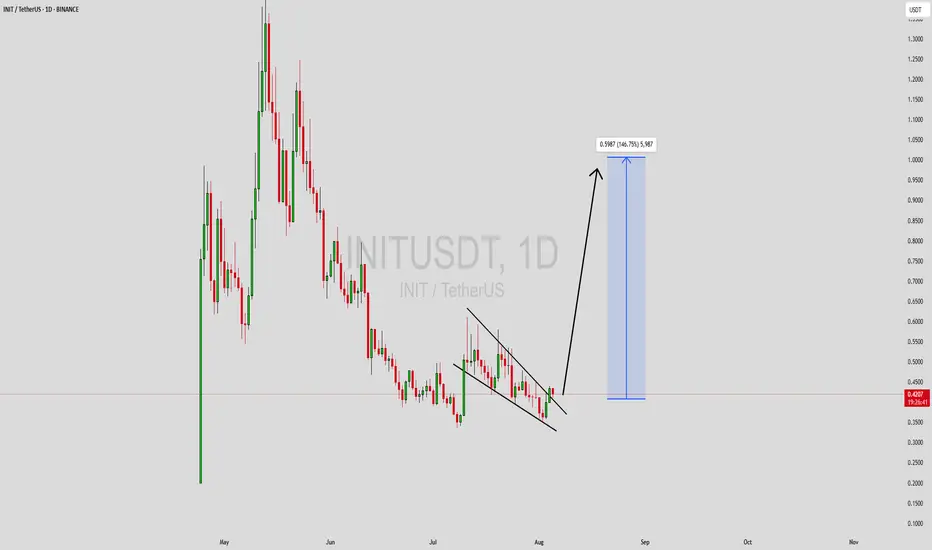
Initia Breaks Downtrend · 300% Profits Potential Chart SetupHere we have a nice chart setup and we are aiming for 144% short-term followed by 300%+ potential profits. Initia—INITUSDT—broke out of a downtrend 10-July with a full green candle and is already trading above EMA21. This is a solid, easy and simple chart setup.
Notice how the new projects continue moving forward while some of the big projects are stalling or retracing. This simply shows that the overall market continues bullish. If the market were to go on a correction, which develops marketwide, everything turns red.
When some pairs remain green in whatever section of the market, it means that money is simply moving from one sector to the next. After just a few hours, the market continues growing. We will see additional growth in the coming days. All is green, all is good, continue to hold strong. This is only the start.
Namaste.
INTUSDT – LONG RecommendationINTUSDT – LONG Recommendation
Trade Type: Spot or Intraday/Short-term Scalping
Entry: Current price ~$0.5347; accumulate incrementally if price drops lower.
Exit Strategy: Follow Daily timeframe (D1) peaks for closing positions.
Holding Period: Determined by D1 peak cycles (typically intraday or a few days).

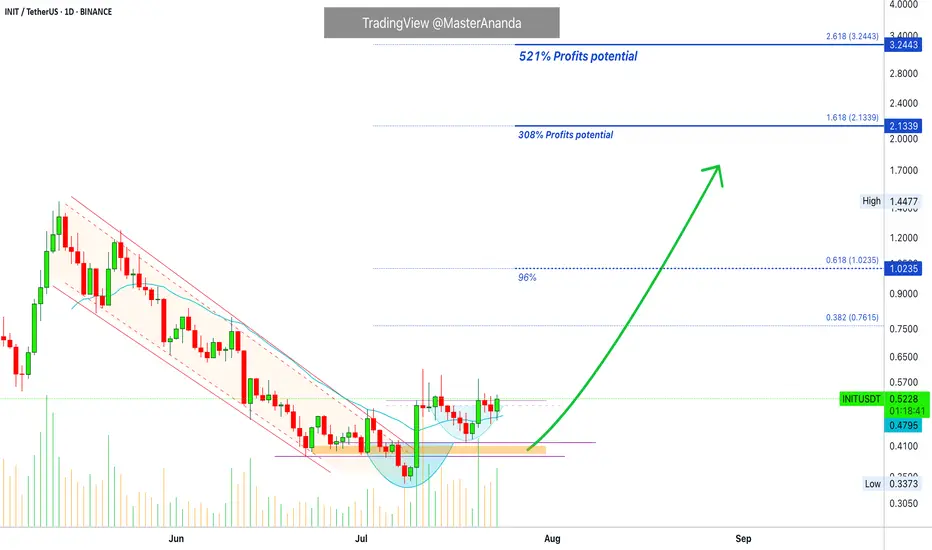
INIT | Bullish DivergenceThe INIT/USDT daily chart shows a compelling bullish divergence setup that could signal a potential reversal from the current downtrend.
Bullish Divergence Pattern:
Price has made lower lows while RSI shows higher lows
This divergence often precedes trend reversals
Price is currently testing the descending trendline support
Technical Setup:
Current price around $0.41 near key support level
RSI approaching oversold territory but showing resilience
The projected path (red arrow) suggests a potential move toward the resistance zones
Price Targets:
First resistance: $0.70-0.75 zone (pink box)
Second resistance: $1.12-1.21 zone (upper pink box)
Risk Considerations:
A break below current support could invalidate the divergence
Volume confirmation needed for sustainable reversal
Crypto markets remain volatile with external factors affecting sentiment

#INIT/USDT Potential Bullish Reversal After Down Channel Break #INIT
The price is moving within a descending channel on the 1-hour frame and is expected to break and continue upward.
We have a trend to stabilize above the 100 moving average once again.
We have a downtrend on the RSI indicator that supports the upward break.
We have a support area at the lower limit of the channel at 0.3800, acting as strong support from which the price can rebound.
Entry price: 0.4664
First target: 0.5115
Second target: 0.5579
Third target: 0.6248
To manage risk, don't forget stop loss and capital management.
When you reach the first target, save some profits and then change the stop order to an entry order.
For inquiries, please comment.
Thank you.

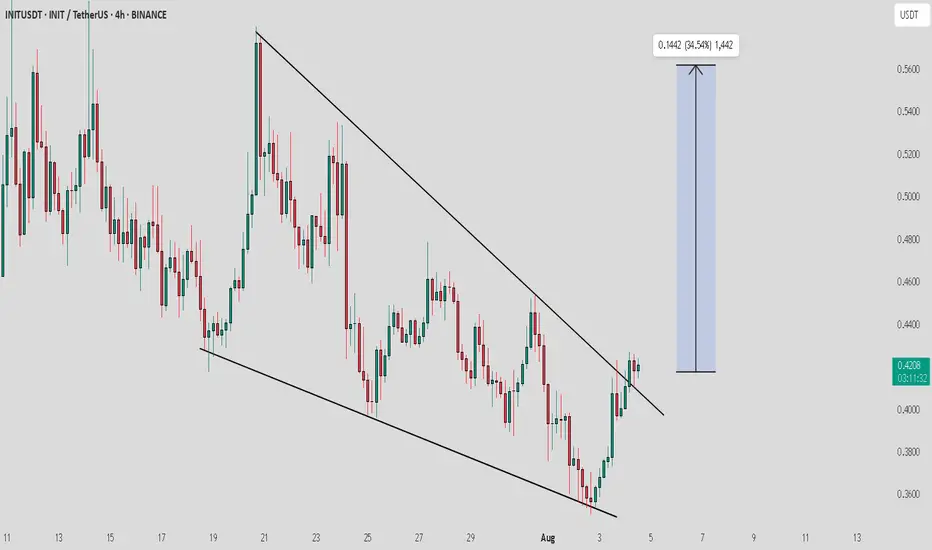
INIT/USDT Potential Bullish Reversal After Falling Wedge Break📊 Chart Pattern & Structure
Descending Trendline (Yellow Line): From early May to late June, INIT/USDT formed consistent lower highs and lower lows, creating a strong downtrend structure.
Accumulation Phase: In late June, the price consolidated around the $0.40 – $0.48 range, forming a base and is now attempting a breakout above the descending trendline.
Key Horizontal Resistance Levels (Yellow Dashed Lines):
$0.5843
$0.6421
$0.7546
$0.9193
$1.1766
$1.3828
🚀 Bullish Scenario
If INIT confirms a breakout above the descending trendline, it signals a potential trend reversal from bearish to bullish momentum.
📌 Short to Mid-Term Bullish Targets:
1. $0.5843 – Initial resistance.
2. $0.6421 – Previous support/resistance zone.
3. $0.7546 – Strong resistance with historical significance.
4. $0.9193 – $1.1766 – Mid-term upside targets.
5. $1.3828 – $1.4477 – Long-term target and previous high zone.
📈 Bullish Confirmation Signs:
Increased breakout volume.
Successful retest of the trendline as support.
🐻 Bearish Scenario
If the breakout fails and price falls back below the trendline:
⚠️ Possible Downside Risks:
Rejection back to the $0.4200 – $0.4800 range.
If $0.4200 breaks, price may retest deeper support around $0.3500 – $0.3000.
Breakdown below $0.3000 could lead to a move toward $0.2600 (historical demand).
📐 Pattern Analysis
Falling Wedge / Descending Channel: A typical bullish reversal pattern.
The breakout indicates accumulation and potential impulse movement to the upside.
Aligns with the beginning of a new Elliott Wave cycle (Wave 1 formation).
📝 Strategy Summary
Bullish Setup: Look for a pullback to retest the trendline for a potential long entry, targeting resistance levels step by step.
Bearish Setup: Watch out for a false breakout followed by a breakdown back below the trendline.
#INIT #INITUSDT #CryptoBreakout #FallingWedge #AltcoinAnalysis #TrendReversal #TechnicalAnalysis #CryptoTrading #BullishSetup #CryptoSignals #PriceAction

Init Bearish Entry recently experienced notable bearish momentum
actively interacting with critical liquidity and order flow areas.

$INIT - Long Trade IdeaBINANCE:INITUSDT | 4h
Scaling into long here at cmp, dca around .72-.70
Stoploss: below .64
Targets:
.78-.82
.87-.94
$1 - 1.07

INIT SHORT RESULT Price is still in a major Falling channel as at when trade was executed and also in an overall bearish trend.
Was at the high of the resistance Trendline with low volume and price dumped down as expected.🔥👌
_THE_KLASSIC_TRADER_.

$INITUSDT Breakout AlertINIT just broke out of a falling wedge, a strong bullish signal.
Targeting a 58% move toward $1.4488.
Momentum looks solid. Watch for follow-through!
DYOR. Not financial advice.

INITUSDT 4H AnalysisINIT ~ 4H Analysis
#INIT This trade is very high risk
Buy gradually from here with a short-term target of at least 10%++ from here.

INIT – Missed the Move, Still Watching
Missed the entire move on INIT, but I still see a possible entry.
Will be waiting for prices closer to $1 in the coming weeks.
If it keeps pushing higher, I’ll just sit back and let it go. No chase here.


INIT – The New TIA? 🚀 INIT – The New TIA? 👀
OMXSTO:INIT just broke through key resistance and is now retesting the breakout zone with strength.
Current price: $1.31
Next major level: $1.58 📈
🧠 With a clean structure and explosive momentum, INIT is starting to look like the early days of TIA.
Could this be the next big thing in the altcoin space?
🔁 A healthy retest of the $1.00–$1.10 zone could offer one of the best R/R setups this cycle.
⚠️ Not financial advice, but definitely something to keep on your radar.

Init bullish gartley still in tactSpotted this bullish gartley on init. Had good reaction at the D leg. Still intact. As you can see it’s not totally perfect but is very close so should be a powerful harmonic structure.
