There is a trading opportunity to buy in IOSTETHTechnical analysis:
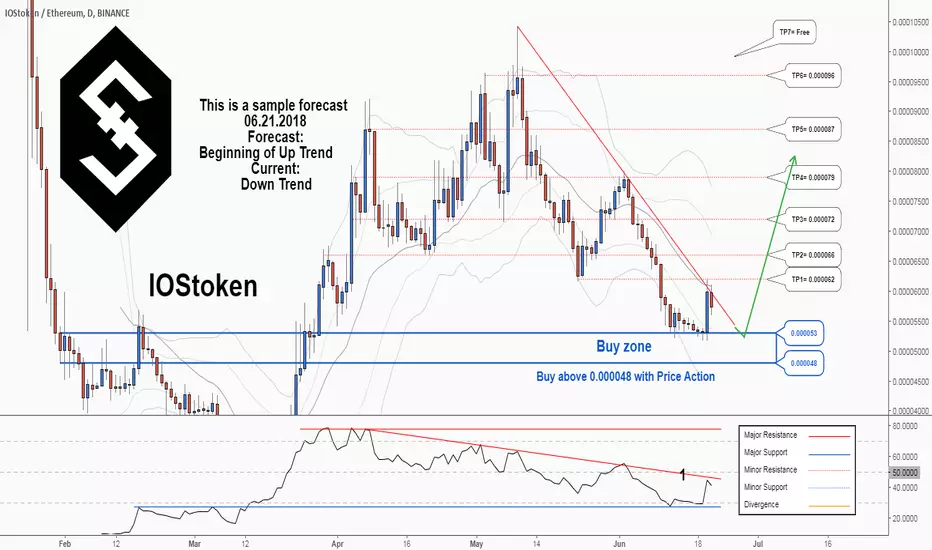
. IOSTOKEN/ETHEREUM is in a downtrend and beginning of uptrend is expected.
. The price is below the 21-Day WEMA which acts as a dynamic resistance.
. The RSI is at 40.
. While the RSI downtrend #1 and the price downtrend in daily chart is not broken, bearish wave in price would continue.
Trading suggestion:
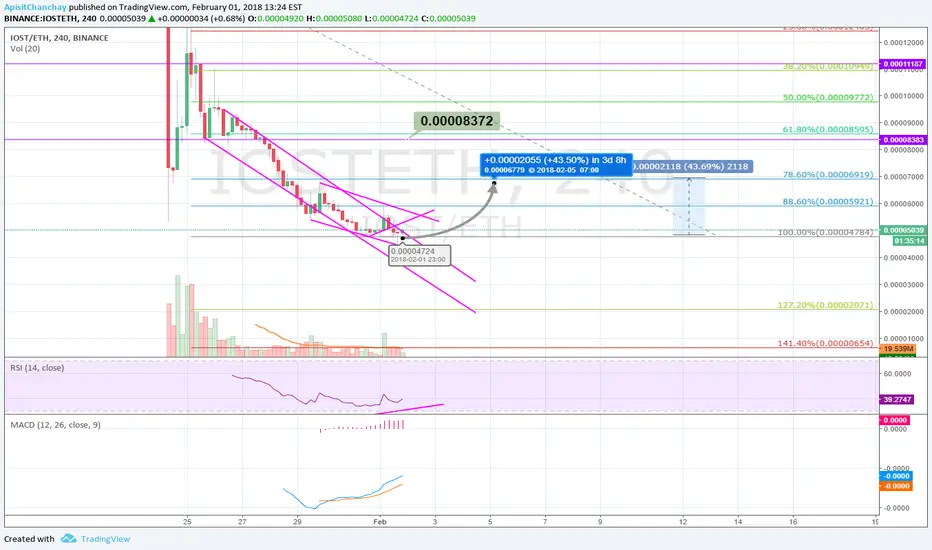
. The price is in a downtrend and we forecast the uptrend would begin.
. There is a possibility of temporary retracement to suggested support zone (0.000053 to 0.000048). if so, traders can set orders based on Price Action and expect to reach short-term targets.
Beginning of entry zone (0.000053)
Ending of entry zone (0.000048)
Entry signal:
Signal to enter the market occurs when the price comes to "Buy zone" then forms one of the reversal patterns, whether "Bullish Engulfing" , "Hammer" or "Valley" in other words,
NO entry signal when the price comes to the zone BUT after any of reversal patterns is formed in the zone.
To learn more about "Entry signal" and the special version of our "Price Action" strategy FOLLOW our lessons:
Take Profits:
TP1= @ 0.000062
TP2= @ 0.000066
TP3= @ 0.000072
TP4= @ 0.000079
TP5= @ 0.000087
TP6= @ 0.000096
TP7= Free
Market insights
There is a trading opportunity to buy in IOSTETHTechnical analysis:
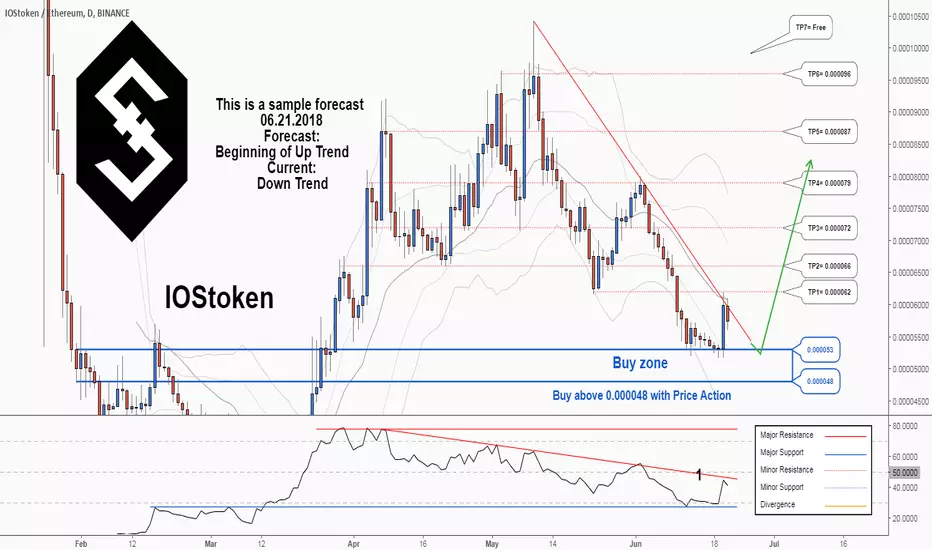
. IOSTOKEN/ETHEREUM is in a downtrend and beginning of uptrend is expected.
. The price is below the 21-Day WEMA which acts as a dynamic resistance.
. The RSI is at 40.
. While the RSI downtrend #1 and the price downtrend in daily chart is not broken, bearish wave in price would continue.
Trading suggestion:
. The price is in a downtrend and we forecast the uptrend would begin.
. There is a possibility of temporary retracement to suggested support zone (0.000053 to 0.000048). if so, traders can set orders based on Price Action and expect to reach short-term targets.
Beginning of entry zone (0.000053)
Ending of entry zone (0.000048)
Entry signal:
Signal to enter the market occurs when the price comes to "Buy zone" then forms one of the reversal patterns, whether "Bullish Engulfing" , "Hammer" or "Valley" in other words,
NO entry signal when the price comes to the zone BUT after any of reversal patterns is formed in the zone.
To learn more about "Entry signal" and the special version of our "Price Action" strategy FOLLOW our lessons:
Take Profits:
TP1= @ 0.000062
TP2= @ 0.000066
TP3= @ 0.000072
TP4= @ 0.000079
TP5= @ 0.000087
TP6= @ 0.000096
TP7= Free
IOST 07—22I think, iost will go up.
TA support:
1.Volume is very strong.
2.MACD broke the horizon line.
3.The candle closed price above the MA50
4.OBV indicator looks positive!

IOST/ETH 1H Charts RSI Divergence & MACD CrossoverAs title says, we're seeing an RSI Divergence on a 1H time scale.
Also seeing a MACD Crossover, which will strength once it crosses zero line.

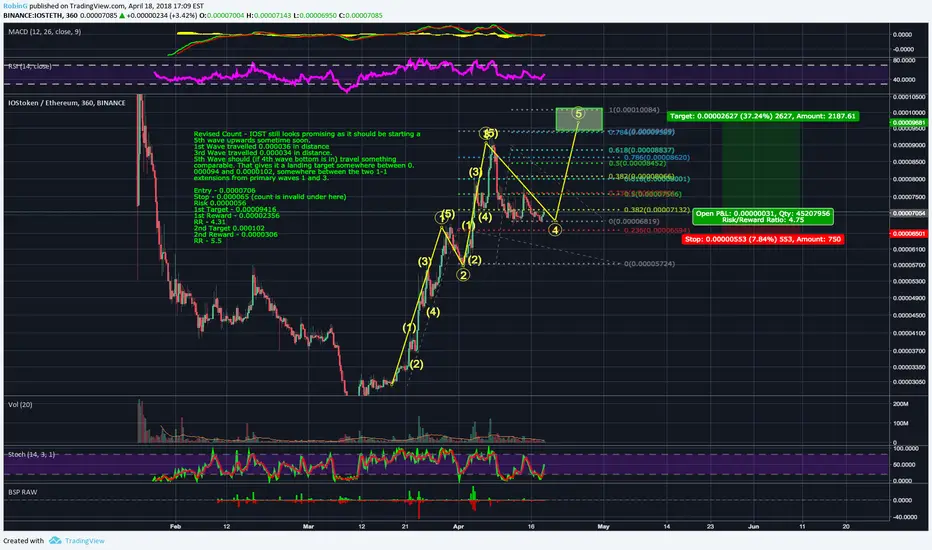
IOSTETH - Revised Count - Still pending wave 5Revised Count - IOST still looks promising as it should be starting a 5th wave upwards sometime soon.
1st Wave travelled 0.000036 in distance
3rd Wave travelled 0.000034 in distance.
5th Wave should (if 4th wave bottom is in) travel something comparable. That gives it a landing target somewhere between 0.000094 and 0.0000102, somewhere between the two 1-1 extensions from primary waves 1 and 3.
Entry - 0.0000706
Stop - 0.000065 (count is invalid under here)
Risk 0.0000056
1st Target - 0.00009416
1st Reward - 0.00002356
RR - 4.31
2nd Target 0.000102
2nd Reward - 0.0000306
RR - 5.5
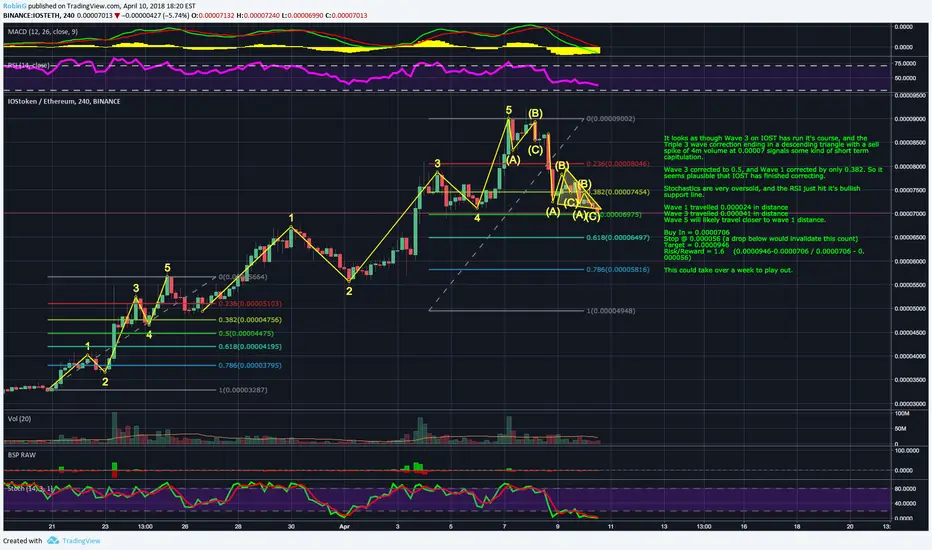
IOSTETH - Possible 4th wave completion with triangle formation. It looks as though Wave 3 on IOST has run it's course, and the Triple 3 wave correction ending in a descending triangle with a sell spike of 4m volume at 0.00007 signals some kind of short term capitulation.
Wave 3 corrected to 0.5, and Wave 1 corrected by only 0.382. So it seems plausible that IOST has finished correcting.
Stochastics are very oversold, and the RSI just hit it's bullish support line.
Wave 1 travelled 0.000024 in distance
Wave 3 travelled 0.000041 in distance
Wave 5 will likely travel closer to wave 1 distance.
Buy In = 0.0000706
Stop @ 0.000056 (a drop below would invalidate this count)
Target = 0.0000946
Risk/Reward = 1.6 (0.0000946-0.0000706 / 0.0000706 - 0.000056)
This could take over a week to play out.
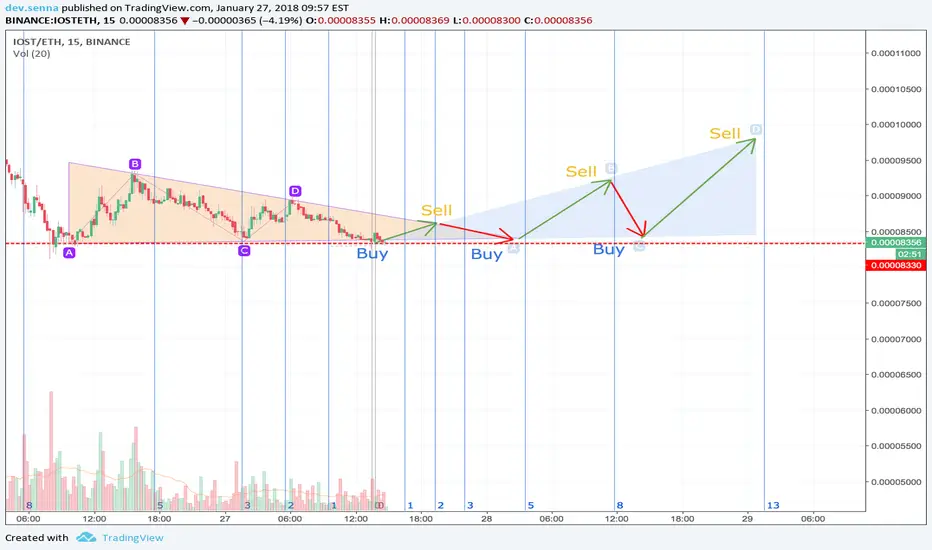
IOSToken ETH Bullish Cypher? Point A, B and C all established in this bullish cypher, but where does D go ?
IOSToken has been trading well, a nice low coin which if shoots could give some good return. Except pump n dumpers jump in, trading activity is quite good?
Yellow or Gray cypher - your thoughts?
@bizlus

$IOST/ $ETH @ #Binance - Hourly, formed a good corner pivot$IOST/ $ETH @ #Binance - Hourly, formed a good corner pivot, with vols backing, Looks Bullish IMO, may test median line soon...wait for confirmation to go long.
GL

IOST/ETH Target 0.00009868I am not a financial advisor and the views expressed are my opinion. I am posting this for educational purposes and I am not instructing you on whether to buy or sell IOST, or giving financial advise: I expected a sell-off due to the nature of the "Big announcement". The dump is due to people who have bought in "just in case" the price rocketed. Rumours had been circulated on social media that Apple was going to partner with IOST. This obviously created a lot of FOMO and if a merchant like Apple or Amazon were going to consider this the first stage would be a proof of concept trial (POC). We must also take into account the fact that the Binance are currently running a competition and will be giving away 5 million IOST to the winners. To win a share of the prize pool you have to have a minimum of 100,000 IOST in your wallet at the close of the competition on April 13th 00:00AM UST. The competition was announced on the 4th April and commenced 7th April 00:00AM UST 0.72% which accounts for the significant increase in volume and price on those 2 dates. If we take these elements out of the equation IOST was on a consistent uptrend and was performing extremely well. This project has a great team, has made significant progress in achieving their roadmap. The project received seed funding from three VC -1.22% firms. If you are not familiar with how venture capital works this type of investment takes place based on a 5 to 10 year strategy. In many cases the investment is made with the expectation it will not reach maturity for 8 to 10 years. This is why I have invested heavily in IOST and am taking a long position. We can expect another sell-off at the end of the Binance competition, however, I am not concerned by this at all. The trades I am making at the moment are to enable me add more IOST to my portfolio and capitalize on compounding. Feedback is always appreciated. Thank you for looking at my chart and good luck in your trading.

Short term IOST valuationIn the chart we see that the support line is at 0.00004600 ETH for IOST. I predict that it will move towards 0.00005250 within the next 24 hours.

descending triangle IOST 1 hourdescending triangle on the IOST 1 hour. expecting a break out to the upside.

IOST Moving Up4 Hour broke out of the wedge that formed yesterday making a new high. currently on a pull back. 2 key resistances need to be broken and closed above going forward. First resistance at around 0.00004810 ETH.
Buy zone around 0.00004500 - 0.00004600 ETH
This is a long term investment. No targets.

IOST Break Out? Wedge FormingWedge forming on 4 hour / daily on IOST cryptocurrency currently ranked #79 for marketcap.

IOST Breakout Imminent Should BTC sustain its level and continue upwards, IOST has massive potential for a breakout that continues past all-time-highs. As of this writing it is not too far above its ICO value, and its price is low and undervalued due to all the market chaos that has happened in the past few weeks. Accumulate now, as we may never see these prices again.

End of FUD?Chart says it all. This is the first decent uptrend of IOST/ETH. Long until BTC/USD hits 10K.

LONGIOST/ETH has broken through all the resistance levels I have plotted. Both diagonal and horizontal channels. Above the 4hr 50SMA and 1hr 200SMA. This suggests consolidation has ended and bulls have taken control. Target 15c.

IOSTETH / shortterm triangle trading0.0008324 looks like the baseline for now.
From the red line (0.0008324), the price will probably jump and hit the top of the blue triangle,
and It will gradually gain a momentum to hit higher price following the Fib Time Zone.
Before dramatic trading volume increase (of total crypto market),
keeping short-term trading is not a bad idea.

short term triangle trading0.0008324 looks like the baseline for now.
From the red line (0.0008324), the price will probably jump and hit the top of the blue triangle,
and It will gradually gain a momentum to hit higher price following the Fib Time Zone.
Before dramatic trading volume increase (of total crypto market),
keeping shortterm trading is not a bad idea.
IOST EMA 55 strategy If the EMA 55 strategy works... IOST will raise as soon at the EMA's go Yellow (9), Red (18), White(21), Blue (55) (in that order) There will be a price spike. Somewhere between 6 - 12 AM there should be a price spike. I'm interested to see if the strategy works. Granted, this is on a 15 min candle.... which is less accurate than say a 4 hour window, I think there will be some gains to be made. Hopefully it will at least reach the previous high around .000145 or higher.


Consolidation; Support at .0008Chart shows support at .0008; expect a breakout if volume picks up. Set stop around .00075.

