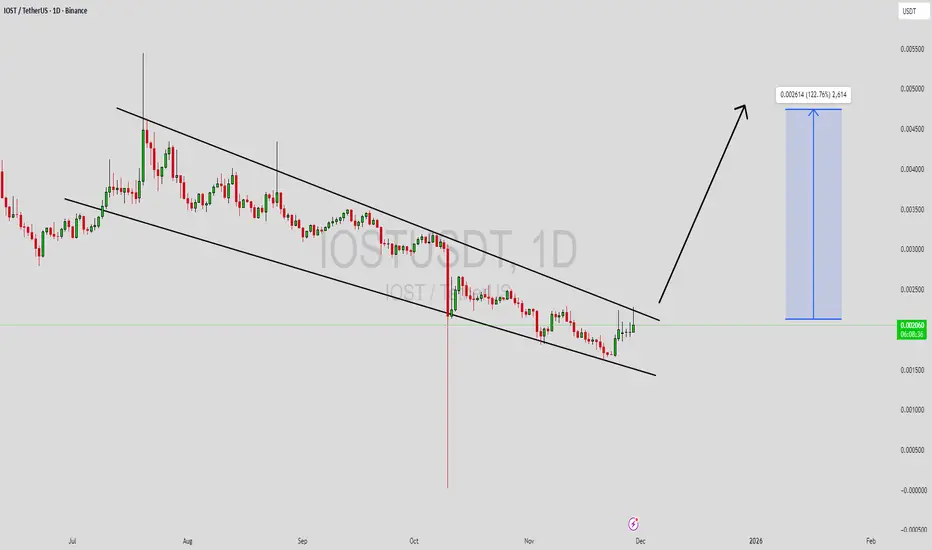
IOSTUSDT Forming Falling WedgeIOSTUSDT is forming a clear falling wedge pattern, a classic bullish reversal signal that often indicates an upcoming breakout. The price has been consolidating within a narrowing range, suggesting that selling pressure is weakening while buyers are beginning to regain control. With consistent volum
Related pairs

IOTXUSDT Sell/Short Signal (15M)Considering that the sell orders of the 4-hour order block have been absorbed, we can expect an internal pullback on lower timeframes.
The entry zone and targets are marked on the chart.
After the first target is reached, secure partial profits and then move the stop loss to breakeven
Do not ente

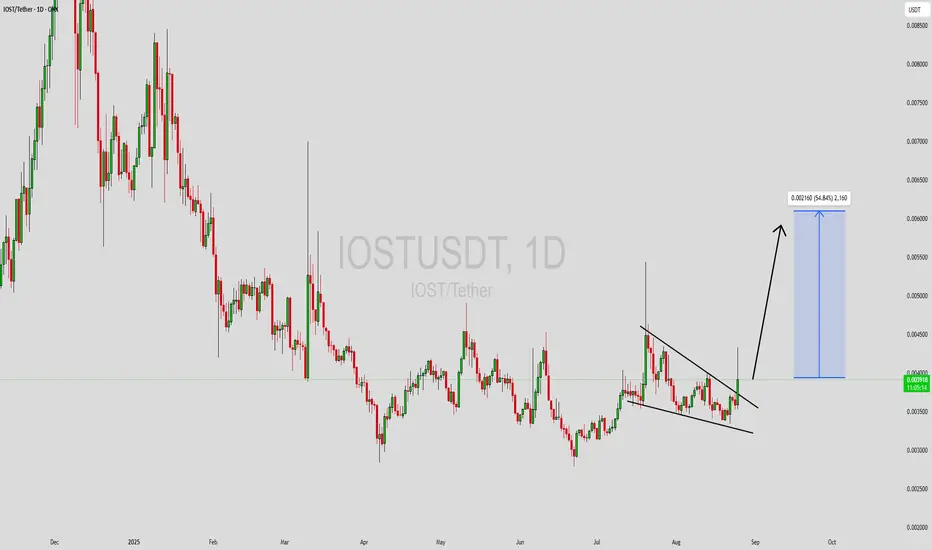
IOSTUSDT UPDATE#IOST
UPDATE
IOST Technical Setup
Pattern: Falling Wedge Pattern
Current Price: $0.00205
Target Price: $0.00368
Target % Gain: 80.65%
Technical Analysis: IOST is breaking out of a falling wedge pattern on the 1D chart, indicating strong bullish reversal potential. Price has pushed above the des

ORCAUSDT Forming Falling WedgeORCAUSDT is forming a clear falling wedge pattern, a classic bullish reversal signal that often indicates an upcoming breakout. The price has been consolidating within a narrowing range, suggesting that selling pressure is weakening while buyers are beginning to regain control. With consistent volum
IOSTUSDT Forming Falling WedgeIOSTUSDT is forming a clear falling wedge pattern, a classic bullish reversal signal that often indicates an upcoming breakout. The price has been consolidating within a narrowing range, suggesting that selling pressure is weakening while buyers are beginning to regain control. With consistent volum

IOSTUSDT 1D#IOST is on the verge of breaking above the descending resistance and the SMA50 on the daily chart. RSI and MACD indicate the possibility of further bullish momentum. Keep an eye on it. If a breakout confirms, the potential upside targets are:
🎯 $0.002331
🎯 $0.002555
🎯 $0.002778
🎯 $0.003095
🎯 $0.00

IOSTUSDT Forming Falling WedgeIOSTUSDT is forming a clear falling wedge pattern, a classic bullish reversal signal that often indicates an upcoming breakout. The price has been consolidating within a narrowing range, suggesting that selling pressure is weakening while buyers are beginning to regain control. With consistent volum
IOST From 10 Jul to 08 Oct 2025 $3MM BuybackIOST has initiated a $3M USD buyback program as part of their ongoing commitment to ecosystem strength and growth.
Thats pure Bullish signal

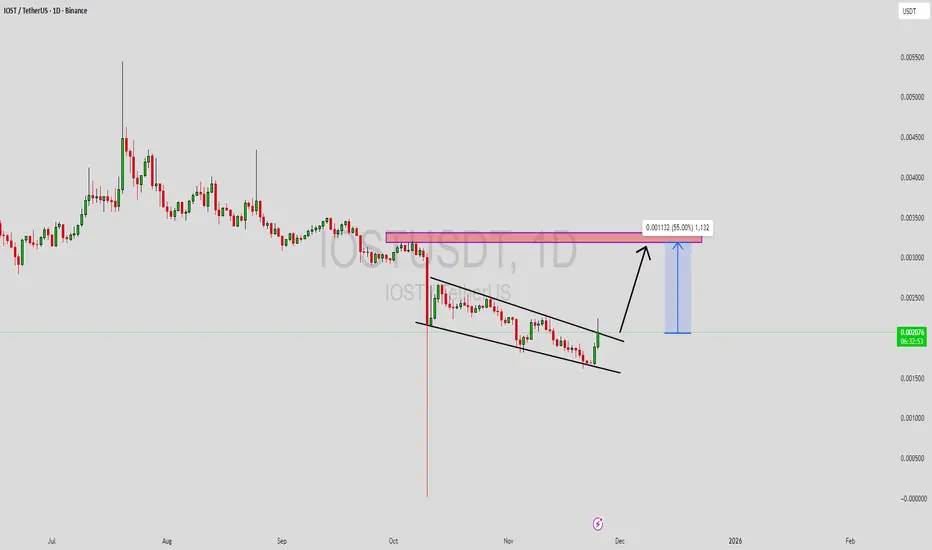
IOSTUSDT — At a Major Crossroad: Accumulation or Breakdown?🔎 Overview
IOST is currently trading inside a multi-year demand zone (0.0024–0.0037) which has repeatedly acted as a strong support since 2019. Each touch of this area has been met with buying interest, leaving long rejection wicks and suggesting hidden accumulation.
However, the broader market st
IOSTUSDT Forming Descending TriangleIOSTUSDT is currently trading within a descending triangle pattern, a setup that often signals a potential breakout move when accompanied by strong trading volume. The price action has been consolidating near a crucial support zone, while sellers are gradually losing momentum, creating an opportunit
See all ideas
Summarizing what the indicators are suggesting.
Oscillators
Neutral
SellBuy
Strong sellStrong buy
Strong sellSellNeutralBuyStrong buy
Oscillators
Neutral
SellBuy
Strong sellStrong buy
Strong sellSellNeutralBuyStrong buy
Summary
Neutral
SellBuy
Strong sellStrong buy
Strong sellSellNeutralBuyStrong buy
Summary
Neutral
SellBuy
Strong sellStrong buy
Strong sellSellNeutralBuyStrong buy
Summary
Neutral
SellBuy
Strong sellStrong buy
Strong sellSellNeutralBuyStrong buy
Moving Averages
Neutral
SellBuy
Strong sellStrong buy
Strong sellSellNeutralBuyStrong buy
Moving Averages
Neutral
SellBuy
Strong sellStrong buy
Strong sellSellNeutralBuyStrong buy
Displays a symbol's price movements over previous years to identify recurring trends.
Frequently Asked Questions
The current price of IOST/USDT (IOST) is 0.001546 USDT — it has fallen −0.52% in the past 24 hours. Try placing this info into the context by checking out what coins are also gaining and losing at the moment and seeing IOST price chart.
IOST/USDT price has fallen by −3.16% over the last week, its month performance shows a −6.42% decrease, and as for the last year, IOST/USDT has decreased by −75.05%. See more dynamics on IOST price chart.
Keep track of coins' changes with our Crypto Coins Heatmap.
Keep track of coins' changes with our Crypto Coins Heatmap.
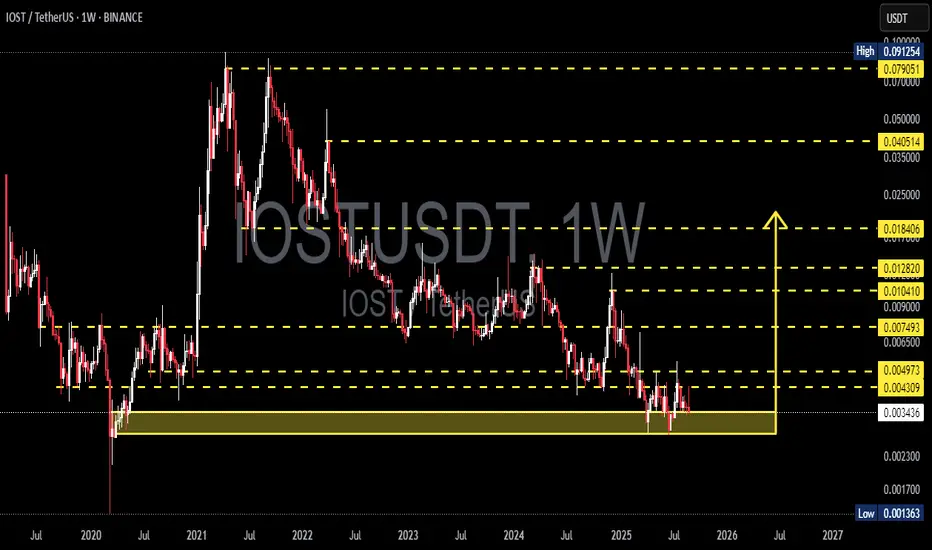
IOST/USDT (IOST) reached its highest price on Apr 14, 2021 — it amounted to 0.091361 USDT. Find more insights on the IOST price chart.
See the list of crypto gainers and choose what best fits your strategy.
See the list of crypto gainers and choose what best fits your strategy.
IOST/USDT (IOST) reached the lowest price of 0.001076 USDT on Oct 10, 2025. View more IOST/USDT dynamics on the price chart.
See the list of crypto losers to find unexpected opportunities.
See the list of crypto losers to find unexpected opportunities.
The safest choice when buying IOST is to go to a well-known crypto exchange. Some of the popular names are Binance, Coinbase, Kraken. But you'll have to find a reliable broker and create an account first. You can trade IOST right from TradingView charts — just choose a broker and connect to your account.
Crypto markets are famous for their volatility, so one should study all the available stats before adding crypto assets to their portfolio. Very often it's technical analysis that comes in handy. We prepared technical ratings for IOST/USDT (IOST): today its technical analysis shows the sell signal, and according to the 1 week rating IOST shows the sell signal. And you'd better dig deeper and study 1 month rating too — it's sell. Find inspiration in IOST/USDT trading ideas and keep track of what's moving crypto markets with our crypto news feed.
IOST/USDT (IOST) is just as reliable as any other crypto asset — this corner of the world market is highly volatile. Today, for instance, IOST/USDT is estimated as 3.18% volatile. The only thing it means is that you must prepare and examine all available information before making a decision. And if you're not sure about IOST/USDT, you can find more inspiration in our curated watchlists.
You can discuss IOST/USDT (IOST) with other users in our public chats, Minds or in the comments to Ideas.