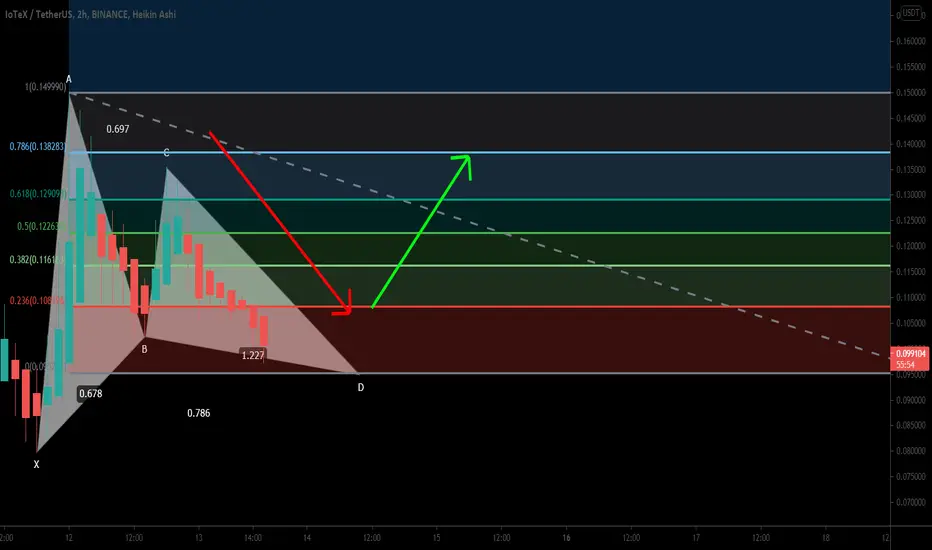
IoTeX (IOTX) coin formed bullish Gartley for upto 45.5% moveHi dear friends, hope you are well and welcome to the new update on IoTeX (IOTX) coin.
Previously we had a nice trade of IOTX:
Now on a very small time frame 2-hourly time frame chart, the priceline of IOTX has formed bullish Gartley pattern.
IOTXUSDT.P trade ideas
IOTX ready to break, nice chance for 3-6% scalpif it break downwards it can be good 3-6% short. so break and confirmation is important here : )
so buy break carefully and DCA take profits.
As volumes are back we can expect buyers buying support or large sells drag down if they exist.
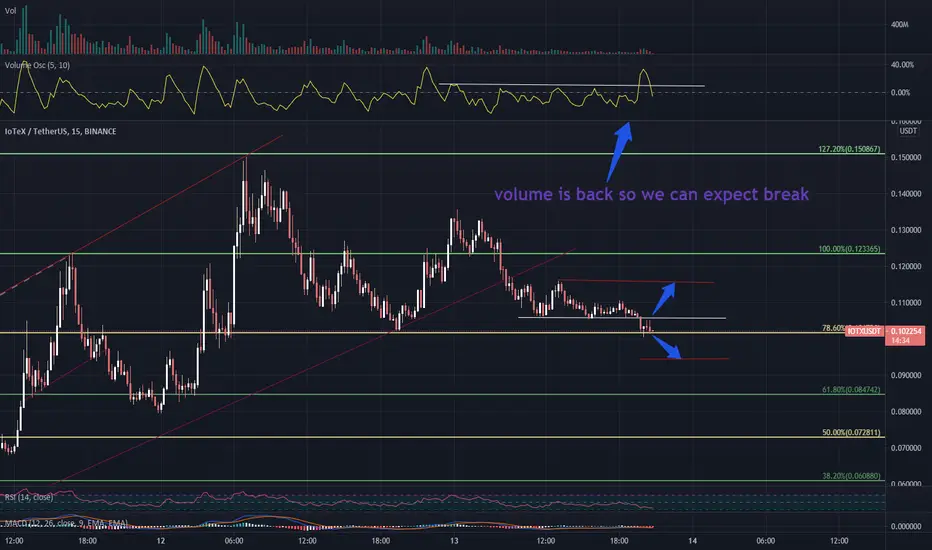

IOTX ready to break fib resistance as volume is backInterest is back as volume oscillator showing spikes at resistance .
get ready to buy the break (have tight entry exit idea, as fake-out can be fatal)
Retesting ATH is highly possible, so DCA buy sell carefully.
if it didn't break resistance it will be likely to heading support for retest.
Good luck

IOTXUSDT - Long - Potential 37.18%IOTXUSDT - Long - Potential 37.18%
Exchanges: Binance, Bittrex, Huobi.pro, KuCoin
Signal Type: Regular (Long)
Entry Zone:
0.094283 - 0.107707
Take-Profit Targets:
1) 0.113899
2) 0.122369
3) 0.147781
Stop Targets:
1) 0.082691
Entry Trigger - Golden Cross,

IOTXSUDT BROADENING DESC. TRIANGLE Iotx has been a great coin with high potientials since the offset of the month of august. After a wide consolidation that happened for months, iotx has spiked up to hit the regular target of the ascending trendline. At the moment, iotx has bounced with over 400% ROI but the specified target is inevitable for iotx. Price has risen to a certain level to retest the previous ath which was successful and we saw price bounced from the new support zone. The main target has been listed on chart. For any entry above this support zone put a stop loss underneath the previous ATH.
Your likes and opinions would be much appreciated, you can follow up for more helpful contents and do follow my comment sections too for quick updates.

Intraday Trade - IOTXUSDT - LONG POSITIONPrice is resting on the pivot level R3, which has become a good support for now, price is likely to move up as 1day chart is in strong bull position.

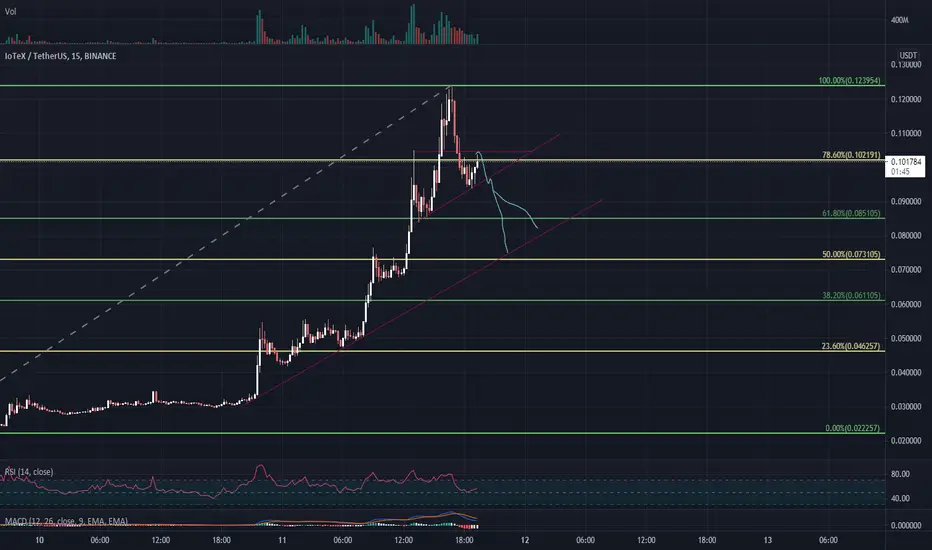
IOTX HEAD AND SHOULDERS WITH FIB LVLS IOTX ROSE 260% , its time to return to earth or break fib lvl at (0.105) and retest ATH (possible like AXS) . but it will retest support in near future so shorting here can be good option or wait it to break (0.105) good luck
IOTX Channel with Upper and Lower limitsThis is a curved projection channel created upon a bounding box. The chart is presented over a log price scale. For its creation we use 3 "moving averages" that cover the center, upper and lower boundaries for potential movement. Even if this not an attempt to forecast a trend or future scenario, it allows to have an easy to read view of probable limits and oscillation parameters.
I have added a dotted path that represents a correction to the uptrend movement, but has weak fundamentals to support it. It's rooted onto the idea that the upper curved channel reached a limit and has to correct first, then later attempt to keep the bull route.
Just sharing my personal charts for learning purposes only. This is not an investment recommendation.

IOTX MOON WITH 200 % WHAT IS NEXT? AND 0.14 possible TargetHello trading friends,
Is IOTX going to show a new huge increase to 0,14+ we expect Yes, IOTX is not a coin of just now, it's a coin that has a value?
IOTX can show into next rise a possible increase to 0,14+
we did update about it before

IOTX - TO THE MOON 0,14+ - ALL IOTX TARGETS HITIOTX did hit all our before targets, and on way to possible target of 0,14+

IOTXUSDTIOTXUSD 1days/candle chart review. updated outlook still valid today. end of 2021 PT BULLS 20 cents. 800-1000% UPSIDE BUY LOW. MARKET BUY / ACCUMULATE. overall strong chart/ V-shape recovery. chart is LOG SCALE .get ready to BUY LOW later .market buy // buy dips / pullbacks already bottomed out .up to 1000% gains possible later. short-term pullback/correction .correction/pullback NOW .however chart looks strong. TP bulls is +1000% gains .FINAL TP is 1000% gains . recommended strategy: BUY/HOLD at MARKET. bull run not over yet.

IOTX Back to ATHIOTX(IOTEX) is now consolidating at the bottom of trendline ready for breakout to the upside!
This currency is highly undervalued atm and has a 4-5x potential back to ATH and more.
Nearby bullish events : Covid 19 has delayed the release of pebble tracker due to lack of electronic components. As the world opens up we should be closer to release.
Pebble tracker info www.youtube.com

IOTXUSDT 1-Hour Timeframeinternet of thing
break-out previous strong daily resistant
testing support and working good
retrace on 50% and 1-2-3 famously pattern
another bullish movement

IOTXUSDT Daily TimeframeBreak the immediate Daily R + Reversal?
Time to join in?
Safe entry - watch the first retracement

IOTXUsdt in End cycle now rdy GoingUPFIRST SORRY FOR BUSY CHART ITRY SHOW YOU WHY I THINK GOING UP WITH CHART
IOTX have great chanse for moving UP
Green line flash is bad scenario . dont going UP sooner last with that cycle going up
this support point show you BTC Fall you can Enter point this coin fall
for this more suppor tpoint i show all Supports for leverage gys
Support:
0.019975 Enter Point
0.018392 Sec enter point
0.017176
0.016038
0.014559
Resisdance:
0.022923
Taregts :
0.027391
0.032717
0.042136
Mid time Targets or for HODL :) :
0.058140
0.087526
0.108360
0.147242
GOAL:
0.261411
GL GUYS

Iotx usdt Buy in correction it is getting ready for another one be patiant
Set stop loss
Short midterm


IOTXUSDT bounced on weekly support 🦐IOTXUSDT bounced on weekly support and the price created a W.
At the moment the price is testing the daily resistance.
IF the price will have a breakout from it, and flip the current resistance into new support, According to Plancton's strategy (check our Academy), we can set a nice order
–––––
Follow the Shrimp 🦐
Keep in mind.
🟣 Purple structure -> Monthly structure.
🔴 Red structure -> Weekly structure.
🔵 Blue structure -> Daily structure.
🟡 Yellow structure -> 4h structure.
⚫️ Black structure -> <4h structure.
Here is the Plancton0618 technical analysis, please comment below if you have any question.
The ENTRY in the market will be taken only if the condition of the Plancton0618 strategy will trigger.


IOXTUsdt i think BTC not fall big PUMPIOTXUsdt have great chanse for little BTC rang or up this coin great move so you can see both scenario short adn long with flash on chart but this about long scenario for Frinds
Support :
0.018369(first EnterPoint)
0.016890 (Sec EnterPoint)
0.015226 Target for shrot when BTC Fall
0.014259(SecTargets for Short)
0.012873
Resisdance is :
0.019975
After Break this can great Pump
Taregts is :
0.022507
0.026190
0.031757
0.035120
mid time targets and not BTC fall can happen this weak for you
0.040601
0.053190
long time or Big Pump :
0.064498
0.082386
GL Frinds
after BTC little move up
IOTX have big chanse for Pump
adn got great Profit

IOTX Going to break resistance after little correctionIOTX mainnet V1.3 going live this week , good news for IOTX also have a good chart.
