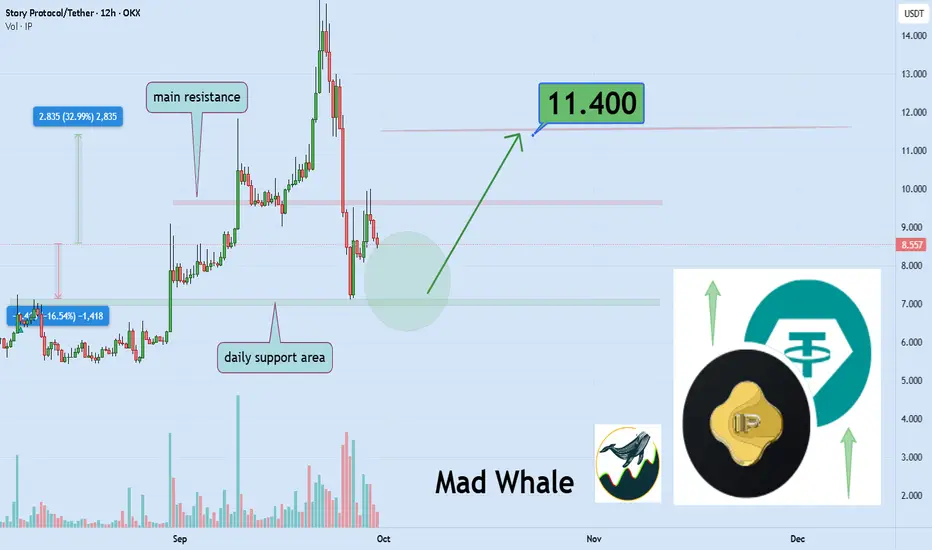
Story IP Testing Key Support, Could Surge 32% Target 11.4$Hello✌️
Let’s analyze Story’s price action both technically and fundamentally 📈.
🔍Fundamental analysis:
Story (IP) is pushing into tokenized AI training data and winning big partners.
Institutions are noticing, but weak on-chain revenue raises some valuation doubts.🧩📊
📊Technical analysis:
OKX:IPUSDT is testing a key daily support; holding this zone could trigger a 32% rally, targeting $11.40. 📈🛡️
📈Using My Analysis to Open Your Position:
You can use my fundamental and technical insights along with the chart. The red and green arrows on the left help you set entry, take-profit, and stop-loss levels, serving as clear signals for your trades.⚡️ Also, please review the TradingView disclaimer carefully.🛡
✨We put love into every post!
Your support inspires us 💛 Drop a comment we’d love to hear from you! Thanks, Mad Whale
IPUSDT.3S trade ideas
IPUSDT: short setup from daily support at 8.378A very sharp decline in the BINANCE:IPUSDT.P was stopped at the 8.414 level.
Usually, the natural reaction to such a drop is a correction, but we are not observing one here.
It is precisely this lack of a correction that is drawing my attention.
On the downside (for a short scenario), there is a consolidation zone that formed from Aug 30th to Sept 7th, which is a heavy area that could be difficult to break through.
Additionally, the asset has already covered a significant distance today, and there might simply not be enough energy left for a breakout.
Therefore, I will be watching very closely how exactly the price approaches this level.
Key factors for this scenario
Correlation with the market
Volatility contraction on approach
Momentum stall at the level
No reaction after a false break
Was this analysis helpful? Leave your thoughts in the comments and follow to see more.
IP Sell/Short Setup (12H)A key trendline has been broken, and on the chart, along with a bearish CH, we’ve also seen a sweep of a support zone.
The price is expected to drop downward upon reaching the order block.
The target could be the green line.
A candle closing above the invalidation level would invalidate this analysis.
For risk management, please don't forget stop loss and capital management
When we reach the first target, save some profit and then change the stop to entry
Comment if you have any questions
Thank You

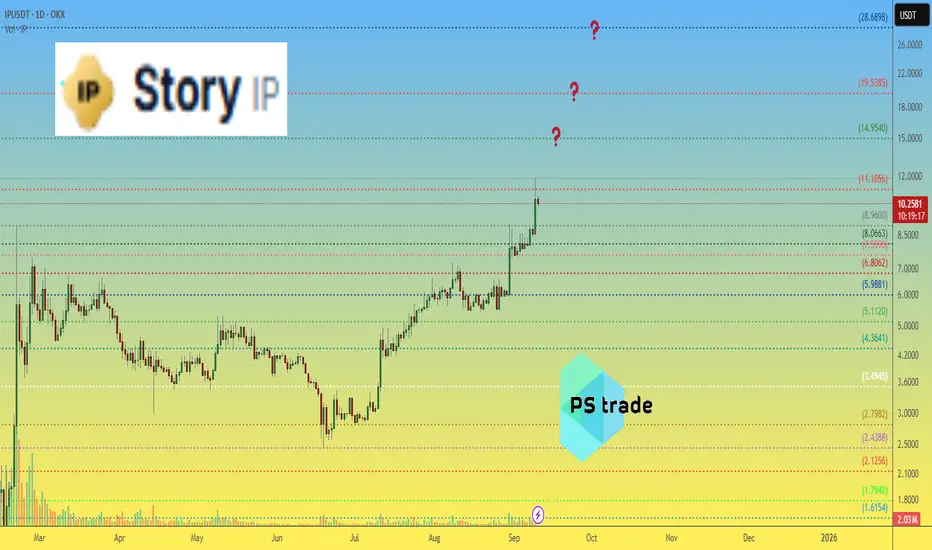
Story IP price analysisThe price action of #IP suggests there may be room for another upward leg 🚀
Key question for OKX:IPUSDT :
▪️ Is momentum strong enough to push toward $15, $20, or even $28?
Market context: at a current price slightly above $10, the Story project is already valued at $3.1B market cap.
❓ Where do you see the next realistic target for IP?
______________
◆ Follow us ❤️ for daily crypto insights & updates!
🚀 Don’t miss out on important market moves
🧠 DYOR | This is not financial advice, just thinking out loud.
STORY PROTOCOL $IP ... Still has room to the upside!In this fast moving price action.
In theory dips could still be bought for further upside if Ethereum obliges and resumes it's Bull market.
This was a beautiful inverse head and shoulders setup.... apologies for only sharing it now.
I just saw this chart / coin a few mins ago.
Hope this helps a few people in a long.
Cheers.

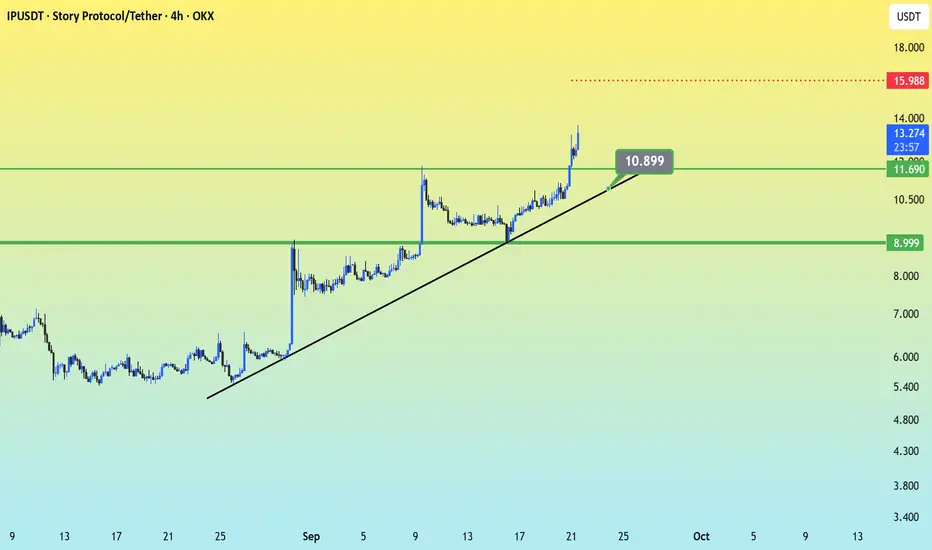
IP Breaks $11.7 – Is $16 the Next Target?Price action is forming a parabolic curve, suggesting aggressive buyer interest.
IP/USDT has shown strong bullish momentum, breaking above the $11.69 resistance and extending toward $13.25. The ascending trendline from recent lows remains intact, highlighting sustained buying pressure.
Support Levels: $11.69 (newly flipped support) and $8.99 – both zones are crucial to maintain the bullish structure.
Immediate Resistance : $15.98 – a breakout above this level could open the way toward higher highs.
Trend Outlook : As long as IP holds above $11.69, momentum favors the bulls with potential continuation toward $16. A pullback into $11.7 may offer a retest buying opportunity.
IP BEARISH IP needs correction for a healthy growth and I do think that you should've taken some profit

IP/USDT Bounced to 0.382fibbMy Journal Entry #3.
After an intraday shorting, BINANCE:IPUSDT.P bounced at 382 Fibb, I have changed my bias to long and targeting 16 area.
Im hoping it retraces abit so i could find a good long entry.

Shorted IP/USDTIP has been pumping since the other day, and it has shown a bearish divergence yesterday showing a probable breakdown.

Strong OBV Signals Real Buying Support for IPLayer-1 (L1) coin IP has emerged as today’s top gainer. In recent sessions, IP’s On-Balance Volume (OBV) has surged, reflecting the bullish outlook for the stock.
The OBV tracks buying and selling pressure by analyzing volume flow relative to price action. It moves higher when volume is heavier on up-days and declines when trading activity is stronger on down-days.
This latest uptick signals that capital inflows are outpacing outflows, pointing to sustained accumulation in the market.
The move validates IP’s current uptrend, suggesting that the gains are supported by genuine buying pressure rather than short-term speculative moves.

IP Market Update📊 NYSE:IP Market Update
If you want to enter or re-enter, best to wait for retracement into the green zone around $7.9698 🟢
👉 Potential bounce area for long entry 🚀
⚡ Trade smarter, not hope 🔑

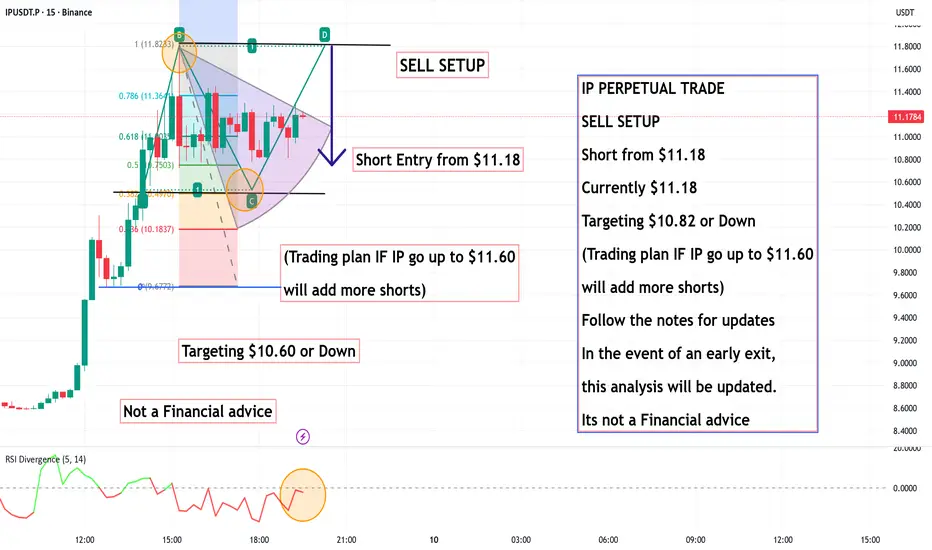
IP PERPETUAL TRADE SELL SETUP Short from $11.18IP PERPETUAL TRADE
SELL SETUP
Short from $11.18
Currently $11.18
Targeting $10.82 or Down
(Trading plan IF IP go up to $11.60
will add more shorts)
Follow the notes for updates
In the event of an early exit,
this analysis will be updated.
Its not a Financial advice
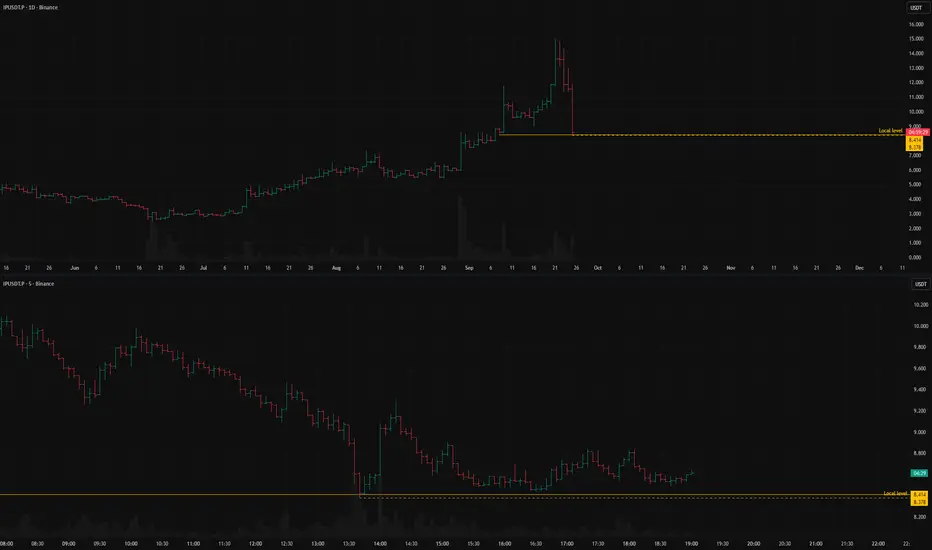
IPUSDT, Podjatiya, Proboy model bilan Long pozitsiya1. On the D1 chart, a zone formed from the Paranormal Bar!
2. Relative to the 8.5320 zone, an LP has appeared, but the price has not moved downward.
3. Relative to the zone, price lows are rising, while the highs are being squeezed into one price point.
4. If, on the local TF, the price breaks above the 8.5320 price zone without an impulsive move, we will try to enter a trade with a long position!

IP Market Update📉 NYSE:IP Market Update
NYSE:IP appears to have formed a Head & Shoulders pattern ❌
Currently, price is testing the blue support level 🔵
The potential play:
🔹 If this support breaks down, it could open a short opportunity.
🔹 The first target would be the green line level 🎯
⚠️ Always wait for confirmation before entering — breakdowns are powerful but need validation.

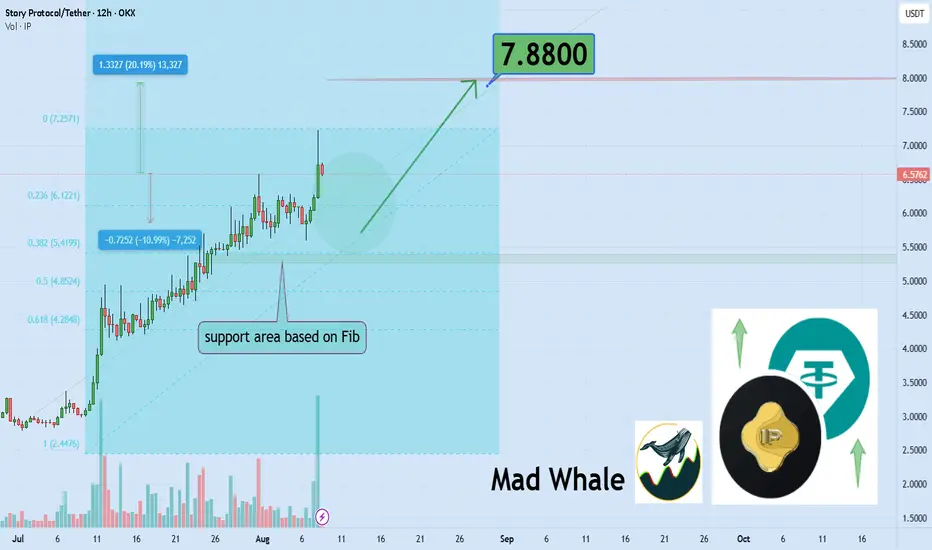
Story Protocol Holds Strong, Targeting Explosive 20% Rally to $7Hello✌️
Let’s analyze Story Protocol’s price action both technically and fundamentally 📈.
🔍Fundamental analysis:
Story is working on tokenizing real-world data for AI, teaming up with big projects to tap into the $80T IP market. But on-chain activity is still low, so hype could fade if adoption is slow.🤖
📊Technical analysis:
OKX:IPUSDT has held its ground and respected key Fibonacci supports during the latest market pullback 📉. Backed by strong fundamentals and steady bullish momentum, I anticipate a 20% move toward the 7.88 target 🚀.
✨We put love into every post!
Your support inspires us 💛 Drop a comment we’d love to hear from you! Thanks, Mad Whale
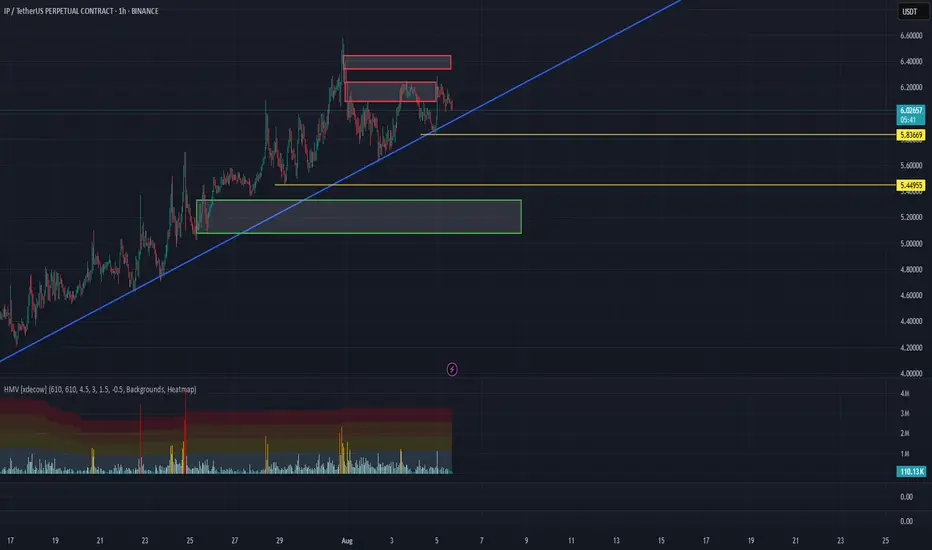
IP/USDT Analysis – High Probability of a Trendline Breakout
Currently, volatility is decreasing. At the same time, a clear imbalance is observed in cumulative delta — delta is dropping while price continues to rise. This could indicate hidden weakness from the buyer’s side. A sharp breakout of the descending trendline is likely in the near future, potentially resulting in a 12–15% move from current levels.
We are now in one of two sell zones — $6.09–$6.23. As long as the price fails to break above, we consider a short position toward support at $5.35–$5.10, either from the current sell zone or from $6.32–$6.44, if a reaction occurs there.
This publication is not financial advice.
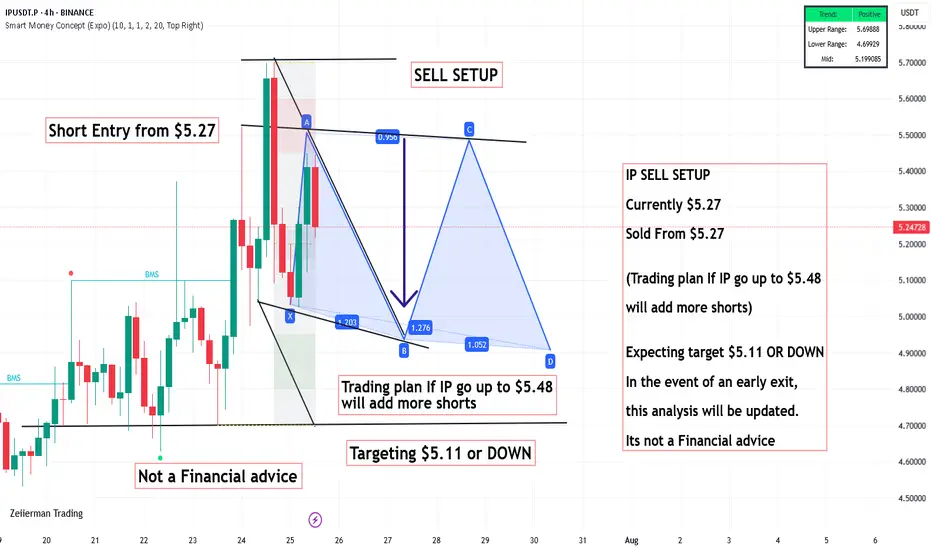
IP SELL SETUP ,Sold From $5.27IP SELL SETUP
Currently $5.27
Sold From $5.27
(Trading plan If IP go up to $5.48
will add more shorts)
Expecting target $5.11 OR DOWN
In the event of an early exit,
this analysis will be updated.
Its not a Financial advice
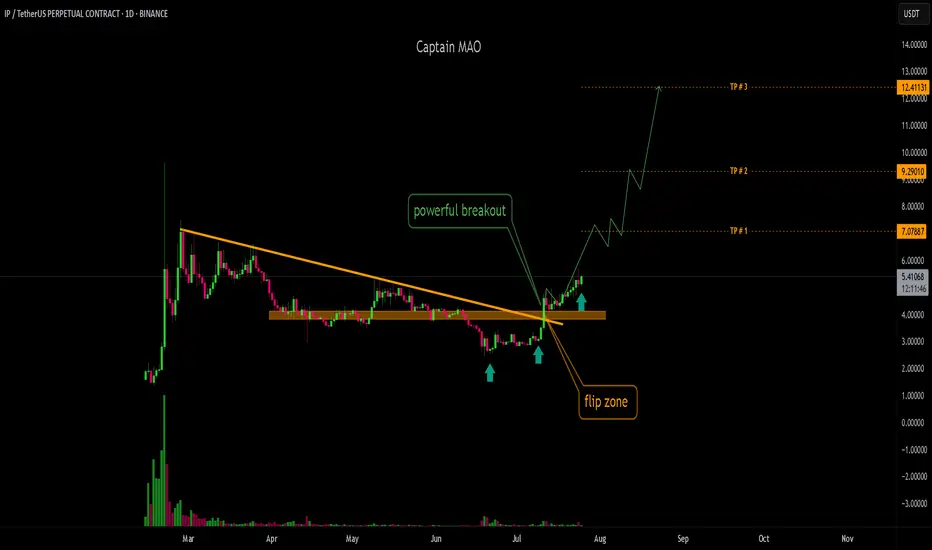
IP/USDT - Continuation P/USDT has formed a solid base support in the $2.60–$2.80 zone over the 20 days, showing strong accumulation. Recently, it broke out of the key $3.30 resistance with significant buying pressure and volume, signaling bullish intent. More importantly, it also broke above a 140 day descending trendline, a major shift in structure. With this clean breakout and confirmation, IP is now looking primed for an upward continuation and potential trend reversal.
IP/USDTKey Level Zone: 2.8900 - 2.9400
LMT v2.0 detected.
The setup looks promising—price previously trended upward with rising volume and momentum, then retested this zone cleanly. This presents an excellent reward-to-risk opportunity if momentum continues to align.
Introducing LMT (Levels & Momentum Trading)
- Over the past 3 years, I’ve refined my approach to focus more sharply on the single most important element in any trade: the KEY LEVEL.
- While HMT (High Momentum Trading) served me well—combining trend, momentum, volume, and structure across multiple timeframes—I realized that consistently identifying and respecting these critical price zones is what truly separates good trades from great ones.
- That insight led to the evolution of HMT into LMT – Levels & Momentum Trading.
Why the Change? (From HMT to LMT)
Switching from High Momentum Trading (HMT) to Levels & Momentum Trading (LMT) improves precision, risk control, and confidence by:
- Clearer Entries & Stops: Defined key levels make it easier to plan entries, stop-losses, and position sizing—no more guesswork.
- Better Signal Quality: Momentum is now always checked against a support or resistance zone—if it aligns, it's a stronger setup.
- Improved Reward-to-Risk: All trades are anchored to key levels, making it easier to calculate and manage risk effectively.
- Stronger Confidence: With clear invalidation points beyond key levels, it's easier to trust the plan and stay disciplined—even in tough markets.
Whenever I share a signal, it’s because:
- A high‐probability key level has been identified on a higher timeframe.
- Lower‐timeframe momentum, market structure and volume suggest continuation or reversal is imminent.
- The reward‐to‐risk (based on that key level) meets my criteria for a disciplined entry.
***Please note that conducting a comprehensive analysis on a single timeframe chart can be quite challenging and sometimes confusing. I appreciate your understanding of the effort involved.
Important Note: The Role of Key Levels
- Holding a key level zone: If price respects the key level zone, momentum often carries the trend in the expected direction. That’s when we look to enter, with stop-loss placed just beyond the zone with some buffer.
- Breaking a key level zone: A definitive break signals a potential stop‐out for trend traders. For reversal traders, it’s a cue to consider switching direction—price often retests broken zones as new support or resistance.
My Trading Rules (Unchanged)
Risk Management
- Maximum risk per trade: 2.5%
- Leverage: 5x
Exit Strategy / Profit Taking
- Sell at least 70% on the 3rd wave up (LTF Wave 5).
- Typically sell 50% during a high‐volume spike.
- Move stop‐loss to breakeven once the trade achieves a 1.5:1 R:R.
- Exit at breakeven if momentum fades or divergence appears.
The market is highly dynamic and constantly changing. LMT signals and target profit (TP) levels are based on the current price and movement, but market conditions can shift instantly, so it is crucial to remain adaptable and follow the market's movement.
If you find this signal/analysis meaningful, kindly like and share it.
Thank you for your support~
Sharing this with love!
From HMT to LMT: A Brief Version History
HM Signal :
Date: 17/08/2023
- Early concept identifying high momentum pullbacks within strong uptrends
- Triggered after a prior wave up with rising volume and momentum
- Focused on healthy retracements into support for optimal reward-to-risk setups
HMT v1.0:
Date: 18/10/2024
- Initial release of the High Momentum Trading framework
- Combined multi-timeframe trend, volume, and momentum analysis.
- Focused on identifying strong trending moves high momentum
HMT v2.0:
Date: 17/12/2024
- Major update to the Momentum indicator
- Reduced false signals from inaccurate momentum detection
- New screener with improved accuracy and fewer signals
HMT v3.0:
Date: 23/12/2024
- Added liquidity factor to enhance trend continuation
- Improved potential for momentum-based plays
- Increased winning probability by reducing entries during peaks
HMT v3.1:
Date: 31/12/2024
- Enhanced entry confirmation for improved reward-to-risk ratios
HMT v4.0:
Date: 05/01/2025
- Incorporated buying and selling pressure in lower timeframes to enhance the probability of trending moves while optimizing entry timing and scaling
HMT v4.1:
Date: 06/01/2025
- Enhanced take-profit (TP) target by incorporating market structure analysis
HMT v5 :
Date: 23/01/2025
- Refined wave analysis for trending conditions
- Incorporated lower timeframe (LTF) momentum to strengthen trend reliability
- Re-aligned and re-balanced entry conditions for improved accuracy
HMT v6 :
Date : 15/02/2025
- Integrated strong accumulation activity into in-depth wave analysis
HMT v7 :
Date : 20/03/2025
- Refined wave analysis along with accumulation and market sentiment
HMT v8 :
Date : 16/04/2025
- Fully restructured strategy logic
HMT v8.1 :
Date : 18/04/2025
- Refined Take Profit (TP) logic to be more conservative for improved win consistency
LMT v1.0 :
Date : 06/06/2025
- Rebranded to emphasize key levels + momentum as the core framework
LMT v2.0
Date: 11/06/2025

UPDATE ON IP LONG , Added more longs from here $4.66 UPDATE ON IP LONG
Added more longs from here $4.66
According to my TA plan
New target will be $4.91 or Above
Not a Financial advice

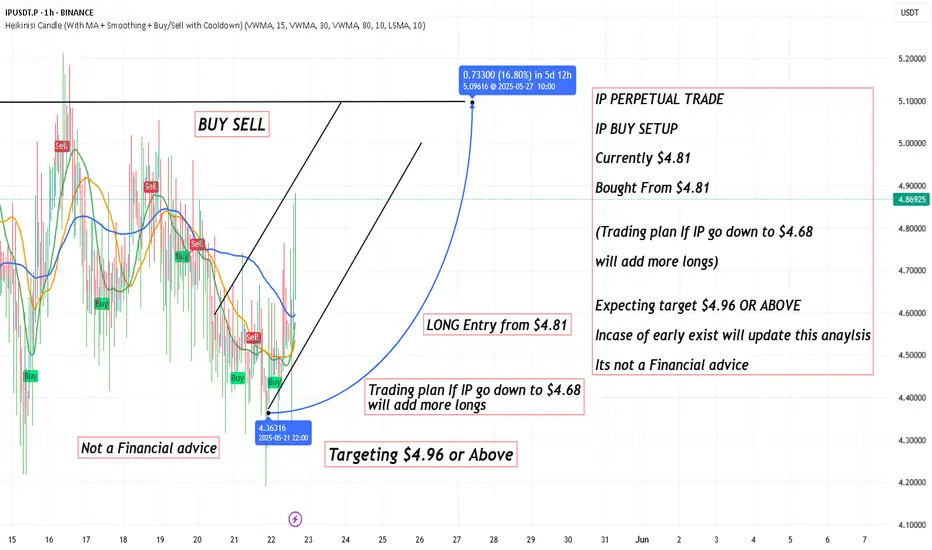
IP PERPETUAL TRADE, Bought From $4.81IP PERPETUAL TRADE
IP BUY SETUP
Currently $4.81
Bought From $4.81
(Trading plan If IP go down to $4.68
will add more longs)
Expecting target $4.96 OR ABOVE
Incase of early exist will update this anaylsis
Its not a Financial advice
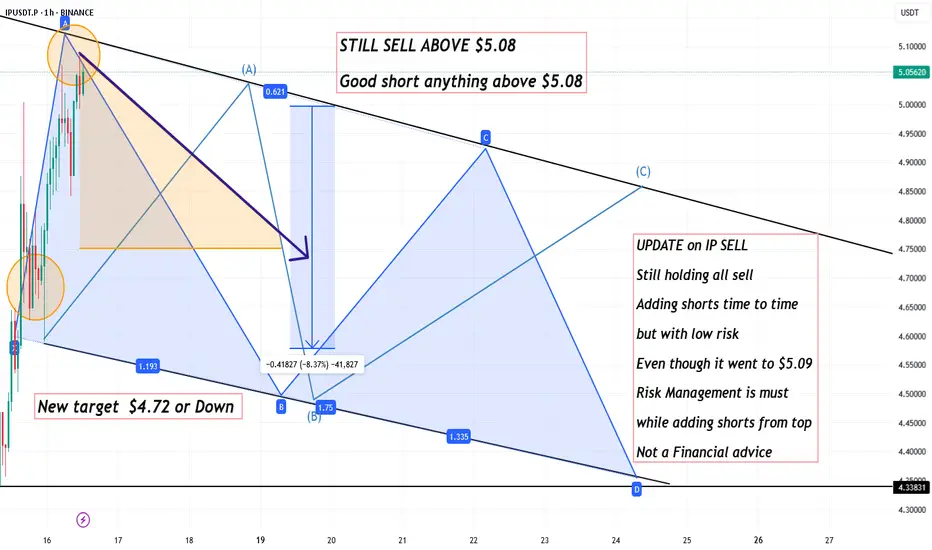
UPDATE on IP SELL ,Good short zone above $5.08UPDATE on IP SELL
Still holding all sell
Adding shorts time to time
but with low risk
Even though it went to $5.09
Risk Management is must
while adding shorts from top
New Target $4.72 or Down
Not a Financial advice
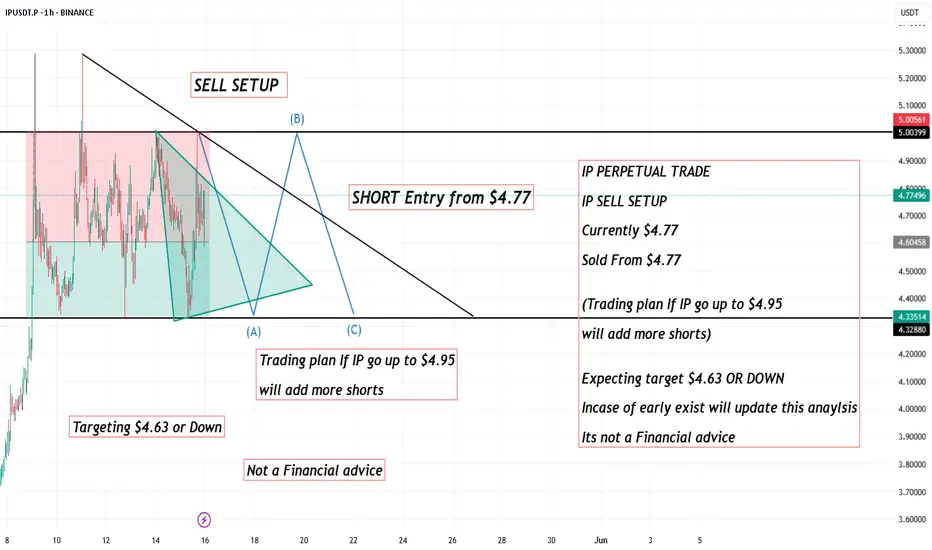
IP PERPETUAL TRADE , Sold From $4.77IP PERPETUAL TRADE
IP SELL SETUP
Currently $4.77
Sold From $4.77
(Trading plan If IP go up to $4.95
will add more shorts)
Expecting target $4.63 OR DOWN
Incase of early exist will update this anaylsis
Its not a Financial advice