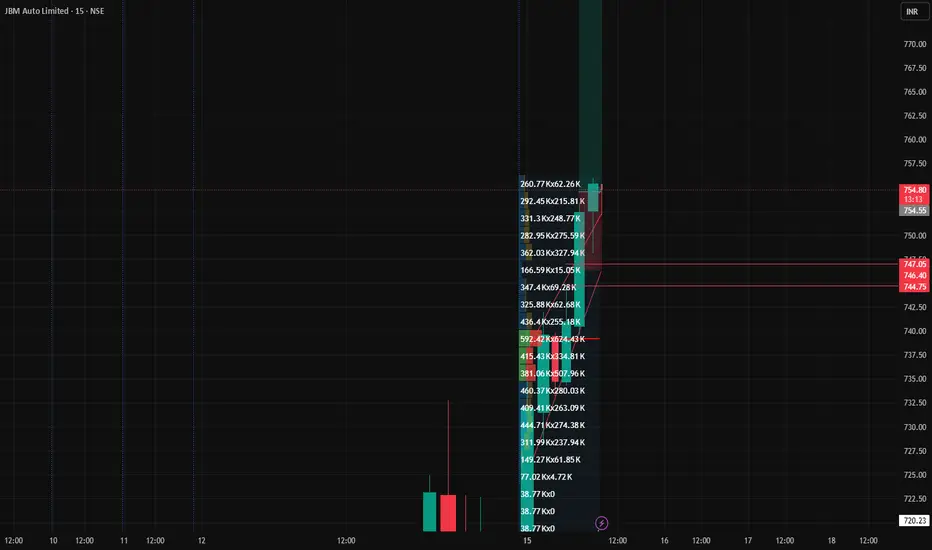
JBM Auto Ltd for 23rd Sept #JBMA JBM Auto Ltd for 23rd Sept #JBMA
Resistance 750 Watching above 751 for upside momentum.
Support area 735 Below 740 gnoring upside momentum for intraday
Watching below 734 for downside movement...
Above 740 ignoring downside move for intraday
Charts for Educational purposes only.
Please follow st
Next report date
—
Report period
—
EPS estimate
—
Revenue estimate
—
8.80 INR
2.02 B INR
54.72 B INR
40.19 M
About JBM Auto Limited
Sector
Industry
CEO
Nishant Arya
Website
Headquarters
Gurgaon
Founded
1996
ISIN
INE927D01051
FIGI
BBG000QP9QG1
JBM Auto Ltd. is a holding company, which engages in the manufacture of key auto systems and city buses. It operates through the following segments: Component Division, Tool Room Division, OEM Division, and Others. The Component Division segment manufactures automobile parts for commercial and passenger vehicles. The Tool Room Division segment offers dies for sheet metal sector. The OEM Division segment is involved in the development, design, manufacture, assembly, and sale of bus as well as parts, accessories, and maintenance contracts. The company was founded in 1996 and is headquartered in Gurgaon, India.
Related stocks

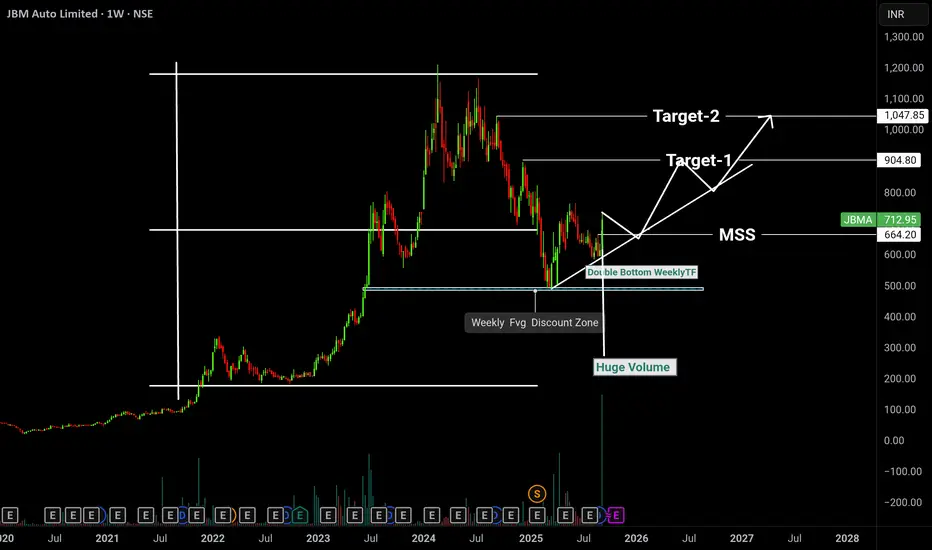
JBM Auto. Double Bottom Formation (Weekly TF):
1. This classic reversal pattern indicates a strong demand zone.
It occurred in the Weekly Fair Value Gap (FVG) Discount Zone, which adds strength to the support.
Volume spike confirms institutional interest.
📉 2. MSS (Market Structure Shift):
MSS shown m

Review and plan for 21st February 2025Nifty future and banknifty future analysis and intraday plan.
Few stocks analysed.
This video is for information/education purpose only. you are 100% responsible for any actions you take by reading/viewing this post.
please consult your financial advisor before taking any action.
----Vinayku

A NEAR PSYCHOLOGICAL SUPPORT SEEN IN NSE: JBMA AUTO 🔸️A technical analysis of JBM Auto Ltd. (NSE: JBMA), outlining a long-term investment plan with an investment period of 3-5 months. Here's a breakdown of the levels and strategy:
✅️Entry Timing: Wait for the price to either approach ₹1,389 for an optimal entry or confirm an upward breakout.
☑️Entr

SWING IDEA - JBM AUTOJBM Auto , a leading manufacturer of auto components and systems, is showing promising technical indicators for a potential swing trade.
Reasons are listed below :
Strong Support at 1700 : The 1700 level has proven to be a robust support zone, indicating strong buying interest and a solid base f

SWING IDEA - JBMAMACD is going to cross pretty soon in the coming days.
Once Cross is done, should open new entry levels for next leg up.
Good chance the stock can easily retouch its Swing High.
Try to take entries only after MACD Cross completes successfully.
Stock's fundamentals looks promising too.

JBM Auto Ltd getting ready for next leg up
sales and earnings have been rising for several quarters
Price action suggests an potentially explosive move on the cards, large outside candle followed by two inside candles on weekly TF
Volume and volatility has also contracted
Good Relative Strength
Previous upmove in jan was from a

Trade Alert for JBMA (JBM Auto Ltd.)Trade Setup:
- Action: Go Long (Buy)
- Entry Point: Above 2142.60
- This is the trigger point for initiating a long position, indicating that the price needs to break above this level to confirm the bullish setup.
Key Levels:
- Fibonacci Resistance Level: 2136.75
- This is a critical level deri

See all ideas
Summarizing what the indicators are suggesting.
Oscillators
Neutral
SellBuy
Strong sellStrong buy
Strong sellSellNeutralBuyStrong buy
Oscillators
Neutral
SellBuy
Strong sellStrong buy
Strong sellSellNeutralBuyStrong buy
Summary
Neutral
SellBuy
Strong sellStrong buy
Strong sellSellNeutralBuyStrong buy
Summary
Neutral
SellBuy
Strong sellStrong buy
Strong sellSellNeutralBuyStrong buy
Summary
Neutral
SellBuy
Strong sellStrong buy
Strong sellSellNeutralBuyStrong buy
Moving Averages
Neutral
SellBuy
Strong sellStrong buy
Strong sellSellNeutralBuyStrong buy
Moving Averages
Neutral
SellBuy
Strong sellStrong buy
Strong sellSellNeutralBuyStrong buy
Displays a symbol's price movements over previous years to identify recurring trends.
MOSMALL250
Motilal Oswal Nifty Smallcap 250 ETF Units Exchange Traded FundWeight
0.13%
Market value
18.63 K
USD
EVIETF
ICICI Prudential Nifty EV & New Age Automotive ETF Exchange Traded Fund UnitsWeight
0.08%
Market value
3.61 K
USD
MULTICAP
Mirae Asset Nifty500 Multicap 502525 ETF Exchange Traded Fund UnitsWeight
0.03%
Market value
1.87 K
USD
Explore more ETFs
Frequently Asked Questions
The current price of JBMA is 614.60 INR — it has decreased by −1.59% in the past 24 hours. Watch JBM Auto Limited stock price performance more closely on the chart.
Depending on the exchange, the stock ticker may vary. For instance, on NSE exchange JBM Auto Limited stocks are traded under the ticker JBMA.
JBMA stock has fallen by −2.75% compared to the previous week, the month change is a −5.97% fall, over the last year JBM Auto Limited has showed a −13.57% decrease.
JBMA reached its all-time high on Feb 19, 2024 with the price of 1,214.20 INR, and its all-time low was 0.65 INR and was reached on Dec 17, 2004. View more price dynamics on JBMA chart.
See other stocks reaching their highest and lowest prices.
See other stocks reaching their highest and lowest prices.
JBMA stock is 2.88% volatile and has beta coefficient of 2.32. Track JBM Auto Limited stock price on the chart and check out the list of the most volatile stocks — is JBM Auto Limited there?
Today JBM Auto Limited has the market capitalization of 145.50 B, it has decreased by −0.40% over the last week.
Yes, you can track JBM Auto Limited financials in yearly and quarterly reports right on TradingView.
JBM Auto Limited is going to release the next earnings report on Feb 10, 2026. Keep track of upcoming events with our Earnings Calendar.
JBMA net income for the last quarter is 526.30 M INR, while the quarter before that showed 368.00 M INR of net income which accounts for 43.02% change. Track more JBM Auto Limited financial stats to get the full picture.
Yes, JBMA dividends are paid annually. The last dividend per share was 0.85 INR. As of today, Dividend Yield (TTM)% is 0.14%. Tracking JBM Auto Limited dividends might help you take more informed decisions.
JBM Auto Limited dividend yield was 0.14% in 2024, and payout ratio reached 9.96%. The year before the numbers were 0.08% and 9.92% correspondingly. See high-dividend stocks and find more opportunities for your portfolio.
As of Nov 23, 2025, the company has 17 K employees. See our rating of the largest employees — is JBM Auto Limited on this list?
EBITDA measures a company's operating performance, its growth signifies an improvement in the efficiency of a company. JBM Auto Limited EBITDA is 6.67 B INR, and current EBITDA margin is 12.42%. See more stats in JBM Auto Limited financial statements.
Like other stocks, JBMA shares are traded on stock exchanges, e.g. Nasdaq, Nyse, Euronext, and the easiest way to buy them is through an online stock broker. To do this, you need to open an account and follow a broker's procedures, then start trading. You can trade JBM Auto Limited stock right from TradingView charts — choose your broker and connect to your account.
Investing in stocks requires a comprehensive research: you should carefully study all the available data, e.g. company's financials, related news, and its technical analysis. So JBM Auto Limited technincal analysis shows the strong sell today, and its 1 week rating is sell. Since market conditions are prone to changes, it's worth looking a bit further into the future — according to the 1 month rating JBM Auto Limited stock shows the sell signal. See more of JBM Auto Limited technicals for a more comprehensive analysis.
If you're still not sure, try looking for inspiration in our curated watchlists.
If you're still not sure, try looking for inspiration in our curated watchlists.