JOEUSDT Forming Bullish MomentumJOEUSDT is forming a strong technical structure that signals potential bullish momentum. The chart indicates price consolidation within a tightening range, often a precursor to a breakout move. With good trading volume supporting the current price action, the conditions are aligning for a significan

JOE ANALYSIS📊#JOE Analysis
✅There is a formation of Descending triangle pattern on daily chart🧐
Pattern signals potential bullish movement incoming after a small retest 📉
👀Current Price: $0.1944
🚀 Target Price: $0.2370
⚡️What to do ?
👀Keep an eye on #JOE price action and volume. We can trade according

JOEUSDT TRADE ANALYSIS.OEUSDT – 15m Analysis
Bias: ✅ Bullish continuation possible
Key Structure Update:
Clear CHoCH marked – shift from bearish → bullish order flow.
Price already broke short-term structure and is pulling back.
POI Level:
OB + FVG confluence zone at 0.154–0.155 USDT.
SSL liquidity sits just above

JOE/USDT After a prolonged downtrend, JOE/USDT is showing strong signs that the bearish cycle is nearly over. On the daily timeframe, price has delivered a clean breakout above the trendline, followed by a successful retest of structure
JOE/USDT Approaching a Major Turning Point: Will Buyers Step In?🔎 Market Overview & Structure:
JOE/USDT is currently trading within a major historical demand zone between $0.1241 – $0.1548, a level that has proven to be a strong support since early 2023. Each time the price revisits this area, we’ve seen significant bounces — indicating that buyers continue to

JOEUSDT 1D#JOE is moving inside a symmetrical triangle on the daily chart and has bounced nicely off the triangle support.
📌 In case of a breakout above the triangle resistance and the daily SMA100, the potential upside targets are:
🎯 $0.2005
🎯 $0.2478
🎯 $0.2861
🎯 $0.3244
🎯 $0.3789
🎯 $0.4483
⚠️ As always,

JOEUSDT 5D AnalysisJOE ~ 5D Analysis
#JOE Buy back from here. This is the lowest support block for now, Short term target 20%+, Long term target $0.5 - $1.4

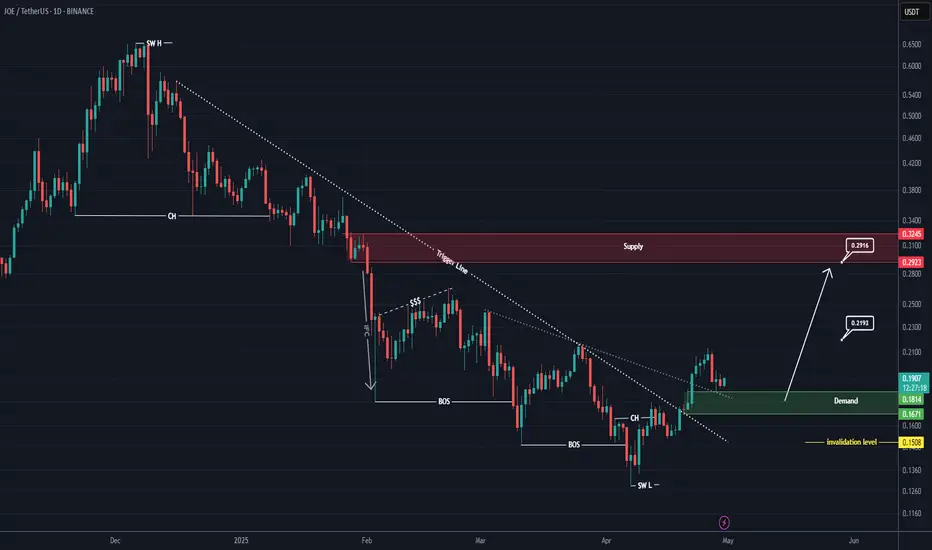
JOE Looks Bullish (1D)A 3D divergence is visible on the chart, indicating that sellers have exited their short positions.
A key trigger line has been broken, and the price has reclaimed critical levels.
We have identified two entry points where we plan to open buy/long positions.
A daily candle closing below the inval

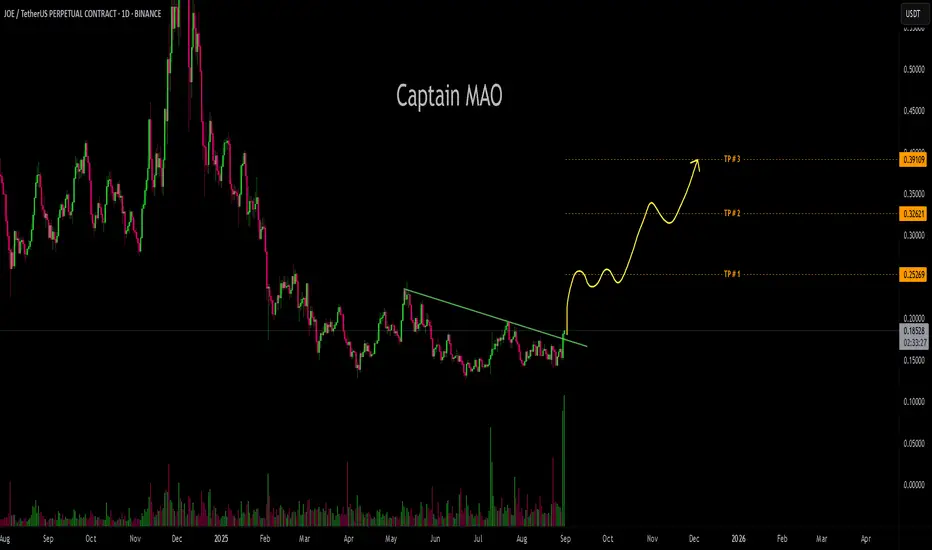
JOE Looks Bullish (1D)Two important trigger lines have been broken, and a bullish CH (Change of Character) is also visible on the chart. A key support zone has formed, which is expected to hold.
The correction that occurred has been sufficient in terms of both time and price, and the break of the trigger line indicates
JOEUSDT 5DJOE ~ 5D Analysis
#JOE Buy gradually from here with a short -term target of at least 20%+. This is the lowest support for now.

See all ideas
Summarizing what the indicators are suggesting.
Oscillators
Neutral
SellBuy
Strong sellStrong buy
Strong sellSellNeutralBuyStrong buy
Oscillators
Neutral
SellBuy
Strong sellStrong buy
Strong sellSellNeutralBuyStrong buy
Summary
Neutral
SellBuy
Strong sellStrong buy
Strong sellSellNeutralBuyStrong buy
Summary
Neutral
SellBuy
Strong sellStrong buy
Strong sellSellNeutralBuyStrong buy
Summary
Neutral
SellBuy
Strong sellStrong buy
Strong sellSellNeutralBuyStrong buy
Moving Averages
Neutral
SellBuy
Strong sellStrong buy
Strong sellSellNeutralBuyStrong buy
Moving Averages
Neutral
SellBuy
Strong sellStrong buy
Strong sellSellNeutralBuyStrong buy
Displays a symbol's price movements over previous years to identify recurring trends.