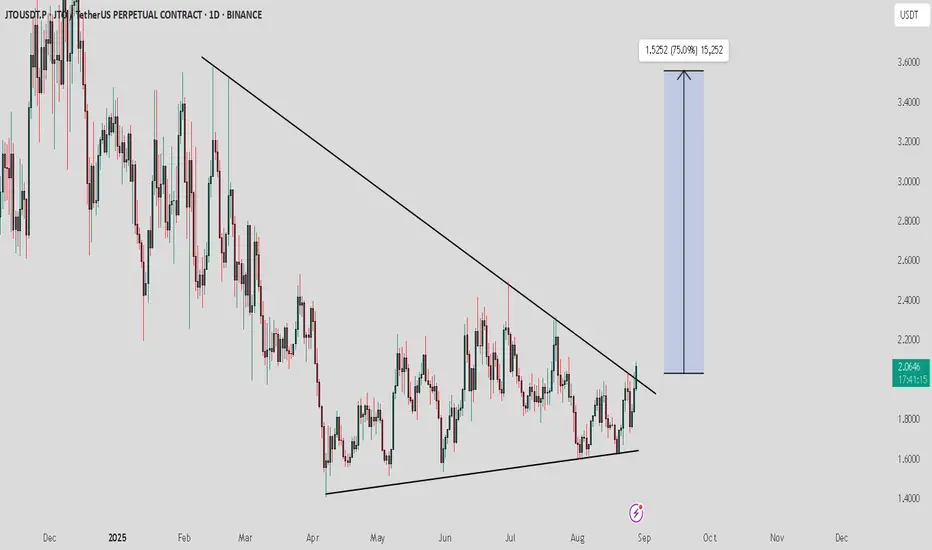
JTO/USDT — Ready Strong Rebound or a Major Breakdown?📊 Full Analysis
1. Current Market Outlook
JTO/USDT is now trading right inside the key demand zone (1.50–1.62), which has acted as a major support level since early 2024.
Every retest of this zone has historically triggered a strong bounce, showing institutional buying interest around this area.

JTOUSDT 1D#JTO has broken above the triangle resistance and the SMA200 on the daily chart. In case of a successful retest, the potential targets are:
🎯 $2.267
🎯 $2.482
🎯 $2.696
🎯 $3.002
🎯 $3.392
⚠️ Always remember to use a tight stop-loss and follow proper risk management.

JTO has formed a bullish double bottom📊 CRYPTOCAP:JTO Market Update
CRYPTOCAP:JTO has formed a bullish double bottom 📈
👉 If it breaks out the red resistance zone 🔴, the first target will be the green line level 🎯

JTO / USDT : Breaking out from symmetrical triangleJTO/USDT is breaking out of a symmetrical triangle pattern. If this breakout sustains, we could see a strong bullish rally toward the $3 – $4 zone.
Recommendation: Spot buying is favorable here — enter after confirmation and consider holding for midterm gains. Always manage risk wisely.
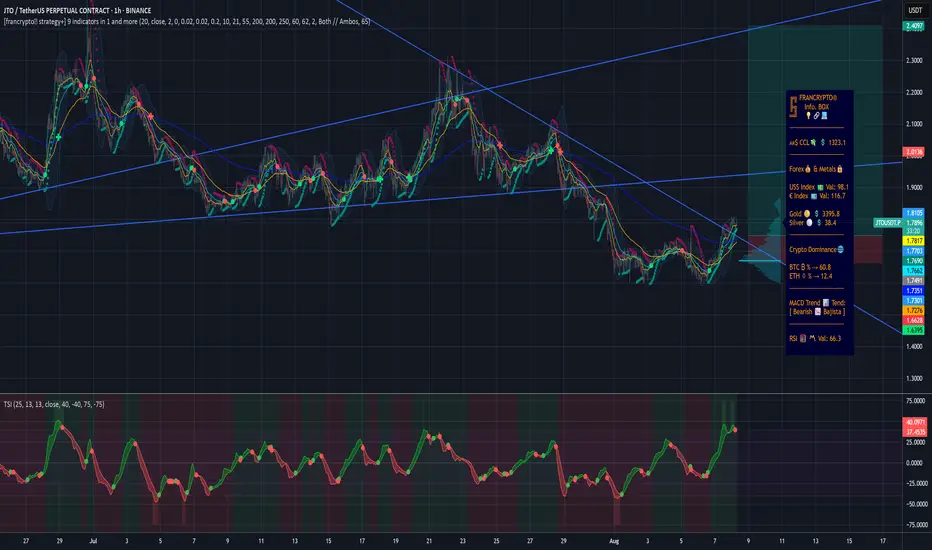
JTOUSDT TRADE SETUP.JTOUSDT | 1H Bullish Setup
BOS: Price made an internal bullish Break of Structure (BOS INT).
SSL: Sell-side liquidity (SSL) is resting below recent lows.
POI: A clean POI zone (Demand + OB) is marked around 1.80–1.82.
Current Price Action: Price is pushing upward strongly after BOS but hasn’t ye

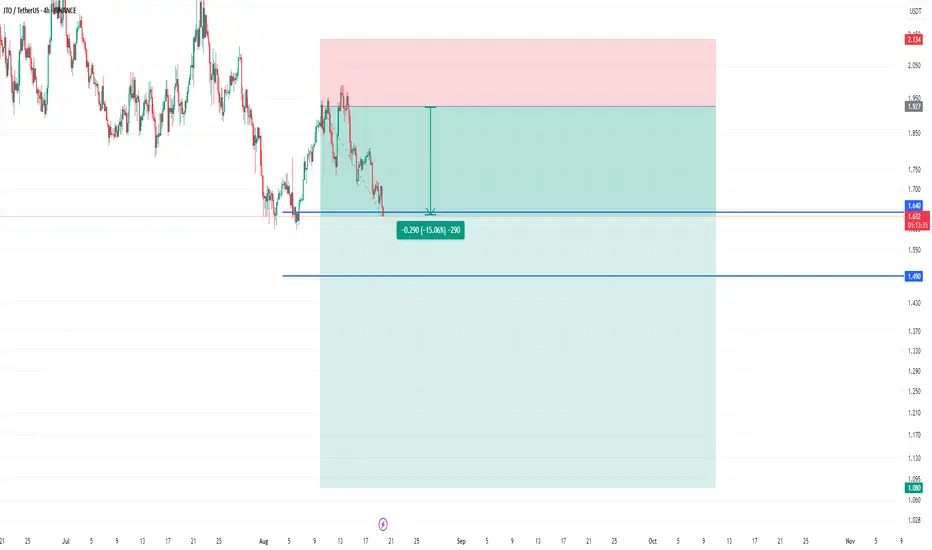
JTO USDT SHORT UPDATEHello everyone 😍
Let's go for an update on the analysis of the JTO_USDT cryptocurrency
According to the analysis, everything went great and we achieved the first target
When the first target was touched, there was a 15% drop
First target is $1.64 (DONE) ✅🔥 -15%
Second target is $1.49 (Possible)
Fin
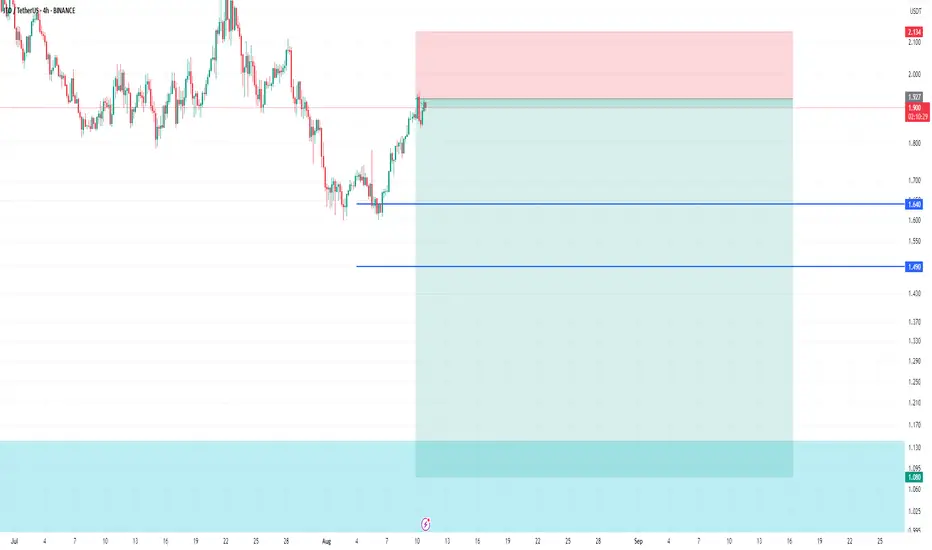
JTO-USDT SHORTHello 😍
Let's go for a new update of the #JTO cryptocurrency analysis
After the 25% drop we had in the previous analysis and reaching the first target, it seems that we should see another drop again
First target is $1.64 (Accessible)
Second target is $1.49 (Possible)
Final target is $1.08 (Possibl
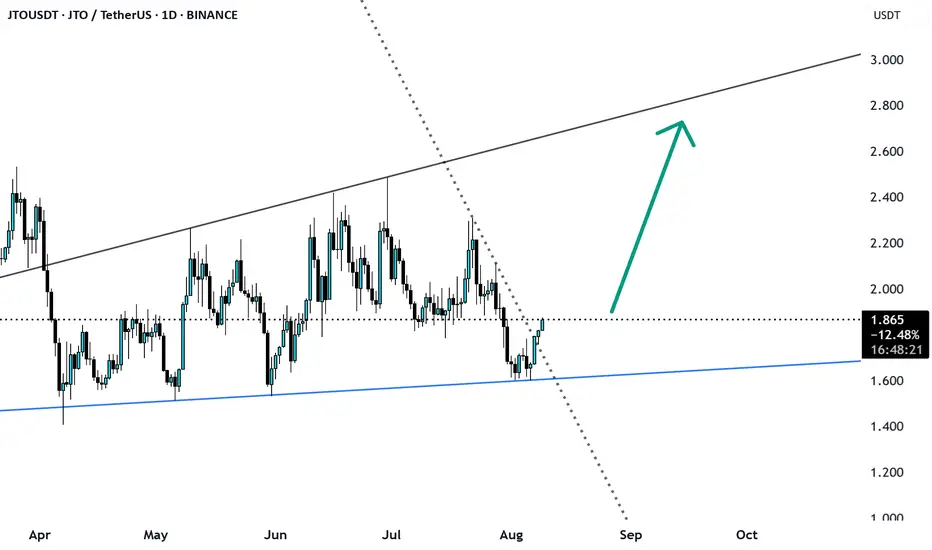
JTOUSDT broke the trendline resistance JTO/USDT was trading at a support level and recently pulled back from it, breaking the trendline support. The price may now rise, with a potential target around 2.8.
Bullish on JTOUSDTHere we have a very nice setup: JTO finished the big retrace and is now trying breaking the downward trend. On successfull breakout JTO will pump on top of the old upward channel. Volumes are coming, right now we are over all EMAs and very bullish. Best entry would be 1.75$-1.65$ (if JTO comes down
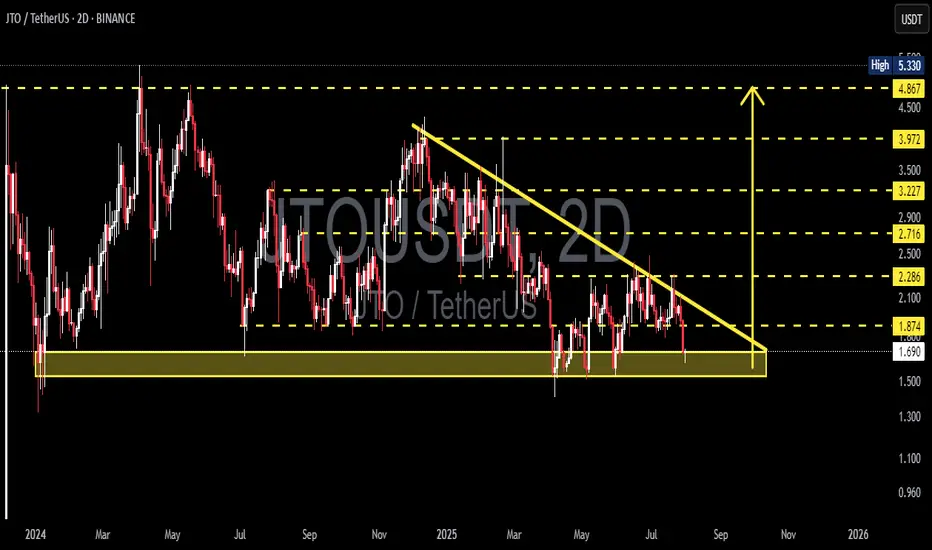
JTO/USDT at the Edge of Pressure – Breakout or Breakdown Ahead?🧠 Detailed Technical Analysis (2D Timeframe):
JTO/USDT is currently consolidating at a critical support zone within a well-defined Descending Triangle pattern that has been forming for over 6 months.
Key observations:
Price has been making lower highs, forming a downward-sloping resistance trendl
See all ideas
Summarizing what the indicators are suggesting.
Oscillators
Neutral
SellBuy
Strong sellStrong buy
Strong sellSellNeutralBuyStrong buy
Oscillators
Neutral
SellBuy
Strong sellStrong buy
Strong sellSellNeutralBuyStrong buy
Summary
Neutral
SellBuy
Strong sellStrong buy
Strong sellSellNeutralBuyStrong buy
Summary
Neutral
SellBuy
Strong sellStrong buy
Strong sellSellNeutralBuyStrong buy
Summary
Neutral
SellBuy
Strong sellStrong buy
Strong sellSellNeutralBuyStrong buy
Moving Averages
Neutral
SellBuy
Strong sellStrong buy
Strong sellSellNeutralBuyStrong buy
Moving Averages
Neutral
SellBuy
Strong sellStrong buy
Strong sellSellNeutralBuyStrong buy
Displays a symbol's price movements over previous years to identify recurring trends.