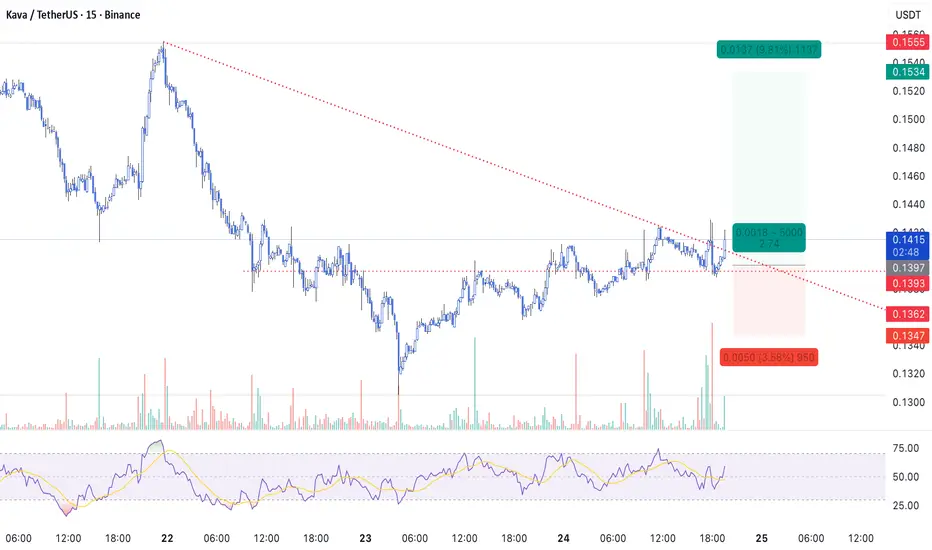
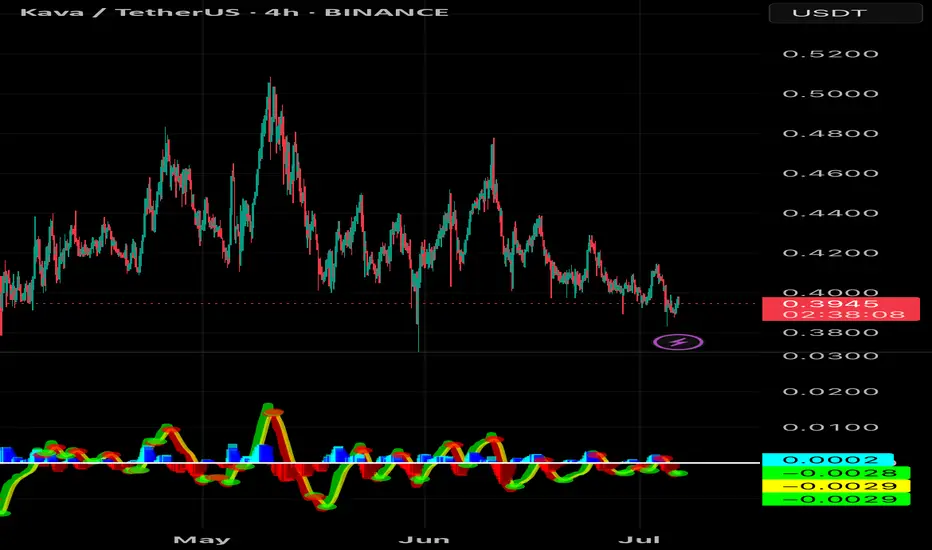
KAVA - Scalp Long💎 Scalp Long – KAVA
RSI is in the buy zone — momentum clearly recovering.
The short-term downtrend line has been broken, and price is well-supported by the demand zone.
Volume is surging, confirming buyers’ strength returning.
🎯 Plan:
→ Enter after a clean retest of the trendline or nearby support.
→ TP: 0.1534 | SL: 0.1347 | RR: 1 : 2.7
Short-term structure has flipped bullish — momentum favors the upside.
Keep position size light, trail SL as price moves.
Discipline first — no chasing, only execution.
Trade ideas
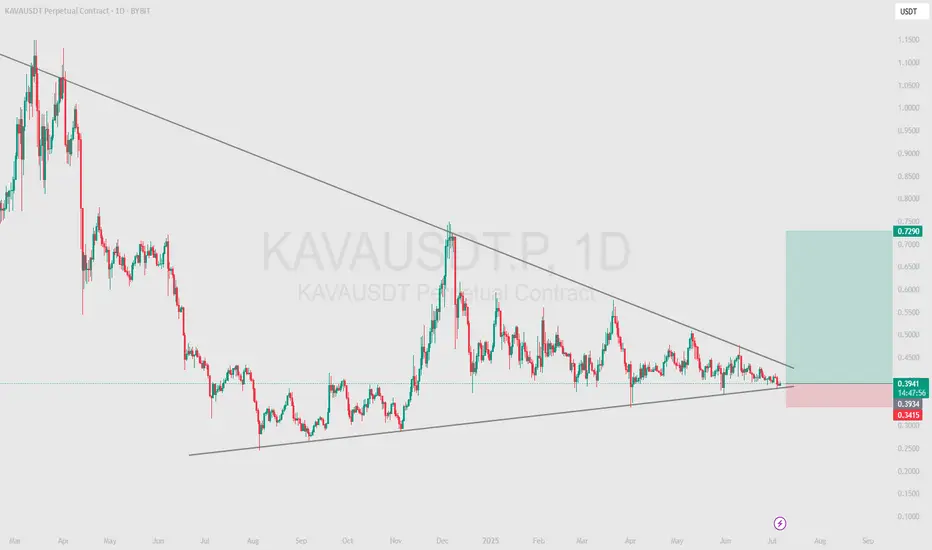
KAVA/USDT — Descending Triangle at a Major Decision Zone!KAVA is currently standing at a critical crossroads. After a prolonged downtrend from its all-time high, the price is now consolidating inside a descending triangle on the weekly timeframe. Lower highs keep pressing the price downward, while the historical support zone at $0.24 – $0.32 is still holding as the last line of defense.
The triangle is getting tighter (apex approaching), which often signals an imminent big move — either a bullish reversal or a bearish continuation.
---
🔎 Pattern Analysis
Main pattern: Descending Triangle
→ Traditionally seen as a bearish continuation, but if the support holds strong, it could act as a springboard for a major reversal.
Historical support: $0.24 – $0.32 (yellow box), a make-or-break area before entering uncharted lower territory.
Falling trendline: The multi-year descending line from 2021 remains the key resistance that bulls must reclaim.
---
🚀 Bullish Scenario
1. Breakout confirmation → A weekly close above the descending trendline.
2. Stronger signal → Break + retest above $0.53.
3. Upside targets:
$0.70 → first psychological barrier.
$1.16 → strong historical resistance.
$2.22 → mid-term breakout target.
4. Extra signals: Rising volume + RSI recovery from oversold would strengthen bullish momentum.
---
🐻 Bearish Scenario
1. Breakdown confirmation → A weekly close below $0.24 with strong volume.
2. Downside targets:
Below $0.24 → opens room for deeper lows.
Sustained breakdown would confirm the continuation of the multi-year bearish trend.
3. Risk factor: Watch for potential false breakdowns (bear traps) if price quickly reclaims the support.
---
🎯 Conclusion
$0.24 – $0.32 is KAVA’s do-or-die zone.
Holding this level → chances of a major reversal.
Losing this level → the bearish trend extends even further.
KAVA is in its final stage of accumulation or distribution. Traders should wait for clear breakout confirmation before committing, as volatility is likely to expand once price exits this structure.
---
KAVA/USDT is consolidating at historical support $0.24 – $0.32, trapped inside a descending triangle. The apex is near → a decisive move is coming.
Bullish case: Breakout above the trendline and $0.53 → targets $0.70 – $1.16 – $2.22.
Bearish case: Breakdown below $0.24 → opens the door for deeper lows.
This is a multi-year turning point for KAVA. Patience for confirmation could reward traders with the next major move.
---
#KAVA #KAVAUSDT #Crypto #Altcoins #PriceAction #DescendingTriangle #SupportResistance #CryptoAnalysis #BreakoutTrading
$kava btc pair and usdt pair both in deviation territory so entered here with some ammo to add above 3822 or below for the liquidity sweep
dominance has run up and should get knocked back down again so time to risk on imho


KAVA/USDT - Bullish Breakout Set to Accelerate Gains!🚀 Trade Setup Details:
🕯 #KAVA/USDT 🔼 Buy | Long 🔼
⌛️ TimeFrame: 1D
--------------------
🛡 Risk Management (Example):
🛡 Based on $1000 Balance
🛡 Loss-Limit: 1% (Conservative)
🛡 Then Your Signal Margin: $30.81
--------------------
☄️ En1: 0.4285 (Amount: $3.08)
☄️ En2: 0.3757 (Amount: $10.78)
☄️ En3: 0.3421 (Amount: $13.86)
☄️ En4: 0.3116 (Amount: $3.08)
--------------------
☄️ If All Entries Are Activated, Then:
☄️ Average.En: 0.3595 ($30.81)
--------------------
☑️ TP1: 0.5892 (+63.89%) (RR:1.97)
☑️ TP2: 0.7478 (+108.01%) (RR:3.33)
☑️ TP3: 1.0124 (+181.61%) (RR:5.59)
☑️ TP4: 1.4884 (+314.02%) (RR:9.67)
☑️ TP5: 2.2778 (+533.6%) (RR:16.44)
☑️ TP6: Open 🔝
--------------------
❌ SL: 0.2428 (-32.46%) (-$10)
--------------------
💯 Maximum.Lev: 2X
⌛️ Trading Type: Swing Trading
‼️ Signal Risk: 🙂 Low-Risk! 🙂
🔎 Technical Analysis Breakdown:
This technical analysis is based on Price Action, Elliott waves, SMC (Smart Money Concepts), and ICT (Inner Circle Trader) concepts. All entry points, Target Points, and Stop Losses are calculated using professional mathematical formulas. As a result, you can have an optimal trade setup based on great risk management.
The daily chart for KAVA/USDT signals strong bullish momentum with multiple strategic entry points offering an excellent risk-reward setup. Market sentiment is turning increasingly optimistic as KAVA’s ecosystem gains traction with DeFi integrations and cross-chain interoperability, positioning it well for sustained growth.
📊 Sentiment & Market Context:
Fundamentally, KAVA stands out as a leading DeFi platform built for secure lending and staking across multiple blockchains, attracting a growing user base and institutional interest. This combination of solid tech and positive market context underpins the bullish bias.
⚠️ Disclaimer:
Trading involves significant risk, and past performance does not guarantee future results. This analysis is for informational purposes only and should not be considered financial advice. Always conduct your research and trade responsibly.
💡 Stay Updated:
Like this technical analysis? Follow me for more in-depth insights, technical setups, and market updates. Let's trade smarter together!

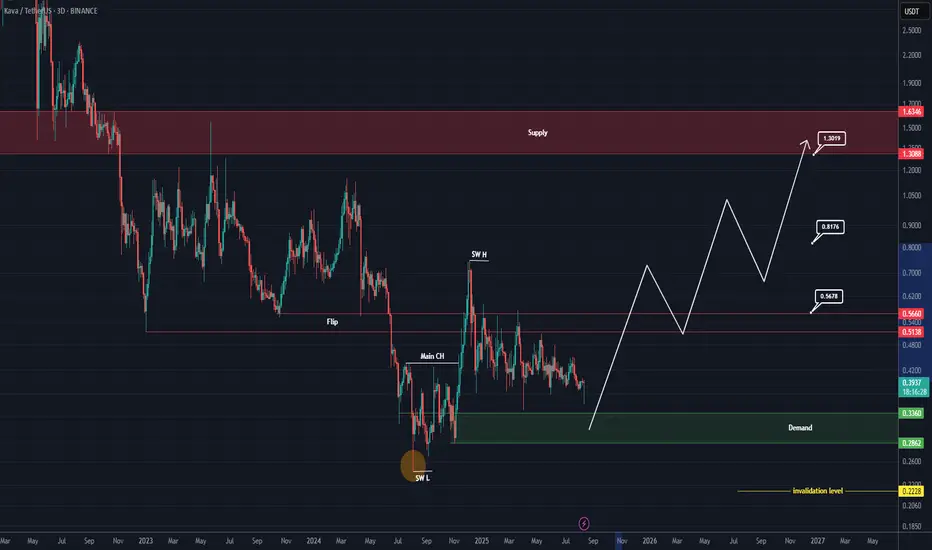
KAVA is ready to take off (3D)After a strong bullish wave, KAVA has entered a time correction phase. Despite the altcoin market being very volatile, KAVA has not experienced a significant price correction and is approaching a strong support zone. It is expected that upon touching this area, a bullish move will form in higher timeframes.
We are looking for buy/long positions in the green-marked area.
Targets are indicated on the chart.
A daily candle close below the invalidation level will nullify this analysis.
For risk management, please don't forget stop loss and capital management
When we reach the first target, save some profit and then change the stop to entry
Comment if you have any questions
Thank You
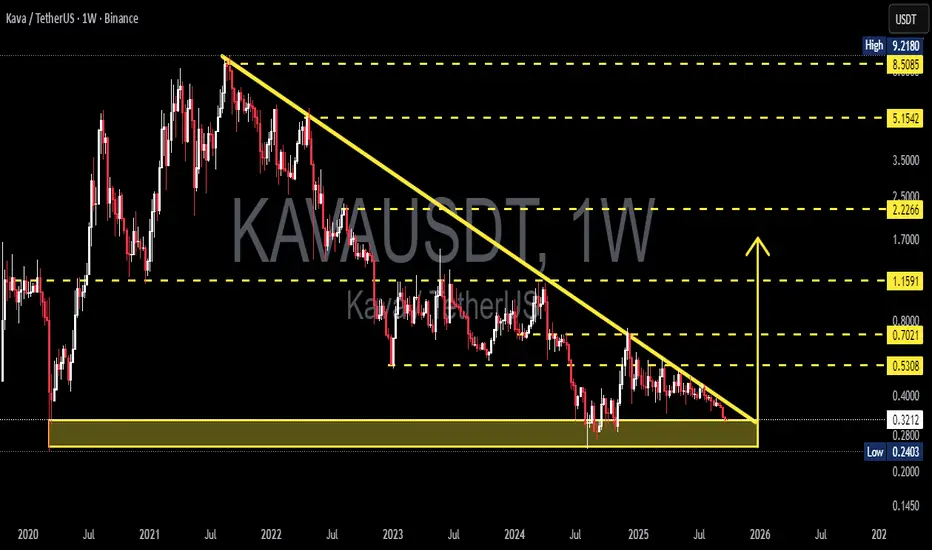
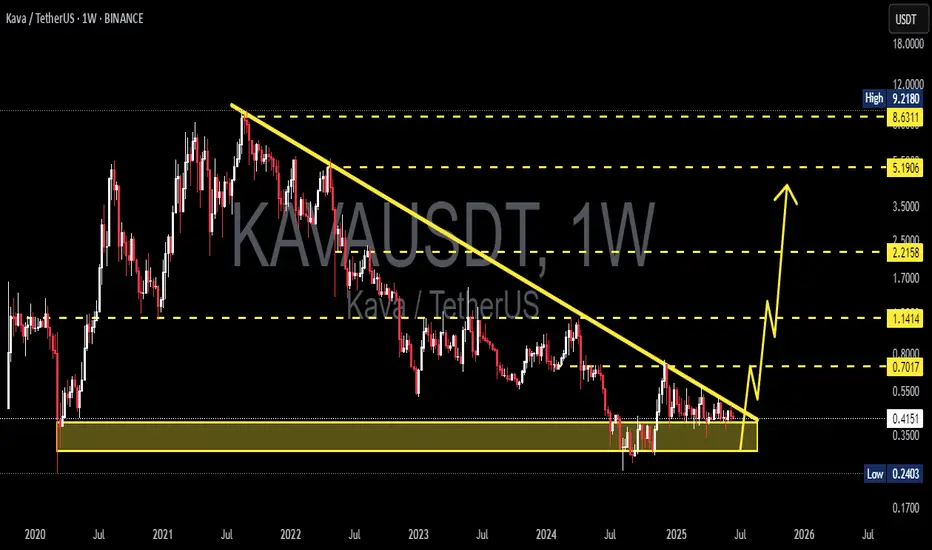
KAVA at Make-or-Break Point — Breakout or Breakdown Ahead?KAVA price is forming a descending triangle on the weekly timeframe, with a long-term downtrend resistance line from the 2021 peak converging toward a horizontal support zone (~0.24–0.40). Price action is compressing near the apex — suggesting that a strong move (either breakout or breakdown) could occur in the coming weeks/months. Weekly timeframe signals carry more weight, so confirmation on a weekly close is highly recommended.
Key Levels (from chart)
Resistance / upside targets: 0.5308 → 0.7021 → 1.1591 → 2.2266 → 5.1542 → 8.5085 → 9.2180
Current price (chart): ~0.3972
Key support zone (yellow box): ~0.24 (Low 0.2403) to ~0.40
Pattern & Technical Interpretation
Pattern: Descending triangle — series of lower highs (downward sloping trendline) + horizontal support.
Implication: In a long-term downtrend, descending triangles often act as bearish continuation patterns. However, a confirmed breakout above the trendline can also signal a bullish reversal.
Compression & timing: Price is nearing the apex → expect volatility to spike once a breakout/breakdown occurs.
Bullish Scenario (confirmation needed)
1. Trigger: Weekly close above the descending trendline (break & hold), ideally followed by a successful retest as support.
2. Extra confirmation: Weekly close above 0.5308 would strengthen the bullish case.
3. Targets: 0.53 → 0.70 → 1.16 (next major resistance zones). If momentum remains strong, higher targets like 2.22 and beyond come into play.
4. Entry strategy: Post-breakout entry after weekly close confirmation, or aggressive scaling in at support with a tight stop-loss.
Bearish Scenario (confirmation needed)
1. Trigger: Weekly close below the support zone (~0.24–0.40), especially with a large breakdown candle.
2. Implication: Breakdown from a descending triangle often accelerates selling pressure — potential retest of historical lows (around or below 0.2403).
3. Entry strategy: Short positions only after confirmed breakdown; conservative longs should avoid entries until reversal signs appear.
Trading Plan & Risk Management (principles)
Always wait for weekly confirmation to avoid false breakouts.
Stop-loss for aggressive longs: just below the support zone (e.g., under 0.24). For breakout longs: below the retested trendline support.
Position sizing: manage exposure due to weekly timeframe + high crypto volatility.
Take profit progressively at major horizontal resistance levels (0.53, 0.70, 1.16…).
Beware of fakeouts — watch for candle closes and retests.
Additional Notes
Weekly timeframe setups tend to be stronger but slower to play out.
Monitor KAVA fundamentals and overall crypto market sentiment (especially BTC trend) — these can speed up or reverse a breakout.
If posting to TradingView, include these levels and clearly state your breakout/breakdown confirmation criteria.
#KAVA #KAVAUSDT #Crypto #TechnicalAnalysis #SupportResistance #DescendingTriangle #Breakout #CryptoTrading
baby baby KAVAlook how lovely this triangle is! I longed the dip near the trendline! lets see whats gonna happen! big gainssssss

Kava: 5 Strong Bullish Signals, Cup & Handle, High Volume & MoreThe cup & handle pattern doesn't work at resistance. You cannot use this pattern in any meaningful way at the top of a rising trend. For the C&H to be valid, it needs to happen at the end of a downtrend, near the market bottom because this is a bullish reversal pattern.
Here we have KAVAUSDT weekly up-close. August 2024 marks the lowest prices since March 2020, in more than 3.5 years. Including this strong multiple years low, we have the cup pattern forming followed by the handle. See the chart:
This is the classic cup and handle (C&H) pattern and here it is valid and can work as a reversal signal.
One signal in isolation is never enough, it needs to be coupled with 3-4 additional signals to have a strong setup. The next signal comes from the trading volume. As KAVAUSDT reached the lowest in almost 4 years, trading volume goes through the roof; the highest buy-volume ever. This is another strong signal.
We have the reversal pattern, long-term double-bottom, increasing volume, local higher low (the handle low vs the cup low) and marketwide action (the rest of the altcoins market going bullish).
There you have five signals total all supporting a change of trend. This means that soon Kava will start to grow and you know this for certain because you have the supporting data coming from the chart.
Namaste.

$KAVA breaking out of its defending phase to 4$ I would like to notice as the market picks up for Monday I think this is a great risk to take here.
KAVA LONG on a .039 - .038 entry leading into a breakout above its previous drawback.
4hr chart looks depressing but MACD shows sign of health. Holding a 20x leverage position here and hoping we can see 0.04 in the next day and half.
XRP breakout already beginning.
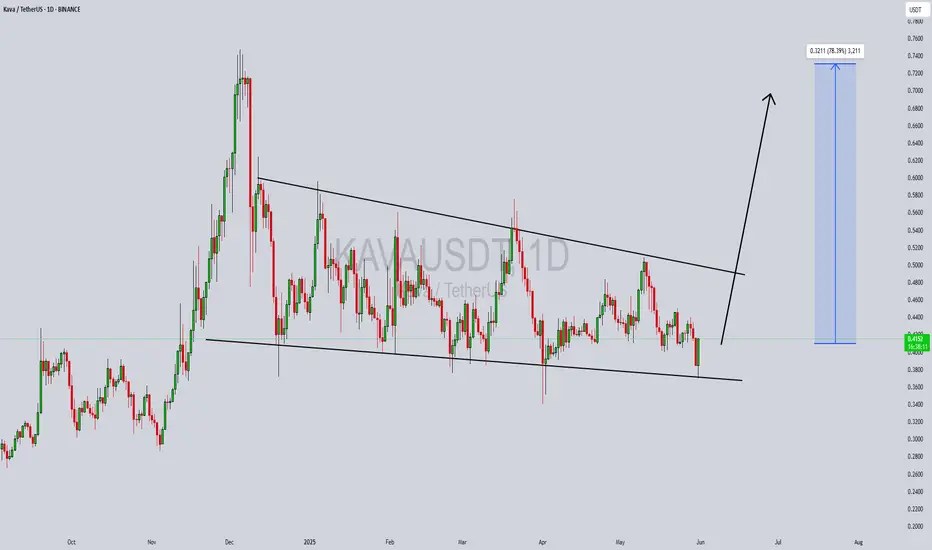
KAVA - We are expecting the rocket at 80%The KAVAUSDT chart shows a clear downward channel, indicating a bearish trend. However, the price is currently consolidating around the middle of the channel, creating uncertainty about the immediate direction.
Recommended signal: wait for confirmation of a breakout above the upper boundary for longs or a breakout below the lower boundary for shorts.
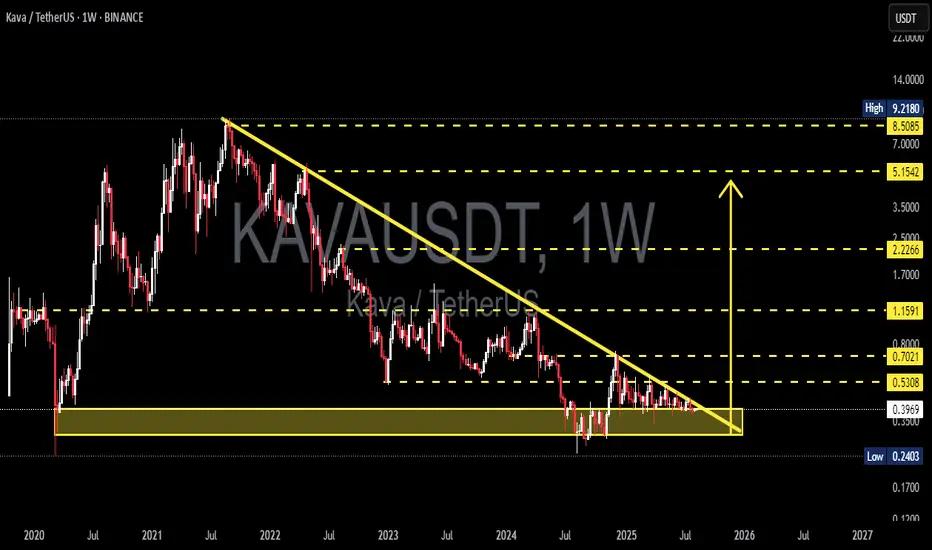
Is KAVA/USDT About to Explode? Major Breakout Incoming!Technical Analysis (Timeframe: 1W - Weekly)
1. Descending Triangle Breakout Setup
KAVA has been in a prolonged downtrend since 2021, forming a large descending triangle pattern. Currently, the price is nearing the apex of this formation, signaling a potential breakout in the near term.
2. Strong Accumulation Zone
A strong support base has formed between $0.24 – $0.40, which has held for over a year. This suggests significant accumulation by long-term investors at these levels.
3. Breakout Confirmation Imminent
If KAVA successfully breaks above the long-term descending trendline (yellow line), a major shift in market structure could occur, triggering a bullish rally.
4. Key Upside Targets
The following resistance levels may act as profit-taking zones if the breakout confirms:
$0.5308 – Initial minor resistance.
$0.7021 – Psychological resistance zone.
$1.1591 – Previous structural resistance.
$2.2266 – Medium-term upside target.
$5.1542 – $8.5085 – Long-term bull cycle potential targets.
5. Ideal Trading Scenario
Entry Strategy: Buy on breakout confirmation above the trendline or buy on successful retest.
Risk Management: Consider a stop-loss if price falls back below the accumulation zone (~$0.40).
🟢 Conclusion:
KAVA is approaching a critical turning point after a prolonged consolidation phase. A confirmed breakout from this pattern could initiate a strong upward trend, making it a compelling setup for swing traders and long-term investors.
📌 Note: Always apply proper risk management and wait for volume confirmation or supporting indicators before entering any trade.
#KAVA #KAVAUSDT #CryptoBreakout #AltcoinSeason #TechnicalAnalysis #CryptoChart #TradingSignals #BreakoutAlert #CryptoTrading #AltcoinAnalysis #BullishSetup #AccumulationZone

KAVAUSDT 1W AnalysisKAVA ~ 1W Analysis
#KAVA This is the lowest support block for now. Buy from here if you still have faith in this coin with a short term target of at least 15%++
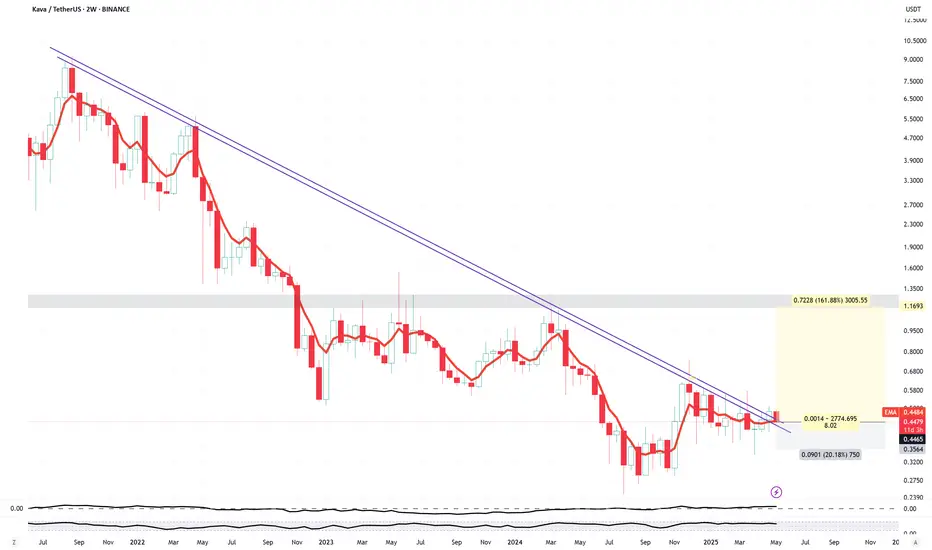
Buy KAVAKava is a decentralized finance (DeFi) platform built on the Cosmos blockchain, designed to offer a wide range of financial services, including lending, borrowing, and staking. Known for its interoperable network architecture, Kava enables users to access various DeFi services in a highly secure, scalable, and user-friendly environment.
In 2W TF, KAVA broke its long-term trendline and is retesting it. Consolidation would take some more weeks before a real take off.
Disclaimer:
This analysis is based on my personnal views and is not a financial advice. Risk is under your control.
KAVAUSDT | Potential Long | POC Support | (June 5, 2025)KAVAUSDT | Potential Long | POC Support + Daily Money Flow Shift | (June 5, 2025)
1️⃣ Insight Summary:
KAVA is currently trading below the value area low and near the Point of Control (POC), suggesting a key decision zone. Despite short-term weakness, the daily money flow is starting to turn positive — this could mark a reversal level worth watching.
2️⃣ Trade Parameters:
Bias: Long
Entry Zone: Around $0.36 near the POC and support
Stop Loss: $0.3598
TP1: $0.4209
TP2: $0.4550
Additional Partial TP Zones: $0.4305, $0.4680, $0.4988
3️⃣ Key Notes:
✅ Structure: Price has been in a sideways move since December 2024, but the bigger downtrend since May 2024 could now be exhausted.
✅ Money Flow: 4H chart shows outflows, but the daily is flipping positive, hinting that buyers may be stepping back in.
📉 Bitcoin Correlation: Keep a close eye on BTC — it drives sentiment. Some spot buys have come in recently without affecting open interest much, suggesting potential for a short squeeze.
🔥 Liquidation Levels: We're trading between two liquidation zones — $0.41 (support) and $0.43 (resistance). A breakout above could squeeze shorts hard.
📆 Monthly View: Monthly data shows heavy short positioning above — further reason to suspect upside if momentum picks up.
🧠 Fundamentals:
KAVA operates in the DeFi space as a layer-1 blockchain, combining Cosmos’ speed with Ethereum’s developer network. It offers decentralized borrowing and lending solutions, aimed at replacing parts of the traditional financial system.
🤝 Partnerships & Innovation:
Key integrations include Akash Network, Finality, and an AI-based upgrade in development. The team includes Brian Kerr and Scott Stuart. Competing with projects like MakerDAO, Aave, and Compound, KAVA could still carve a niche if adoption grows.
4️⃣ Follow-Up:
I'll monitor how KAVA reacts to this support zone. If we see signs of money flow returning and Bitcoin staying strong, upside targets remain in play. Watch for updates as price action develops!
Please LIKE 👍, FOLLOW ✅, SHARE 🙌 and COMMENT ✍ if you enjoy this idea! Also share your ideas and charts in the comments section below! This is best way to keep it relevant, support us, keep the content here free and allow the idea to reach as many people as possible.
Disclaimer: This is not financial advice. Always conduct your own research. This content may include enhancements made using AI.

Kava : Day trade volumeKava can show new volume on day trade volume. We will follow this coin in the coming time frames for the uptrend.

KAVAUSDT Forming a Bullish WaveKAVAUSDT is currently presenting a strong bullish wave pattern formation on the daily timeframe, hinting at a potential continuation of the upward trend. After a period of consolidation, KAVA has started to push higher with increasing bullish momentum. This movement is accompanied by solid volume, suggesting that the current wave could be the beginning of a larger impulse leg. The structure is favorable for swing traders and position traders looking to capture mid-term gains in the range of 60% to 70% or more.
From a technical perspective, the price has respected key support zones and is now forming higher highs and higher lows—a classic sign of a bullish trend in development. The overall market sentiment around KAVA is improving, and this is reflected in its rising trading volumes and increased mentions across crypto discussion platforms. If the bullish wave continues to unfold as expected, KAVA could challenge previous resistance levels and break into a new bullish phase.
KAVA also benefits from growing investor interest due to its strong fundamentals in the DeFi ecosystem. As a cross-chain DeFi platform, KAVA provides lending and stablecoin services, making it an attractive asset in a maturing crypto market. Technical indicators such as RSI and MACD are showing bullish signals, further supporting the case for a significant upside move. With volume surging and structure aligning, KAVA appears well-positioned to deliver a strong breakout rally.
Keep an eye on price levels around recent breakout zones as potential entry points. A successful retest could provide a good risk-reward setup for traders aiming to ride the bullish wave. Continued buying pressure and sustained volume would be key signs of strength in the coming days.
✅ Show your support by hitting the like button and
✅ Leaving a comment below! (What is You opinion about this Coin)
Your feedback and engagement keep me inspired to share more insightful market analysis with you!
KAVA USDT LONGKAVA is breaking out From massive Falling Wedge in Weekly Time Frame,
Everything is supportive here from Fundamentals to Price action with RSI

KAVA ANALYSIS📊 #KAVA Analysis
✅There is a formation of Descending triangle pattern on daily chart 🧐
Pattern signals potential bullish movement incoming after a breakout.
👀Current Price: $0.4280
🚀 Target Price: $0.5380
⚡️What to do ?
👀Keep an eye on #KAVA price action and volume. We can trade according to the chart and make some profits⚡️⚡️
#KAVA #Cryptocurrency #TechnicalAnalysis #DYOR

KAVAUSDT UPDATEPattern: Falling Wedge Breakout
Current Price: $0.4567
Target Price: $0.74
Target % Gain: 60.53%
Technical Analysis: KAVA has broken out of a long-term falling wedge on the 1D chart, with strong bullish momentum and price closing above the trendline resistance. This breakout signals potential continuation toward the projected target.
Time Frame: 1D

Kava potential Reversal and Target ProjectionKAVA is forming a potential bullish reversal after completing Wave 5 within a descending channel, reaching the External Demand Zone. A rally from current levels is anticipated, with initial support at the Immediate Resistance Level.
The setup targets a short-term move to 1.10, then mid-term at 2.25, with a final breakout aimed at 4.97. The pattern suggests strong upside potential, contingent on holding support and breaking through key resistance zones. A confirmed upward break above immediate resistance will validate the bullish projection toward the final target.

Trading opportunity for KAVAUSDTBased on technical factors there is a Sell position in :
📊 KAVAUSDT
🔴 Sell Now
🪫Stop loss 0.4315
🔋Target 0.3300
📏 R/R 2
💸RISK : 1%
We hope it is profitable for you ❤️
Please support our activity with your likes👍 and comments📝

KAVA / USDT - Turning TablesEvening friends,
I've been keeping an eye on Kava, and if the market doesn't shit the bed we might be looking into big gains coming up the next couple of weeks.
Always do your own research, but I do like this coin as it has got good fundamentals.
Trade thirsty!
