$KERNEL Trade On Weekly Demand Zone Understanding Weekly Demand Zone Trading
Demand zone trading focuses on identifying specific price areas on a chart where significant buying pressure has previously caused prices to rise sharply. These zones are considered areas where institutional traders may have accumulated positions, creating a
Related pairs

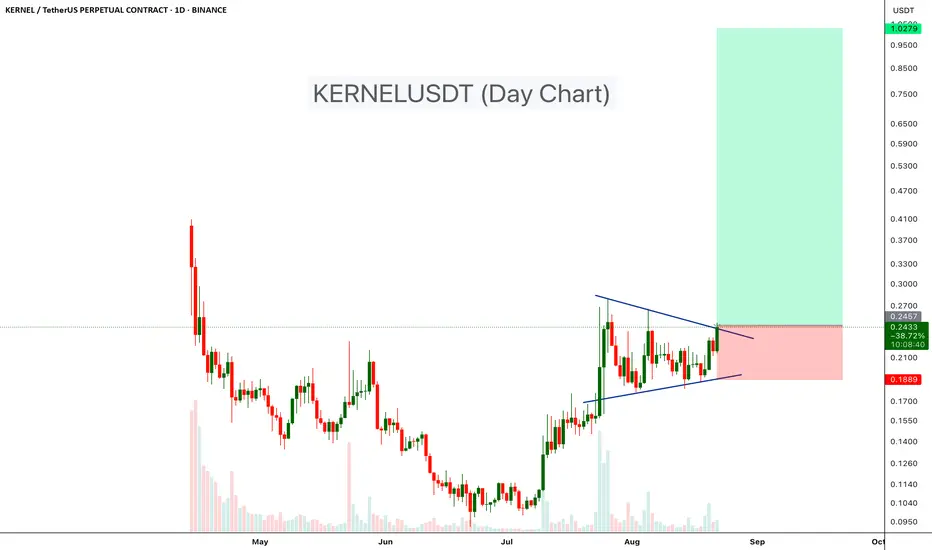
KERNEL/USDT — at the of the Wedge: Breakout or Sideways?🔎 Overview
KERNEL/USDT is currently trading inside a descending wedge pattern — a narrowing channel that often signals a potential bullish breakout. Price is consolidating around 0.2186 USDT, just below the key resistance zone at 0.239 – 0.2565 USDT.
This is a make-or-break area:
A successful bre

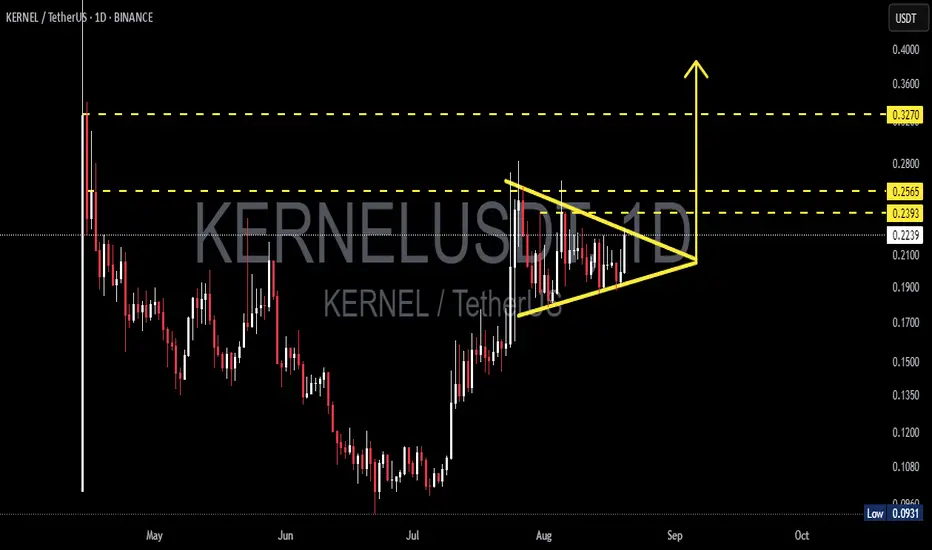
KERNELUSDT 1D#KERNEL is moving within a descending triangle on the daily chart and is on the verge of breaking out above it. If that happens, the potential targets are:
🎯 $0.2367
🎯 $0.2758
🎯 $0.3255
⚠️ Always remember to use a tight stop-loss and follow proper risk management.

KERNELUSDT Wave 2 Correction SetupKernelUSDT has successfully completed Wave 1 of a fresh impulsive rally, and price action is now unfolding into the corrective Wave 2. The projected retracement zone sits around the 50% Fibonacci level, with the possibility of an extended correction toward the 78% Fib zone before the next bullish ph

KERNELUSDT: Trend is UpI have no idea what this coin is, but it looks very good from a technical point of view.
Not advice.

KERNEL / USDT : Breakout confirmed with strong potentialKernel (USDT) Breakout: Short-Term Rally Ahead
Kernel (USDT) has broken out and is now showing strong momentum. With current bullish momentum, we’re expecting a rally towards $0.28 in the short term. Keep an eye on this one – potential for quick gains.
Remember to manage your risk and stay update

KERNELUSDT – Symmetrical Triangle Breakout!KERNELUSDT has been consolidating within a symmetrical triangle pattern on the daily chart, showing a battle between buyers and sellers after a strong uptrend. Recently, price has started breaking above the upper trendline, which could indicate the beginning of a fresh bullish move.
Pattern: Symmet
KERNELUSDT 1D#KERNEL is breaking out above the bullish pennant on the daily chart. In case of a successful retest, the potential targets are:
🎯 $0.2467
🎯 $0.2680
🎯 $0.2893
🎯 $0.3195
🎯 $0.3581
⚠️ As always, use a tight stop-loss and apply proper risk management.

KERNEL/USDT – Symmetrical Triangle Nearing a Major Breakout?📝 Overview
KERNEL price is currently trading around $0.2228, consolidating inside a symmetrical triangle on the daily timeframe. This pattern indicates a period of equilibrium between buyers and sellers, where volatility contracts before a decisive move. While symmetrical triangles often act as cont
KERNEL / USDT : Keep a close watch on breakoutKERNEL/USDT - Near Breakout
Price action is approaching a crucial breakout point after consolidating under a descending trendline. The current momentum indicates a potential upside of around 30%, with a target of 0.28 if the breakout holds.
Watch for a clean breakout above resistance for confirmat

See all ideas
Summarizing what the indicators are suggesting.
Oscillators
Neutral
SellBuy
Strong sellStrong buy
Strong sellSellNeutralBuyStrong buy
Oscillators
Neutral
SellBuy
Strong sellStrong buy
Strong sellSellNeutralBuyStrong buy
Summary
Neutral
SellBuy
Strong sellStrong buy
Strong sellSellNeutralBuyStrong buy
Summary
Neutral
SellBuy
Strong sellStrong buy
Strong sellSellNeutralBuyStrong buy
Summary
Neutral
SellBuy
Strong sellStrong buy
Strong sellSellNeutralBuyStrong buy
Moving Averages
Neutral
SellBuy
Strong sellStrong buy
Strong sellSellNeutralBuyStrong buy
Moving Averages
Neutral
SellBuy
Strong sellStrong buy
Strong sellSellNeutralBuyStrong buy
Frequently Asked Questions
The current price of KERNEL3xShort/Tether (KERNEL) is 1.506 USDT — it has fallen −4.57% in the past 24 hours. Try placing this info into the context by checking out what coins are also gaining and losing at the moment and seeing KERNEL price chart.
KERNEL3xShort/Tether price has risen by 46.78% over the last week, its month performance shows a −63.16% decrease, and as for the last year, KERNEL3xShort/Tether has increased by 48.67%. See more dynamics on KERNEL price chart.
Keep track of coins' changes with our Crypto Coins Heatmap.
Keep track of coins' changes with our Crypto Coins Heatmap.
KERNEL3xShort/Tether (KERNEL) reached its highest price on Aug 15, 2025 — it amounted to 6.068 USDT. Find more insights on the KERNEL price chart.
See the list of crypto gainers and choose what best fits your strategy.
See the list of crypto gainers and choose what best fits your strategy.
KERNEL3xShort/Tether (KERNEL) reached the lowest price of 0.003 USDT on Aug 5, 2025. View more KERNEL3xShort/Tether dynamics on the price chart.
See the list of crypto losers to find unexpected opportunities.
See the list of crypto losers to find unexpected opportunities.
The safest choice when buying KERNEL is to go to a well-known crypto exchange. Some of the popular names are Binance, Coinbase, Kraken. But you'll have to find a reliable broker and create an account first. You can trade KERNEL right from TradingView charts — just choose a broker and connect to your account.
KERNEL3xShort/Tether (KERNEL) is just as reliable as any other crypto asset — this corner of the world market is highly volatile. Today, for instance, KERNEL3xShort/Tether is estimated as 4.86% volatile. The only thing it means is that you must prepare and examine all available information before making a decision. And if you're not sure about KERNEL3xShort/Tether, you can find more inspiration in our curated watchlists.
You can discuss KERNEL3xShort/Tether (KERNEL) with other users in our public chats, Minds or in the comments to Ideas.