$KERNEL Trade On Weekly Demand Zone Understanding Weekly Demand Zone Trading
Demand zone trading focuses on identifying specific price areas on a chart where significant buying pressure has previously caused prices to rise sharply. These zones are considered areas where institutional traders may have accumulated positions, creating an imbalance between supply and demand that can lead to future price increases when the market revisits these levels. When applying this to a weekly timeframe, traders look to identify these zones on weekly charts to locate major areas of demand.
**Important Considerations**
Demand zone trading requires patience, and while often effective, it is not always successful due to factors like news events or strong trends. Combining demand zone analysis with other indicators can provide additional confirmation and improve the strategy.
KERNELUSDT.P trade ideas

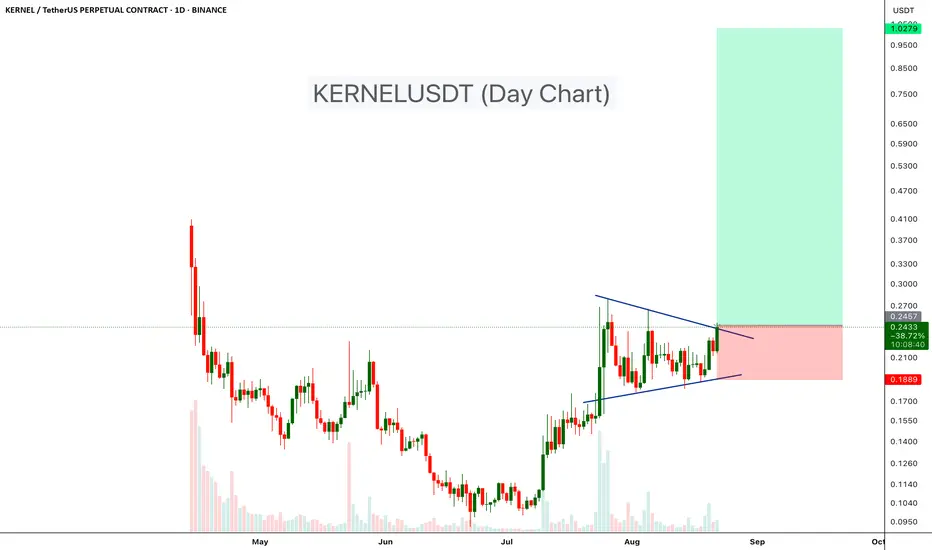
KERNEL/USDT — at the of the Wedge: Breakout or Sideways?🔎 Overview
KERNEL/USDT is currently trading inside a descending wedge pattern — a narrowing channel that often signals a potential bullish breakout. Price is consolidating around 0.2186 USDT, just below the key resistance zone at 0.239 – 0.2565 USDT.
This is a make-or-break area:
A successful breakout above could trigger a strong upward move.
A rejection may push price back to lower wedge supports.
---
🟢 Bullish Scenario
1. A daily close above 0.239 – 0.2565 with strong volume would validate a bullish breakout.
2. If confirmed, upside targets are:
0.3270 USDT (major resistance / wedge target).
Potential extension towards 0.35 – 0.40 USDT if momentum accelerates.
3. Safer approach → wait for a breakout and retest above 0.2565.
4. Potential gains:
From 0.2186 to 0.3270 ≈ +49.6%.
Risk can be limited with a stop loss below 0.238 (around -7% from breakout entry).
---
🔴 Bearish Scenario
1. Failure to break above 0.239 – 0.2565 and a bearish rejection could invite selling pressure.
2. A daily close below 0.18 would confirm bearish continuation.
3. Downside targets:
0.17 USDT (wedge support).
0.0931 USDT (historical low, worst-case scenario).
4. Bearish risk increases if candles close consistently below 0.18 USDT.
---
📌 Pattern & Sentiment
Descending wedge: often leads to a bullish reversal but requires confirmation.
Declining volume: indicates market participants are waiting for a strong catalyst.
Broader crypto market sentiment will also play a major role in determining breakout direction.
---
⚖️ Conclusion
Bullish Key Zone: Breakout above 0.239–0.2565 → target 0.3270.
Bearish Key Zone: Breakdown below 0.18 → downside to 0.17 or even 0.0931.
Neutral Bias: Price remains in consolidation until a decisive breakout occurs.
The best trading approach is to wait for confirmation — either a bullish breakout or a bearish breakdown — before committing to a larger position. This is a clear decision zone for KERNEL.
---
#KERNEL #KERNELUSDT #CryptoAnalysis #AltcoinUpdate #ChartPattern #TechnicalAnalysis #CryptoSignals #WedgePattern #SupportResistance

KERNELUSDT 1D#KERNEL is moving within a descending triangle on the daily chart and is on the verge of breaking out above it. If that happens, the potential targets are:
🎯 $0.2367
🎯 $0.2758
🎯 $0.3255
⚠️ Always remember to use a tight stop-loss and follow proper risk management.

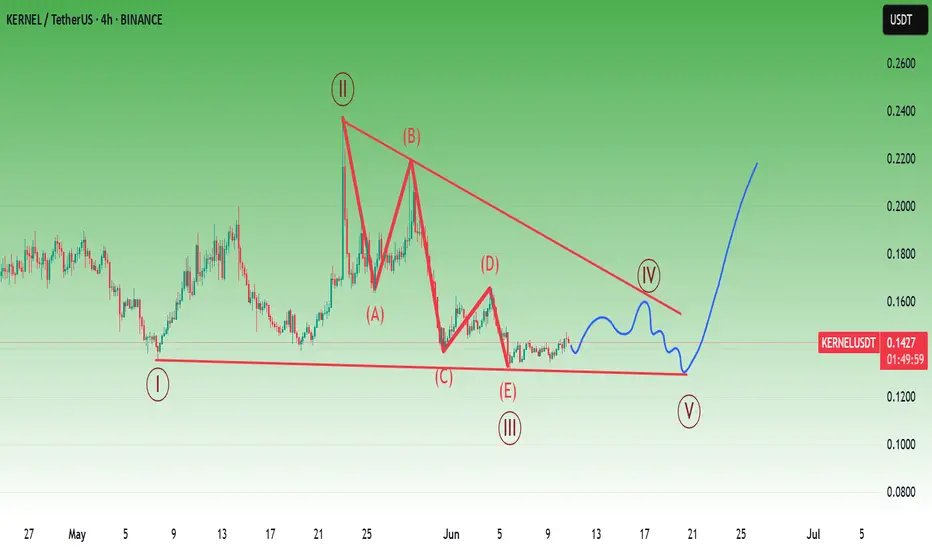
KERNELUSDT Wave 2 Correction SetupKernelUSDT has successfully completed Wave 1 of a fresh impulsive rally, and price action is now unfolding into the corrective Wave 2. The projected retracement zone sits around the 50% Fibonacci level, with the possibility of an extended correction toward the 78% Fib zone before the next bullish phase.
Once Wave 2 completes, we anticipate the next impulsive Wave 3 rally, which often delivers the strongest movement of the cycle. Levels are mapped on the chart for clarity.
What’s your outlook on KERNEL? Share your views below.

KERNELUSDT: Trend is UpI have no idea what this coin is, but it looks very good from a technical point of view.
Not advice.

KERNEL / USDT : Breakout confirmed with strong potentialKernel (USDT) Breakout: Short-Term Rally Ahead
Kernel (USDT) has broken out and is now showing strong momentum. With current bullish momentum, we’re expecting a rally towards $0.28 in the short term. Keep an eye on this one – potential for quick gains.
Remember to manage your risk and stay updated on market conditions. Markets are dynamic, and it’s crucial to stay informed and agile.

KERNELUSDT – Symmetrical Triangle Breakout!KERNELUSDT has been consolidating within a symmetrical triangle pattern on the daily chart, showing a battle between buyers and sellers after a strong uptrend. Recently, price has started breaking above the upper trendline, which could indicate the beginning of a fresh bullish move.
Pattern: Symmetrical Triangle
Entry Zone: Around current breakout levels (~0.24–0.25 USDT)
Target Zone: $0.5 - $1.00
Stop-Loss: Below 0.19 USDT (recent support)
Cheers
Hexa
KERNELUSDT 1D#KERNEL is breaking out above the bullish pennant on the daily chart. In case of a successful retest, the potential targets are:
🎯 $0.2467
🎯 $0.2680
🎯 $0.2893
🎯 $0.3195
🎯 $0.3581
⚠️ As always, use a tight stop-loss and apply proper risk management.

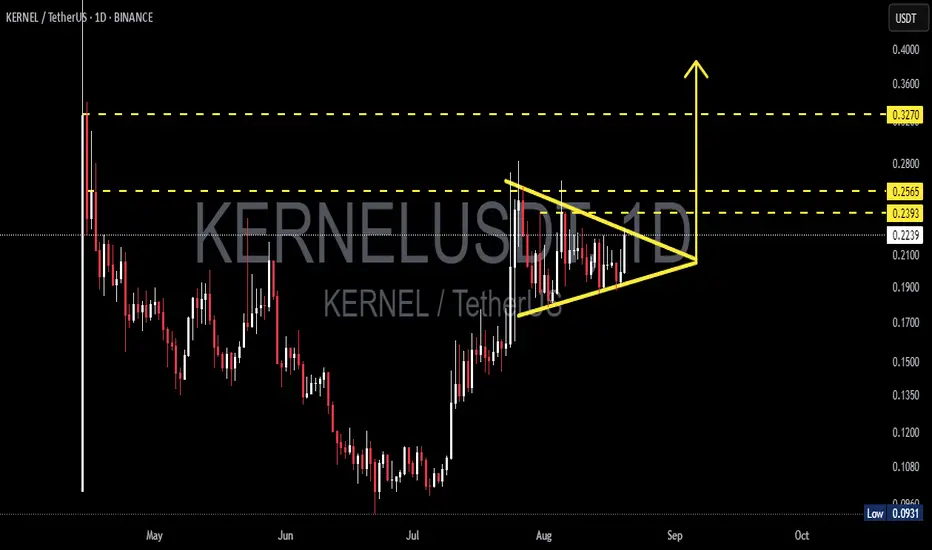
KERNEL/USDT – Symmetrical Triangle Nearing a Major Breakout?📝 Overview
KERNEL price is currently trading around $0.2228, consolidating inside a symmetrical triangle on the daily timeframe. This pattern indicates a period of equilibrium between buyers and sellers, where volatility contracts before a decisive move. While symmetrical triangles often act as continuation patterns, they can also trigger reversals if confirmed by strong volume.
📐 Pattern & Chart Structure
After dropping to a low of $0.0931, KERNEL staged a strong rebound.
Since July–August, the price has been compressing into a series of higher lows and lower highs, forming a classic symmetrical triangle.
Key levels to watch:
🔹 Minor resistance: $0.2393
🔹 Key resistance: $0.2565
🔹 Major resistance: $0.3270
🔹 Dynamic support: $0.210 – $0.218 (triangle bottom)
🔹 Further supports: $0.190 – $0.170
---
🚀 Bullish Scenario (Upside Breakout Potential)
1. A break and daily close above $0.234–$0.236 would be the first confirmation of bullish continuation.
2. With strong volume, upside targets are:
🎯 TP1: $0.2393
🎯 TP2: $0.2565
🎯 TP3: $0.290 – $0.300 (triangle measured move, approx. $0.06)
🎯 Extended target: $0.3270 (major resistance zone)
3. Ideal confirmation: successful retest of the breakout zone ($0.230–$0.235).
4. Bullish invalidation: price closes back inside the triangle after a breakout.
---
🐻 Bearish Scenario (Downside Breakdown Risk)
1. A daily close below $0.216–$0.218 would signal bearish momentum.
2. Downside targets if breakdown occurs:
⚠️ Support 1: $0.210
⚠️ Support 2: $0.190
⚠️ Support 3: $0.170
⚠️ Extreme case: retest of $0.0931 low
3. Bearish invalidation: quick rebound back above $0.224–$0.226 after breakdown.
---
📌 Key Notes
The triangle is getting tighter, meaning a major breakout is imminent.
Direction depends heavily on volume confirmation.
Traders should wait for a daily close outside the triangle before entering.
Always apply risk management since false breakouts are common in this pattern.
---
✨ Conclusion
KERNEL/USDT is at a critical point inside a symmetrical triangle. A breakout above $0.236 could open the path to $0.2565 and potentially $0.3270. On the other hand, a breakdown below $0.217 may trigger further downside toward $0.190–$0.170.
👉 The market is at a decision point — watch closely for the next big move.
#KERNELUSDT #KERNEL #CryptoAnalysis #SymmetricalTriangle #Breakout #PriceAction #Altcoins #TechnicalAnalysis #DailyChart #SupportResistance #CryptoTA #DYOR
KERNEL / USDT : Keep a close watch on breakoutKERNEL/USDT - Near Breakout
Price action is approaching a crucial breakout point after consolidating under a descending trendline. The current momentum indicates a potential upside of around 30%, with a target of 0.28 if the breakout holds.
Watch for a clean breakout above resistance for confirmation of the move. This could lead to a significant upward rally

KERNEL/USDTKey Level Zone: 0.1750 - 0.1950
LMT v2.0 detected.
The setup looks promising—price previously trended upward with rising volume and momentum, then retested this zone cleanly. This presents an excellent reward-to-risk opportunity if momentum continues to align.
Introducing LMT (Levels & Momentum Trading)
- Over the past 3 years, I’ve refined my approach to focus more sharply on the single most important element in any trade: the KEY LEVEL.
- While HMT (High Momentum Trading) served me well—combining trend, momentum, volume, and structure across multiple timeframes—I realized that consistently identifying and respecting these critical price zones is what truly separates good trades from great ones.
- That insight led to the evolution of HMT into LMT – Levels & Momentum Trading.
Why the Change? (From HMT to LMT)
Switching from High Momentum Trading (HMT) to Levels & Momentum Trading (LMT) improves precision, risk control, and confidence by:
- Clearer Entries & Stops: Defined key levels make it easier to plan entries, stop-losses, and position sizing—no more guesswork.
- Better Signal Quality: Momentum is now always checked against a support or resistance zone—if it aligns, it's a stronger setup.
- Improved Reward-to-Risk: All trades are anchored to key levels, making it easier to calculate and manage risk effectively.
- Stronger Confidence: With clear invalidation points beyond key levels, it's easier to trust the plan and stay disciplined—even in tough markets.
Whenever I share a signal, it’s because:
- A high‐probability key level has been identified on a higher timeframe.
- Lower‐timeframe momentum, market structure and volume suggest continuation or reversal is imminent.
- The reward‐to‐risk (based on that key level) meets my criteria for a disciplined entry.
***Please note that conducting a comprehensive analysis on a single timeframe chart can be quite challenging and sometimes confusing. I appreciate your understanding of the effort involved.
Important Note: The Role of Key Levels
- Holding a key level zone: If price respects the key level zone, momentum often carries the trend in the expected direction. That’s when we look to enter, with stop-loss placed just beyond the zone with some buffer.
- Breaking a key level zone: A definitive break signals a potential stop‐out for trend traders. For reversal traders, it’s a cue to consider switching direction—price often retests broken zones as new support or resistance.
My Trading Rules (Unchanged)
Risk Management
- Maximum risk per trade: 2.5%
- Leverage: 5x
Exit Strategy / Profit Taking
- Sell at least 70% on the 3rd wave up (LTF Wave 5).
- Typically sell 50% during a high‐volume spike.
- Move stop‐loss to breakeven once the trade achieves a 1.5:1 R:R.
- Exit at breakeven if momentum fades or divergence appears.
The market is highly dynamic and constantly changing. LMT signals and target profit (TP) levels are based on the current price and movement, but market conditions can shift instantly, so it is crucial to remain adaptable and follow the market's movement.
If you find this signal/analysis meaningful, kindly like and share it.
Thank you for your support~
Sharing this with love!
From HMT to LMT: A Brief Version History
HM Signal :
Date: 17/08/2023
- Early concept identifying high momentum pullbacks within strong uptrends
- Triggered after a prior wave up with rising volume and momentum
- Focused on healthy retracements into support for optimal reward-to-risk setups
HMT v1.0:
Date: 18/10/2024
- Initial release of the High Momentum Trading framework
- Combined multi-timeframe trend, volume, and momentum analysis.
- Focused on identifying strong trending moves high momentum
HMT v2.0:
Date: 17/12/2024
- Major update to the Momentum indicator
- Reduced false signals from inaccurate momentum detection
- New screener with improved accuracy and fewer signals
HMT v3.0:
Date: 23/12/2024
- Added liquidity factor to enhance trend continuation
- Improved potential for momentum-based plays
- Increased winning probability by reducing entries during peaks
HMT v3.1:
Date: 31/12/2024
- Enhanced entry confirmation for improved reward-to-risk ratios
HMT v4.0:
Date: 05/01/2025
- Incorporated buying and selling pressure in lower timeframes to enhance the probability of trending moves while optimizing entry timing and scaling
HMT v4.1:
Date: 06/01/2025
- Enhanced take-profit (TP) target by incorporating market structure analysis
HMT v5 :
Date: 23/01/2025
- Refined wave analysis for trending conditions
- Incorporated lower timeframe (LTF) momentum to strengthen trend reliability
- Re-aligned and re-balanced entry conditions for improved accuracy
HMT v6 :
Date : 15/02/2025
- Integrated strong accumulation activity into in-depth wave analysis
HMT v7 :
Date : 20/03/2025
- Refined wave analysis along with accumulation and market sentiment
HMT v8 :
Date : 16/04/2025
- Fully restructured strategy logic
HMT v8.1 :
Date : 18/04/2025
- Refined Take Profit (TP) logic to be more conservative for improved win consistency
LMT v1.0 :
Date : 06/06/2025
- Rebranded to emphasize key levels + momentum as the core framework
LMT v2.0
Date: 11/06/2025
- Fully restructured lower timeframe (LTF) momentum logic

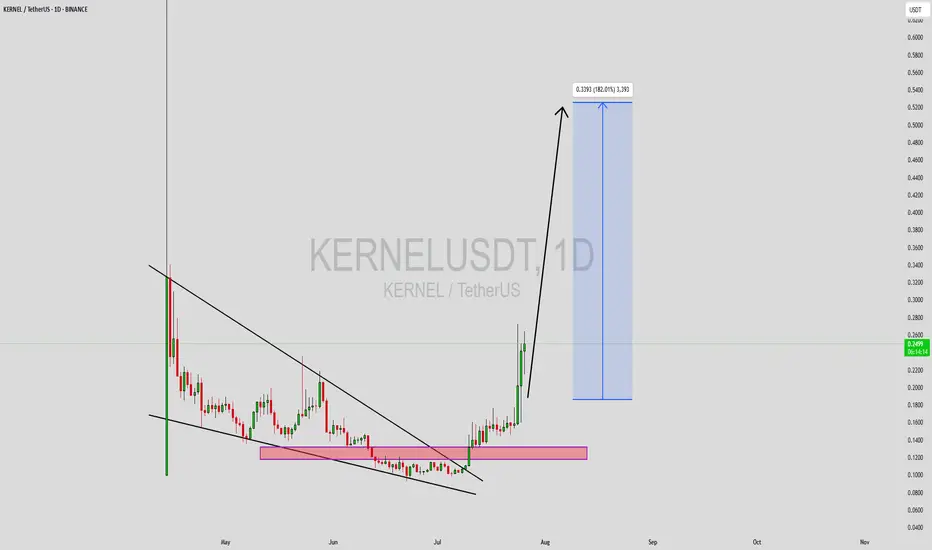
KERNELUSDT Forming Falling WedgeKERNELUSDT is shaping up as a strong breakout candidate, currently trading within a well-defined falling wedge pattern. This technical formation often marks the end of a downtrend and suggests a bullish reversal is near. As the price compresses and approaches the apex of the wedge, we typically see an increase in bullish momentum. In KERNEL's case, the volume is holding steady at promising levels, indicating growing interest and potential accumulation by savvy investors ahead of a breakout.
The falling wedge pattern is widely respected among technical analysts due to its historically high success rate when paired with rising volume and market optimism. KERNELUSDT is offering exactly that setup. With a projected gain of 140% to 150% from the current levels, this crypto pair is attracting traders who are hunting for high-upside opportunities in a consolidating market. Breakouts from such patterns are often sharp and fast, which makes proper timing crucial for maximizing gains.
Market sentiment around the KERNEL project is also improving, with increasing chatter across social platforms and trading communities. This aligns well with the technical structure on the chart and adds further weight to the bullish case. If KERNEL can break above the wedge resistance with volume confirmation, it could quickly surge into price discovery zones not seen in recent weeks.
With all indicators aligning and price tightening within the wedge, KERNELUSDT deserves close attention from technical traders. A well-timed entry here could result in substantial upside if the breakout plays out as expected.
✅ Show your support by hitting the like button and
✅ Leaving a comment below! (What is You opinion about this Coin)
Your feedback and engagement keep me inspired to share more insightful market analysis with you!
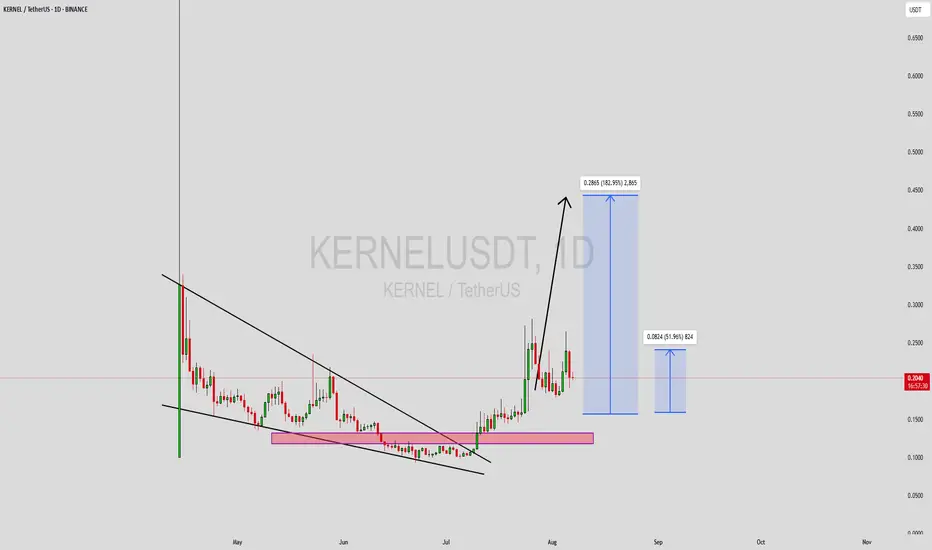
KERNELUSDT Forming Falling WedgeKERNELUSDT has recently completed a significant technical breakout from a well-defined falling wedge pattern, which is known in crypto trading for its strong bullish implications. The asset had been consolidating within this wedge for weeks, forming a base in the demand zone highlighted in the pink region on the chart. Now, after gaining enough strength and momentum, it has broken through resistance with solid bullish candles, signaling the start of a potential parabolic move.
Volume confirmation during the breakout phase is notable—indicating real buying interest rather than a false breakout. Based on this breakout and the current momentum, the expected gain is projected between 170% to 180%+, and the measured move target points toward the $0.33–$0.34 region. KERNELUSDT’s price action has shifted from accumulation to expansion, often the most profitable phase for trend traders. With higher highs and higher lows starting to form, bulls are in clear control.
In addition to the technical pattern, KERNEL appears to be attracting attention from investors, potentially due to its tokenomics, project fundamentals, or upcoming developments. Traders looking for high-reward opportunities with favorable entry points may find this setup ideal, particularly with the recent retest of the breakout zone acting as confirmation. If momentum continues, this rally could easily extend beyond the projected zone.
This is a textbook example of a reversal structure evolving into an explosive breakout. KERNELUSDT is now trending upward strongly, and staying updated on volume surges and any pullbacks to the breakout zone can help traders ride the wave efficiently. The crypto market rewards breakout traders when strong technicals align with market sentiment—and this is one of those moments.
✅ Show your support by hitting the like button and
✅ Leaving a comment below! (What is You opinion about this Coin)
Your feedback and engagement keep me inspired to share more insightful market with you!
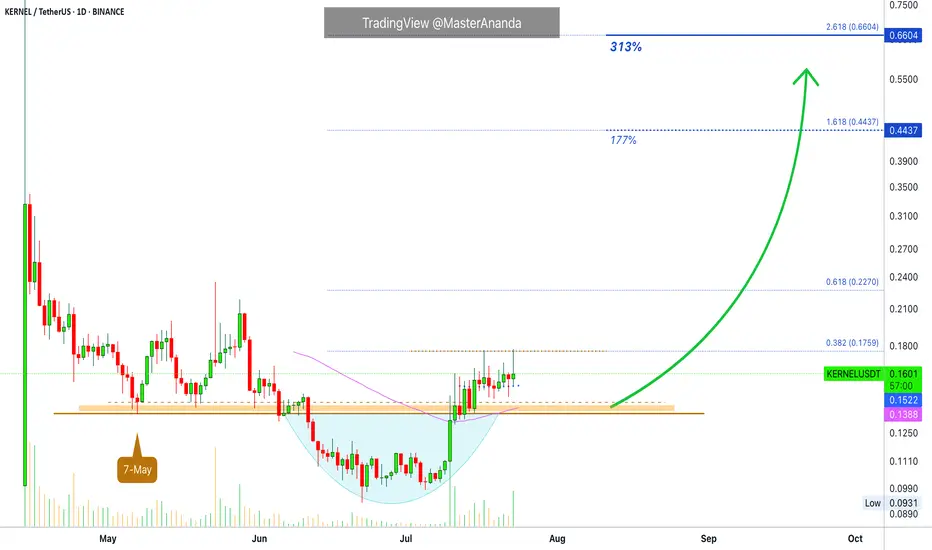
KernelDAO Short-Term Trade Setup · 300% Profits PotentialThis is another strong chart setup. I am looking at the short-term because that is the request I am getting from many of my followers. People are interested now in growing their capital so this can be used to accumulate strong reputable projects later on. Something like double-up, triple-up then grow some more. When enough cash is available; sit back, relax and hold.
The main low here is 7-May. The break below support is the liquidity-hunt event.
After the action recovers above support, bullish confirmed.
Notice KERNELUSDT trading above EMA55 and EMA89 daily.
Trading volume also favors the bullish side. Notice how red days have very low volume. On green days we have the higher numbers of volume spikes. High volume when buying, low volume when selling.
The first target is good and strong for 177%. The second target goes to 300%. This can be achieved easily within 1 month (short-term), or it can extend to two months but not much longer. The trick is to be ready to wait.
If you expect the market to move within hours or days, you might be disappointed. Yes, sometimes it moves fast but this is the exception and not the norm. Better to be prepared to wait a long time and if it moves faster, that's a bonus but we have to be realistic to produce consistent wins. If you want to be in the action, diversification is a good strategy. If you just want to win, patience is key.
Namaste.
KERNEL/USDTKERNEL/USDT is showing strong bullish structure at the current price zone, indicating accumulation and strength from smart money. After a period of consolidation, it's gaining momentum and looks poised to make a parabolic move

KERNELUSDT Poised for Breakout: Double Bottom Signals ReversalDouble bottom pattern forming on BINANCE:KERNELUSDT on daily with bullish follow-through.
Price approaching downtrend resistance — a breakout could trigger a strong upside move.
Targets on breakout:
🟡 Target 1: 0.2066
🟡 Target 2: 0.2384
🟡 Target 3: 0.2734 (+54%)
Watching for daily close above trendline for confirmation.
#KERNELUSDT #CryptoBreakout #ChartPattern #DoubleBottom #AltcoinAnalysis

KERNEL NEAR TERMTo me the view is pretty clear.
* The purpose of my graphic drawings is purely educational.
* What i write here is not an investment advice. Please do your own research before investing in any asset.
* Never take my personal opinions as investment advice, you may lose your money.
$KERNEL Showing Dual-Timeframe Bullish Setup🔥 $KERNEL – Setup in Motion
📉 On the Daily timeframe, $KERNEL is breaking out of a descending triangle — a classic sign that a trend reversal or fresh momentum may be brewing ⚡️
🕓 Meanwhile, on the 4H chart, price is testing a round bottom structure — often a solid base before a potential liftoff 🚀
👁 Dual confirmation across timeframes strengthens the bullish case.
👀 Keep an eye — this setup is gaining traction and could trigger a notable move soon!
WHY WILL IT GO HIGH?Reasons indicating strong potential:
- Large and active community on social media
- High scammer activity
- Trap for inexperienced users: selling on DEX at 3x lower price than on CEX due to low DEX liquidity
Let me know if you'd like it even more formal or formatted for a report.

Is going as it shouldEverything is going according to plan. We are just waiting for the moment of a sharp upward leap...

Everything is sold...The project is new and related to restaking. Most sellers who wanted to exit have likely already done so. The project owners clearly aren’t abandoning it — there’s still activity and intent behind the scenes. The chart shows consistent spot accumulation at increasingly higher prices, suggesting it’s not just one individual buying. I recommend considering a spot position for a 1–2 week timeframe.


$KERNEL’s Bearish MACD Crossover$KERNEL’s MACD crossed bearish on April 14, with price at $0.25. Lower highs persist, targeting $0.1844 support. Bulls need $0.30 reclaim. Always use stops
