Silver To $44, Gold To $4,000!Precious Metals Booom!:
- Silver prices at a 14-year high
- Gold Bullion hit a record high of $3,673.95 on Tuesday
- All precious metals headed for weekly gains
Gold prices rose on Friday, holding close to record highs hit earlier this week, as signs of a weakening U.S. labor market reinforced expectations the Federal Reserve will deliver its first rate cut of the year next week Wednesday.
"Weaker employment and spotty inflation... priced in with the Fed having to cut rates is pushing metals higher because there is the risk of longer-term inflation," said Daniel Pavilonis, senior market strategist at RJO Futures.
"The market is preparing for the Federal Reserve to start cutting rates at the next meeting. The expectation is that this is not only one cut, (while) U.S. President Donald Trump's desire for lower policy rates also lifts gold's appeal," said UBS analyst Giovanni Staunovo.
According to experts, the chances of us seeing lower gold prices going into 2026 is lower than Gold rallying higher into uncharted territories due to the poor revised NFP numbers, higher unemployment rate, increase in inflation, reduced consumer sentiment etc..
What To Lookout For Going Into The Future?
- Discovery Prices @ $3,800 per/oz
- Interest Rates Dropping Will Lead To Cheaper Borrowing Which Intern Increases Purchasing Power To Buy More Gold
- $44 Buyside Liquidity For Silver
KGD1! trade ideas

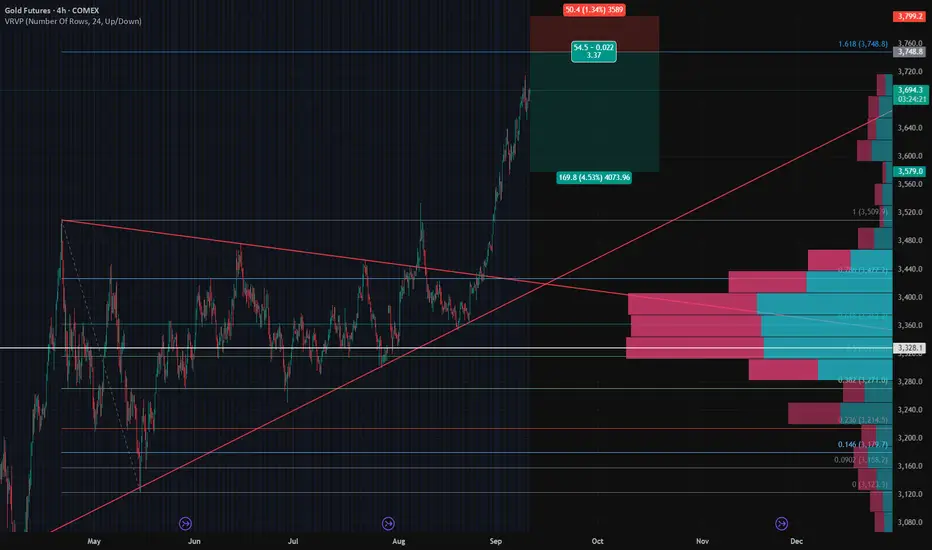
Gold Futures – Short Setup to Lock in Profits🟠 Gold Futures – Short Setup to Lock in Profits
Gold has had a strong breakout above the symmetrical triangle and has now pushed into an extended move near $3,700+. While the trend remains bullish on the higher timeframe, the current leg looks overextended, and I’m looking to hedge profits with a short setup.
🔑 Key Technicals
Pattern Breakout: Gold broke out of a long consolidation wedge and accelerated higher.
Resistance Zone: Price is testing the Fib 1.618 extension near $3,750, a potential exhaustion area.
Volume Profile: Strong demand zone sits between $3,300 – $3,360 where most volume is concentrated. A pullback could retest this area.
Risk-Reward: Setup gives ~1:3.4 RR with stop above recent highs and target into the HVN zone.
📉 Trade Idea – Protective Short
Entry: 3750
Stop Loss: 3800 (extension level).
Take Profit: $3580
⚖️ Strategy
This is not a reversal call – the larger trend is still bullish. The short setup is hedge/profit-protection only, aiming to capture a pullback after the parabolic leg.
I’ll be watching if buyers can defend $3,600 on the first dip; failure to hold could accelerate selling toward the high-volume zone.
📊 Bias
Short-term: Bearish (pullback expected)
Mid-term: Neutral to Bullish (trend intact above $3,300)
What do you think – do we see a healthy correction here, or is gold too strong to fade yet?
Gold Consolidation – Watching 3650 Break for Weekly MoveGold has opened the week consolidating under last week’s highs. Price continues to respect a bearish FVG on the 1H/4H chart, with heavy distribution around the 3675–3680 zone.
For direction:
Break above 3687 (D-H) = liquidity grab above highs before any reversal.
Break below 3654 (D-L) = bearish continuation into last week’s low (3626) and potentially the 8HR FVG around 3520–3550 later this week.
Bias is cautious bearish going into Asian → London session. I’ll be patient for confirmation — the cleanest trigger is an hourly close below yesterday’s low.

Gold futures forcast Bullish continuation steps in?@GoldenZoneFX Follow me for more valuable content and insightful ideas.
"GC1 is in a compression phase following a bullish impulse. Decision zone lies between 3,585 and 3,716. A breakout with volume signals continuation; a rejection points to a return toward support levels. Clean structure—worth monitoring.
Risk is dynamic. Stay adaptive, stay protected.

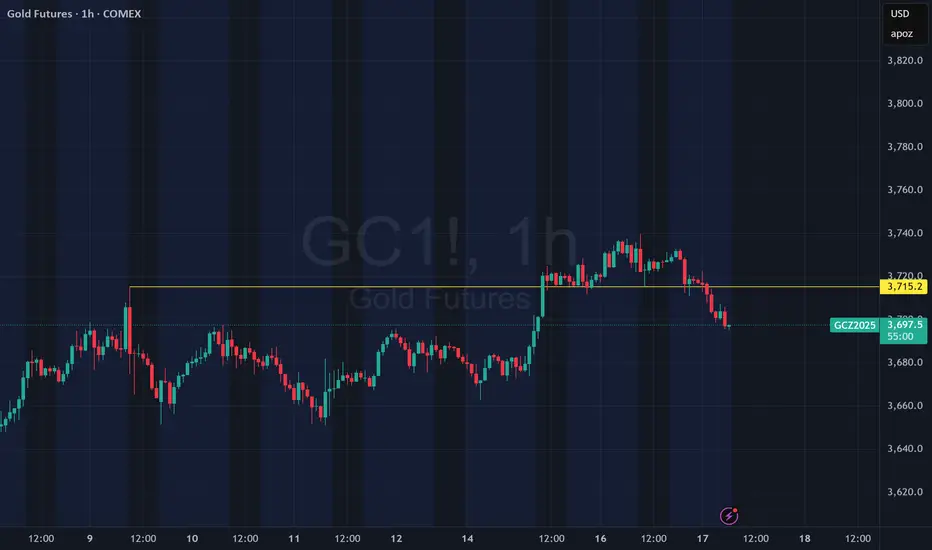
Gold Pauses Ahead of FOMC – Big Move Loading?Gold has been consolidating just below its all-time highs as traders await the Fed’s rate decision tomorrow.
Key levels on my chart:
Resistance: ATH 3737.5 → 3749.8 (DH)
Support: 3715.2 (WH) → 3711.6 (DL)
If the Fed cuts rates more aggressively than expected, Gold could break higher and run liquidity above 3750. On the flip side, a smaller cut or hawkish tone could give the dollar strength, driving Gold lower — first target 3700 → 3680.
I’m staying cautious during Asia and London, expecting chop until NY session. My focus will be on how price reacts after the announcement — that’s where the cleaner opportunities should come.
Patience is key here — the real move is still loading.

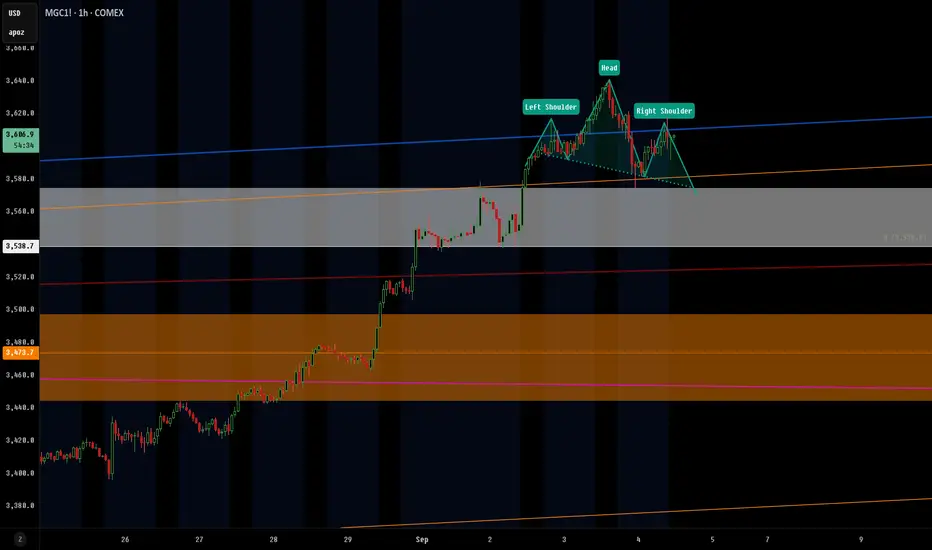
Gold head and shoulders reversalhead and shoulders looks like its forming. at important level rn of 3535, we'll see what happens.
Gold LongWell, Just as identified.
I think lately Gold sold off due to profit taking, greed should take over from here and we might see gold flying up again.
Also stick to this stoploss either the risky or the safe one, my confidence is 55% out of 10.
Be sure to do your own analysis.

Gold Setting Up for Weekly Low Sweep – Watching 3650sGold has stalled out at the highs this week and is showing signs of exhaustion after a strong 2-week bullish run. Thursday’s close left us hovering just above key support in the 3650s.
For Friday, I’m watching for a break and close below yesterday’s low on the 1H chart. If we get that confirmation, I’ll be looking for continuation shorts targeting Monday’s low and potentially the 8HR FVG around 3600–3620 to close out the week.
If bulls defend this level again, then the range may extend — but the cleaner move is down into untested imbalances below.
This sets up Friday as a key day:
✅ Break yesterday’s low = downside liquidity run in play
❌ Hold support again = chop/range into next week

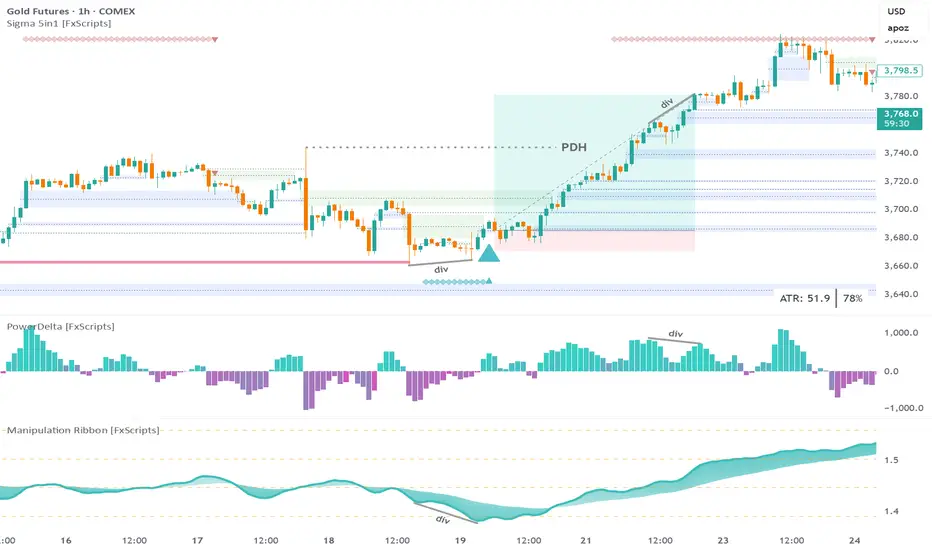
GC Futures 15m: 6.6:1 trade executed using Sigma Trading SystemStep 1: wait for a sweep of daily liquidity
Note: the sweep must be confirmed for any of the other confluences to be valid
Step 2: wait for a bullish marker to be drawn by the Reversal Print indicator
Tip: set an alert if you don’t want to spend all day staring at the chart
Step 3: look for a divergence with either the PowerDelta Oscillator or, in this case, the Manipulation Ribbon
Info: the Manipulation Ribbon detects areas of price manipulation by Market Makers vs areas where it is trading in a natural, price-driven state
Step 4: the entry is a tap of the most recent confirmed FVG
FYI: all the drawings on the main chart are created by the Sigma 5-in-1 indicator
SL: low of first candle that forms the entry FVG
Tip: for a more conservative approach the recent swing low could also be used
TP: bearish divergence with the PowerDelta Oscillator
Note: gold was at an all-time high so anything beyond the Previous Day High (PDH) posed a risk however for a more conservative approach you could exit half your position at the PDH
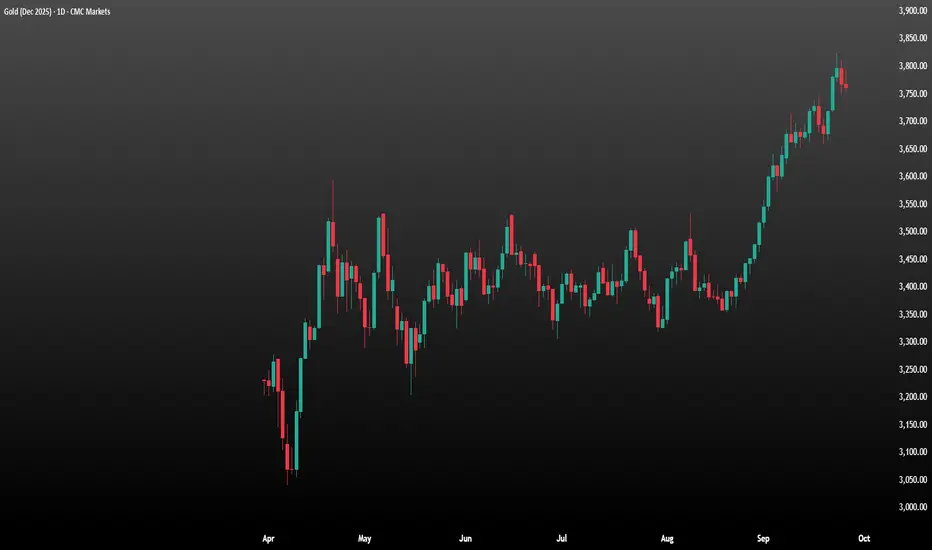
Gold Rally May Soon Collapse Into a BustGold has reached its most overbought level on a monthly basis in 45 years. Not only that, but it is also overbought on a daily and weekly basis, a feat that is not only rare but troubling.
The RSI on gold is now well above 70 on the daily, weekly, and monthly charts. It is not merely that gold’s RSI is above 70 – it has reached a staggering 89.6 on the monthly chart, a level not seen since January 1980, when it peaked at 91.2 and closed that month at $681.50. It then took more than 27 years for gold to register a new monthly closing high in September 2007.
Currently, the weekly chart exhibits similarly overbought conditions, with an RSI reading of 76, while trading above its upper Bollinger band for what appears to be four consecutive weeks. In addition, the %b – which measures how far above the upper Bollinger band the price of gold is – stands at 1.12, indicating that it is historically quite stretched.
The daily chart suggests there may be a little further for gold to rally, but not much, with $3,820 marking the upper end of the trading range. With the RSI currently at 78, sustaining such a rally will be challenging.
While there is precedent for gold to rally further from similarly overbought levels, as seen in the early and mid-1970s, today’s inflation picture is not quite the same. Historically, gold has tended to follow boom-and-bust cycles on a recurring basis over the past 50 years, and there is a good chance that this current move higher will end in a similar fashion.
Written by Michael J. Kramer, founder of Mott Capital Management.
Disclaimer: CMC Markets is an execution-only service provider. The material (whether or not it states any opinions) is for general information purposes only and does not take into account your personal circumstances or objectives. Nothing in this material is (or should be considered to be) financial, investment or other advice on which reliance should be placed.
No opinion given in the material constitutes a recommendation by CMC Markets or the author that any particular investment, security, transaction, or investment strategy is suitable for any specific person. The material has not been prepared in accordance with legal requirements designed to promote the independence of investment research. Although we are not specifically prevented from dealing before providing this material, we do not seek to take advantage of the material prior to its dissemination.
Bottom Buying in GoldIn my recent analysis of Gold Futures, I spotted a classic bottom-buying opportunity on the hourly chart.
Gold was consolidating and testing support around the 50 EMA. Despite a flagpole pattern failure, I trusted the support level and managed my risk carefully. With a tight stop loss, I entered the trade right near the bottom retracement zone.
The result was impressive. Within just 2–3 hours, the trade delivered a strong profit, validating my setup and conviction.
At present, I am trailing my position with proper stop losses, ensuring that I capture as much of the ongoing trend as possible while protecting my gains. I’ll continue to maintain the trail as long as momentum stays active.
This setup reaffirms the value of sticking to disciplined technical analysis and executing with conviction, even when patterns appear to fail.

Gold loosing it's bull strength profit booking can be seen now at these levels Friday can be a game changer

Long trade Trade Journal Entry
Pair: MGC1! (Micro Gold Futures)
Trade Type: Buy-side trade
Date: Sun 29th June 2025
Session: 6.00 PM
TF: 1H
Trade Details:
Entry: 3,904.5
Profit Level: 4,134.5 (+18.47%)
Stop Level: 3,793.0 (–1.18%)
RR: 127.17
Wyckoff Narrative & Structure:
Phase A (Preliminary Support / Selling Climax): Market sold off into spring lows, where high volume absorption signalled potential accumulation.
Phase B (Building the Cause): An extended consolidation range is formed, marked by tests of support and resistance. Smart money accumulated positions while shaking out weak hands.
Phase C (Spring & Test): Price wicked below support to collect liquidity (spring event) before reclaiming the range. The test confirmed demand returning.
Phase D (Markup Initiation): Breakout above resistance with strong volume, creating a Sign of Strength (SOS) and retest zones acting as Last Points of Support (LPS).
Phase E (Trend Continuation): The current price action indicates a bullish continuation, in line with the long-term markup phase, which targets higher extensions (Fib 1.618 and above).
Feeling really good about this trade tbh.

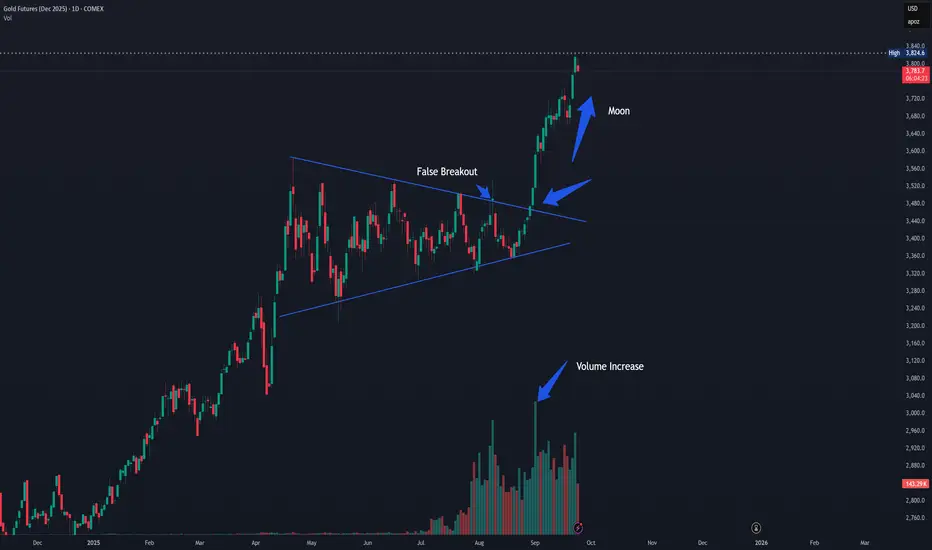
I Should Have Noticed This Pattern (Episode 1)
Just today I zoomed out on my GS chart and noticed for the first time this almost perfect triangle pattern. How did I completely miss this?
-There are many times in my short trading career that I have come across things I should have noticed. Whether it's chart patterns, correlation, volume spikes, or indicators indicating; I kick myself for my neglect!
-Now the least I can do is point out those mistakes and share them with you as I see them, in the hopes that more get noticed in the future.
-This is an example of a symmetrical triangle which is considered the most common type of triangle pattern. Despite the name, the triangle does not have to be symmetrical and like all patterns is evaluated in the approximate. Some imagination is required. Most triangles are a representation of consolidation before continuation, but can sometimes represent a top or bottom before reversal. When price does break out of a triangle, volume should spike and this example clearly shows that. This example also shows a false breakout which would have been discovered when closing for the day back "inside" the pattern. Also like all patterns, the larger the time interval, the more important the pattern. Daily and longer are preferred.
-Again this is what I see after the fact and far too late. I would not enter this trade now. Please let me know if I missed something or if you were able to trade this in real time and there was details that I left out. Also, did anyone make money on noticing this pattern? Am I mistaken in any way?
Do you feel stuck in trading?there's a big percentage of traders being stuck in their journey for the lack of understanding how God wants to bless you in finding a strategy . all we have to do is apply for what he already showed us if not ask where to look and go out there and become that successful trader and be a blessing!!

Recount wave Now gold bias for long because its go to fibo extension daily , so this week can focus long , gold now will be expensive 😅

Gold 4000 GLD 361 by end of 2025Projection based on a comment made by Jeff Gundlach in his post-Fed interest rate cut interview with CNBC.
"I think almost certainly gold will close above 4000 before the end of this year"

MGCZ2025 WEEK 39 SEPT 21STLooking for MON, TUE, WED to be the low of the week, trading into or slightly below 3H BISI. Price should run energetically to break $3744.
Look for buying opportunities once price has broken below $3715. Note that price can run lower into the BOB (Bullish OB) before turning around.
IF- price closes below the 3H OB at $3706. Hold to see if price turn in the lower 3H SIBI instead. You could be wrong in your analysis and price may be trying to run lower.
NOTE we are entering MC-NM. This is typically a retracement which should be to the up side given market structure.
NOTE: you are looking to hold for a 20 point run based on the fib. The best BUYs will be formed below $3723
CALENDAR EVENT
MON
- 12PM - FOMC SPEAKER
TUES
- 9:45AM - PMI (HIGH)
- 12:35AM - POWELL SPEAKS (HIGH)
WED
- 10AM - NEW HOMES SALES
THUR
- 8:30AM - FINAL GDP (HIGH)
- 10AM - EXISTING HOME SALES
FRIDAY
- 8:30AM - CORE PCE INDEX (HIGH)
Final Note
- remember to keep track of midnight/8:30 opening prices. Always refer back to the 1H and 3H
to confirm what side of the market you should be on.
- Alway look to buy in a discount range and sell in a premium range.
Risk- Only risk 150- 200 per trade on initial entry. you can add lots once you confirm trade is good. Refer back to higher TF before adding lots.
Max two trades per session.

Liquidity Sell ModelTrade example from last week.
I wanted to show how the market cycles when it comes to liquidity. Usually price will create a decent high and low during the Asia session (Tokyo and Sydney). Once NY session opens, a sweep either above or below Asia session will occur before the true move occurs.
In this case, price swept above Asia session highs before dropping into SSL.

Gold Bears Trapped at POC - Bulls Load for $3,850 BreakoutThe Market Participant Battle:
Bears attempted to push Gold below the Value Area at point 2 but were decisively trapped and beaten by major institutional buyers. The rejection at the POC (Point of Control) with strong bullish divergences across multiple momentum indicators signals that bulls have regained control. Price is expected to return to test the $3,850 resistance after this bear trap consolidation, with institutional buyers defending the value area high at $3,720.
Confluences:
Confluence 1: Value Area Rejection & POC Defense
The chart shows a textbook rejection at the Value Area High (point 2), with price piercing below but immediately recovering above both the POC and VAH. This is a classic bear trap pattern where aggressive sellers were absorbed by institutional buyers. The anchored VWAP from point 1 shows the 1st standard deviation aligning perfectly with the VAH, creating a powerful confluence of support that trapped late bears and sparked the reversal.
Confluence 2: Quad Bullish Divergence
All four momentum indicators (OBV, RSI, MFI, CDV) made higher lows while price made a lower low at point 2. This is an extremely rare quad divergence setup that historically precedes powerful moves higher. The OBV shows accumulation never stopped, RSI held oversold bounces, MFI indicates money never left, and CDV confirms institutional buying throughout the dip.
Confluence 3: FOMC Rate Cut Catalyst
The Fed just cut rates by 25bps today (September 17) with Governor Miran dissenting for larger cuts. The dot plot suggests two more cuts coming in 2025. Gold historically performs strongly during rate cutting cycles, with average gains of 14% in the year following initial cuts when markets are near highs.
Web Research Findings:
- Technical Analysis: Gold holding above $3,670 with immediate resistance at $3,700-3,720, major resistance at $3,850
- Recent News/Earnings: Fed cut rates 25bps today, markets pricing 93% chance of continued cuts through year-end
- Analyst Sentiment: Goldman Sachs targets $3,700+ for 2025, World Gold Council sees 0-5% upside in H2
- Data Releases & Economic Calendar: CPI at 2.9% (above 2% target), unemployment rising, suggesting stagflationary environment
- Interest Rate Impact: Real rates turning negative as inflation exceeds rate cuts - historically bullish for gold
Layman's Summary:
The Fed just started cutting interest rates today while inflation is still high (2.9%), creating the perfect storm for gold. When the Fed cuts rates but inflation stays elevated, gold becomes the go-to asset because cash loses value. Big banks are already positioned for this - central banks bought record amounts of gold in 2025. The technical setup shows major buyers stepped in exactly where they should (at the value area), creating a bear trap that should spring gold higher toward $3,850.
Machine Derived Information:
- Image 1: Shows numbered reference points 1-4 with clear bear trap at point 2, target at $3,856 - Significance: Classic V-reversal at value area with institutional footprints - AGREES ✔
- Image 2: Displays quad divergence across OBV/RSI/MFI/CDV indicators - Significance: Extremely bullish momentum divergence rarely seen, confirms accumulation - AGREES ✔
Actionable Machine Summary:
The AI analysis confirms a textbook bear trap setup at a critical technical level (Value Area/POC) combined with an ultra-rare quad divergence across all momentum indicators. The timing with today's FOMC rate cut creates a fundamental catalyst to trigger the technical spring-load. Stop placement is clear below point 2 at $3,706, with initial target at VAH retest ($3,720) before continuation to $3,850+.
Conclusion:
Trade Prediction: SUCCESS
Confidence: High
This setup combines the perfect storm of technical and fundamental factors. Bears were trapped attempting to break value area support just as the Fed initiated its rate cutting cycle. The quad divergence is exceptionally rare and historically precedes 5-10% moves. With inflation still elevated at 2.9% and rates being cut, gold's traditional role as an inflation hedge is activated. Risk/Reward is excellent with tight stop below $3,706 and targets at $3,850+, offering 4:1 R/R.

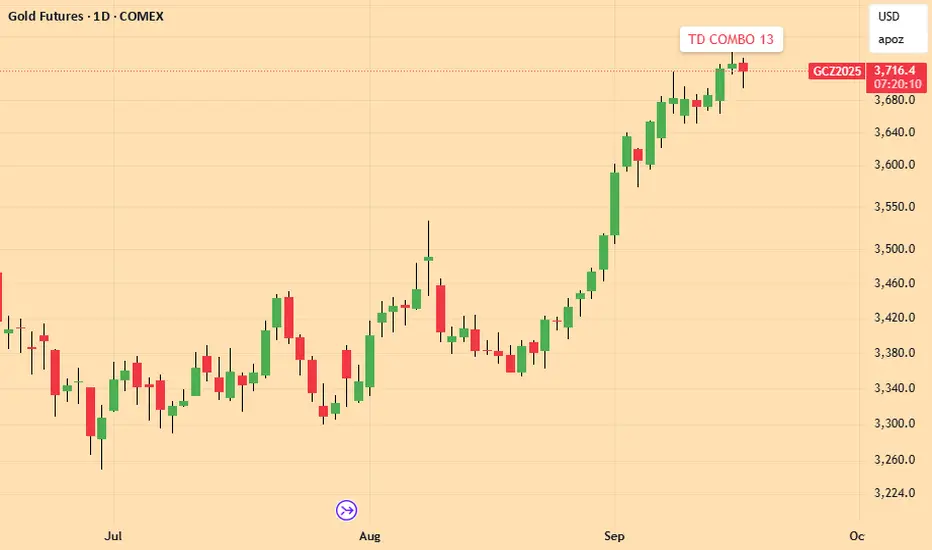
GOLD : SELL TD COMBO 13 posted yesterday 16th SeptemberThe famous Tom DeMark indicator posted a 13 Countdown on Tuesday 16th September, meaning that Gold has entered a selling area.
Gold Range Took a bit of time but they did bring Gold prices back into the range. I cant say how the Gold market will react for the Fed but there is potential for Gold to range at these price for a bit based on 9 Sept expressing sellers present. I think gold will resume out of the range but possibly not until the end of the month.
#GoldRange
#goldtrading
Gold Ready To Fold?Gold (GC1!) — 1.414 Tag + Max Gartley PRZ: Is This the High?
I’m mapping a short off a full confluence cluster at the highs.
Why I’m short here (stacked signals)
3-Month 1.414 extension hit: price is sitting right at ~3,722 (1.414 on the 3M chart). That’s classic terminal PRZ behavior.
Daily “Max Gartley” complete: harmonic PRZ lands 3,710–3,735; price tagged/hovered there.
Volume/CVD divergence across TFs: daily, weekly, monthly show higher price on weaker buy volume / softer positive delta → exhaustion.
Weekly momentum divergence: MACD lower high vs price higher high; histogram rolling off = bearish momentum divergence.
Band/structure context: riding the upper Bollinger with long upper wicks into red channel resistance; rising-wedge/parallel rail touch.
Measured moves: last leg ≈ prior leg; AB=CD ≈ 1:1 completes ~3,720–3,735, inside the PRZ.
Round-number + prior shelf: 3,700 is a heavy pivot; failure to extend above 3,739–3,742 on strong delta = absorption at the top.
Extra confirmations I’m watching live
CVD/Delta: push above 3,735 without new CVD highs = add to short.
Spread/financing: widening bid–ask / negative basis into spikes = top-y behavior.
Heikin-Ashi: upper shadows / color flip on daily/weekly strengthen the reversal case.
Bottom line: This is a short right now into 3,716–3,736 with risk 3,751. The confluence—3M 1.414, daily Max Gartley, multi-TF volume divergence, weekly MACD div, and channel resistance—points to a swing lower toward 3,700 → 3,673 → 3,641, with room to 3,566/3,551 if momentum cracks.
