LABUSDT has recently spiked by +14.44%, showing signs of life afLABUSDT has recently spiked by +14.44%, showing signs of life after a long period of bottoming out. The STC has just hit the 100 mark for the first time in months, which often precedes a major trend shift. While the price is testing the upper Bollinger Band, the CCI_S at 65.68 indicates there is sti
Related pairs

LAB: $0.19 | AmberLyn's entry in the TELEGRAM spacedesigned for TELEGRAM users
and claims to be the ultimate trading platform
to launch and grow memes
as the trend is towards COMMUNiTiES
what better way to address TON NETWORK

LAB technicals looking prime for a bounce LAB technicals looking prime for a bounce 🚀 Meanwhile, Binance kicks off a NASDAQ:LAB trading contest on Alpha from Nov 28 to Dec 12
Proof the hype machine never sleeps, and neither do traders chasing those sweet contest prizes 😏📈

LAB PERPETUAL TRADE SELL SETUP Short from $0.32800LAB PERPETUAL TRADE
SELL SETUP
Short from $0.32800
Currently $0.32800
Targeting $0.30400 or Down
(Trading plan IF LAB
go up to $0.36 will add more shorts)
Follow the notes for updates
In the event of an early exit,
this analysis will be updated.
Its not a Financial advice

$LAB broke out of consolidation and pumped over 20% right after NASDAQ:LAB broke out of consolidation and pumped over 20% right after breakout. Momentum looks healthy watching for continuation if volume sustains. Another solid Crypto Skull Signal play. ✅
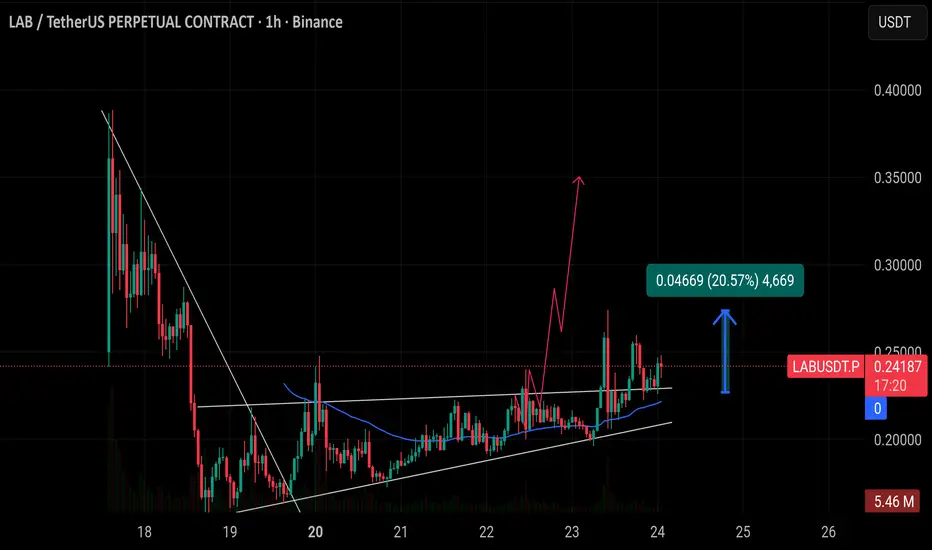
$LAB/USDT is testing a key breakout zone again after steady $LAB/USDT is testing a key breakout zone again after steady accumulation. Buyers are holding strong between $0.19–$0.20, keeping bullish momentum alive. A confirmed move above $0.225 could send it toward $0.30–$0.35, while holding support will be crucial for the next explosive leg up. 💥
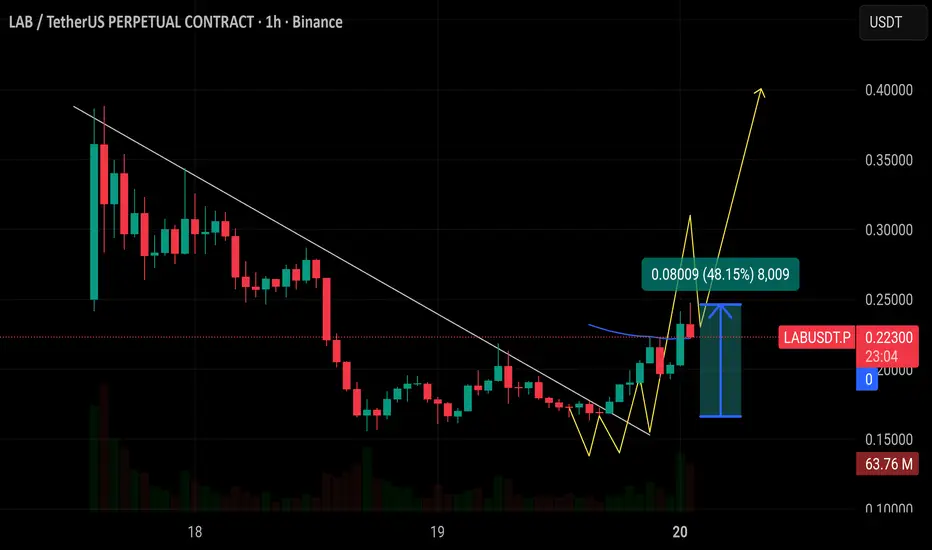
$LAB/USDT just broke out of its downtrend and jumped about 48%. $LAB/USDT just broke out of its downtrend and jumped about 48%. Buyers are clearly gaining control now. If it stays above $0.20–$0.18, the next targets could be around $0.35–$0.40.
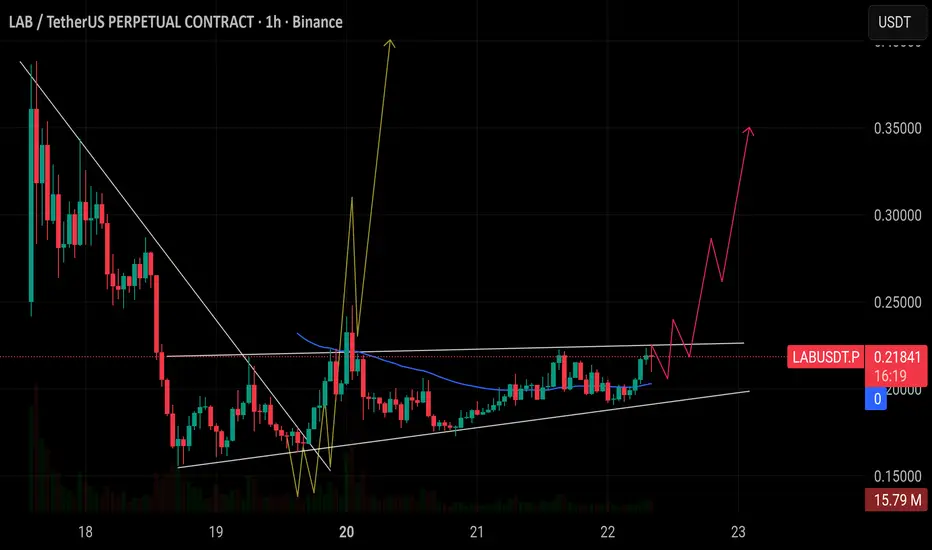
$LAB/USDT has been consolidating under a strong descending trend$LAB/USDT has been consolidating under a strong descending trendline, showing signs of exhaustion in selling pressure. The structure suggests that a breakout is brewing if price breaks and holds above this trendline, it could trigger a strong bullish move toward the $0.35–$0.40 range. Buyers seem t
See all ideas
Summarizing what the indicators are suggesting.
Oscillators
Neutral
SellBuy
Strong sellStrong buy
Strong sellSellNeutralBuyStrong buy
Oscillators
Neutral
SellBuy
Strong sellStrong buy
Strong sellSellNeutralBuyStrong buy
Summary
Neutral
SellBuy
Strong sellStrong buy
Strong sellSellNeutralBuyStrong buy
Summary
Neutral
SellBuy
Strong sellStrong buy
Strong sellSellNeutralBuyStrong buy
Summary
Neutral
SellBuy
Strong sellStrong buy
Strong sellSellNeutralBuyStrong buy
Moving Averages
Neutral
SellBuy
Strong sellStrong buy
Strong sellSellNeutralBuyStrong buy
Moving Averages
Neutral
SellBuy
Strong sellStrong buy
Strong sellSellNeutralBuyStrong buy
Displays a symbol's price movements over previous years to identify recurring trends.
Frequently Asked Questions
The current price of LAB / Tether USD (LAB) is 0.1135 USDT — it hasn't changed in the past 24 hours. Try placing this info into the context by checking out what coins are also gaining and losing at the moment and seeing LAB price chart.
LAB / Tether USD price hasn't changed in a week, its month performance shows a 8.30% increase, and as for the last year, LAB / Tether USD has increased by 440.48%. See more dynamics on LAB price chart.
Keep track of coins' changes with our Crypto Coins Heatmap.
Keep track of coins' changes with our Crypto Coins Heatmap.
LAB / Tether USD (LAB) reached its highest price on Dec 29, 2025 — it amounted to 0.4125 USDT. Find more insights on the LAB price chart.
See the list of crypto gainers and choose what best fits your strategy.
See the list of crypto gainers and choose what best fits your strategy.
LAB / Tether USD (LAB) reached the lowest price of 0.0210 USDT on Oct 16, 2025. View more LAB / Tether USD dynamics on the price chart.
See the list of crypto losers to find unexpected opportunities.
See the list of crypto losers to find unexpected opportunities.
The safest choice when buying LAB is to go to a well-known crypto exchange. Some of the popular names are Binance, Coinbase, Kraken. But you'll have to find a reliable broker and create an account first. You can trade LAB right from TradingView charts — just choose a broker and connect to your account.
You can discuss LAB / Tether USD (LAB) with other users in our public chats, Minds or in the comments to Ideas.