LATENT VIEWLatent View Analytics Ltd. (currently trading near ₹485.45) – Overview Latent View Analytics Ltd., headquartered in Chennai, is one of India’s fastest-growing digital analytics firms. The company provides business analytics, consulting, data engineering, and digital solutions. Its offerings span: •
Latent View Analytics Limited
No trades
Next report date
—
Report period
—
EPS estimate
—
Revenue estimate
—
9.65 INR
1.74 B INR
8.48 B INR
59.18 M
About Latent View Analytics Limited
Sector
CEO
Rajan Sethuraman
Website
Headquarters
Chennai
Founded
2006
IPO date
Nov 23, 2021
Identifiers
2
ISIN INE0I7C01011
Latent View Analytics Ltd. provides data analytics services. Its services include marketing, business, supply chain, and risk and compliance analytics. The firm also offers solutions such as DigiView, Jarvis, Limerick, and Solvelt. The company was founded by Adugudi Venkat Viswanathan and Pramad Jandhyala on January 3, 2006 and is headquartered in Chennai, India.
Related stocks

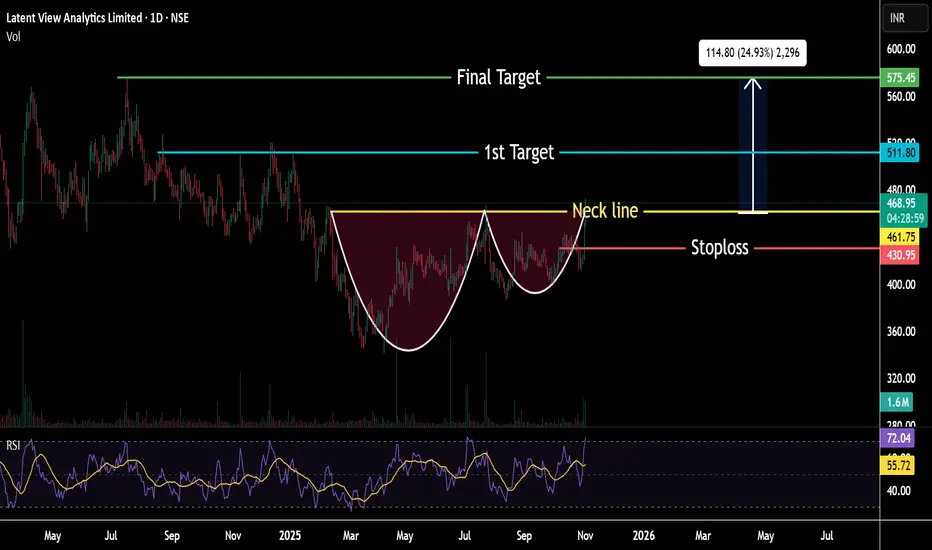
Cup & Handle Pattern Breakout in Latent ViewLatent View given Cup & Handle Pattern Breakout from neckline arround 460 level on daily & weekly chart. Possible upside target will be 510 & 575 with a stoploss of 530 Rs. RSI & MACD also indicating positive momentum.
It's not a buy or sell call ..For education only
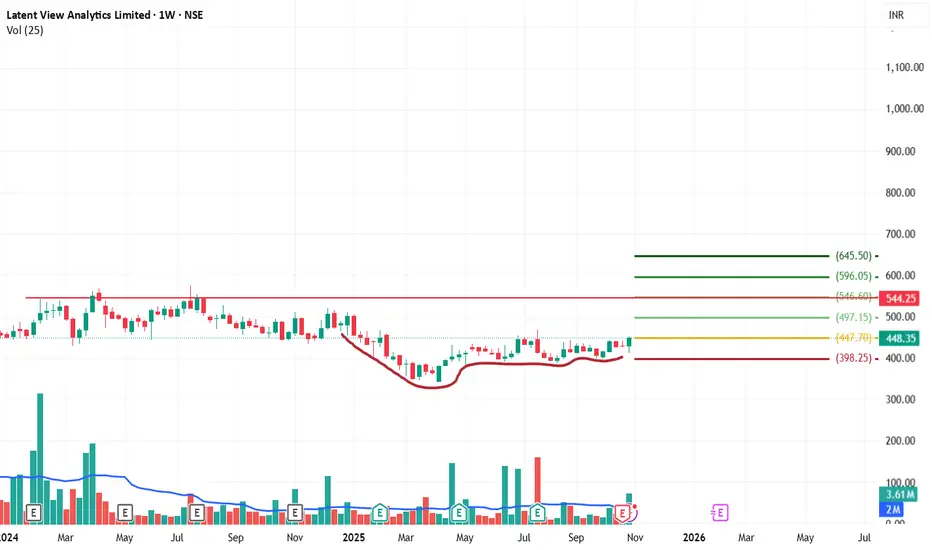
Latentview (NSE) (W)- In Accumulation phase with VCP Price Action
The stock is showing signs of a potential recovery after a prolonged downtrend. It has formed a base structure and appears to be consolidating after a period of volatility. The price has recently tested resistance and is now stabilizing at slightly lower levels, which could indicate a
Immediate p.t.480Has crossed 15months falling channel and 3months parallel channel consolidation. Only for study purpose.

LATENTVIEW long setupLATENT view long setup
Entry - 414.2
SL - 410.15
TGT - 434.2
Risk Reward - 1:4.94

LATENTVIEW | Buy @LTP | SL below 380 | 1st Target 690Disclaimer:
This is not financial advice. Please do your own research or consult with a financial advisor before making any investment decisions. Investments in stocks can be risky and may result in loss of capital.


LATENTVIEWLATENTVIEW
watch above levels. green line is our entry, redline is our SL.
DISCLAIMER : I am NOT a SEBI registered advisor or a financial adviser. All the views are for educational purpose only.

Good order block momentum Zone Buy Cmp first target 560 if first target break next target 700
Stoploss 450
Holding period 5-15 days for first target
Holding period 2-3 months for second target

POTENTIAL LONG OPPORTUNITY IN LATENTVIEW AFTER GOOD RESULTSLATENTVIEW has reported a 34% rise in Y-o-Y Sales and 17% rise in Y-o-Y Profits.
PRICE ACTION:
WEEKLY: Stock is trading within a range.
DAILY: Stock has broken out of a downward trendline.
RATIONALE: The good quarterly results might act as trigger point in pushing the price up to the previous resi

See all ideas
Summarizing what the indicators are suggesting.
Neutral
SellBuy
Strong sellStrong buy
Strong sellSellNeutralBuyStrong buy
Neutral
SellBuy
Strong sellStrong buy
Strong sellSellNeutralBuyStrong buy
Neutral
SellBuy
Strong sellStrong buy
Strong sellSellNeutralBuyStrong buy
An aggregate view of professional's ratings.
Neutral
SellBuy
Strong sellStrong buy
Strong sellSellNeutralBuyStrong buy
Neutral
SellBuy
Strong sellStrong buy
Strong sellSellNeutralBuyStrong buy
Neutral
SellBuy
Strong sellStrong buy
Strong sellSellNeutralBuyStrong buy
Displays a symbol's price movements over previous years to identify recurring trends.
SMALLCAP
Mirae Asset Nifty Smallcap 250 Momentum Quality 100 ETF Units Exchange Traded FundWeight
0.41%
Market value
342.25 K
USD
MIDSMALL
Mirae Asset Nifty MidSmallcap400 Momentum Quality 100 ETFWeight
0.15%
Market value
65.42 K
USD
MOSMALL250
Motilal Oswal Nifty Smallcap 250 ETF Units Exchange Traded FundWeight
0.16%
Market value
26.38 K
USD
MULTICAP
Mirae Asset Nifty500 Multicap 502525 ETF Exchange Traded Fund UnitsWeight
0.04%
Market value
2.83 K
USD
SMALL250
Mirae Asset Nifty Smallcap 250 ETF Exchange Traded Fund UnitsWeight
0.16%
Market value
2.54 K
USD
Explore more ETFs
Frequently Asked Questions
The current price of LATENTVIEW is 426.95 INR — it has decreased by −0.27% in the past 24 hours. Watch Latent View Analytics Limited stock price performance more closely on the chart.
Depending on the exchange, the stock ticker may vary. For instance, on NSE exchange Latent View Analytics Limited stocks are traded under the ticker LATENTVIEW.
LATENTVIEW stock has risen by 8.09% compared to the previous week, the month change is a −7.19% fall, over the last year Latent View Analytics Limited has showed a −6.88% decrease.
We've gathered analysts' opinions on Latent View Analytics Limited future price: according to them, LATENTVIEW price has a max estimate of 630.00 INR and a min estimate of 495.00 INR. Watch LATENTVIEW chart and read a more detailed Latent View Analytics Limited stock forecast: see what analysts think of Latent View Analytics Limited and suggest that you do with its stocks.
LATENTVIEW reached its all-time high on Nov 26, 2021 with the price of 754.90 INR, and its all-time low was 305.25 INR and was reached on Jun 20, 2022. View more price dynamics on LATENTVIEW chart.
See other stocks reaching their highest and lowest prices.
See other stocks reaching their highest and lowest prices.
LATENTVIEW stock is 3.68% volatile and has beta coefficient of 1.50. Track Latent View Analytics Limited stock price on the chart and check out the list of the most volatile stocks — is Latent View Analytics Limited there?
Today Latent View Analytics Limited has the market capitalization of 88.20 B, it has decreased by −0.79% over the last week.
Yes, you can track Latent View Analytics Limited financials in yearly and quarterly reports right on TradingView.
Latent View Analytics Limited is going to release the next earnings report on May 12, 2026. Keep track of upcoming events with our Earnings Calendar.
LATENTVIEW net income for the last quarter is 501.42 M INR, while the quarter before that showed 443.93 M INR of net income which accounts for 12.95% change. Track more Latent View Analytics Limited financial stats to get the full picture.
No, LATENTVIEW doesn't pay any dividends to its shareholders. But don't worry, we've prepared a list of high-dividend stocks for you.
As of Feb 8, 2026, the company has 1.13 K employees. See our rating of the largest employees — is Latent View Analytics Limited on this list?
EBITDA measures a company's operating performance, its growth signifies an improvement in the efficiency of a company. Latent View Analytics Limited EBITDA is 2.24 B INR, and current EBITDA margin is 23.59%. See more stats in Latent View Analytics Limited financial statements.
Like other stocks, LATENTVIEW shares are traded on stock exchanges, e.g. Nasdaq, Nyse, Euronext, and the easiest way to buy them is through an online stock broker. To do this, you need to open an account and follow a broker's procedures, then start trading. You can trade Latent View Analytics Limited stock right from TradingView charts — choose your broker and connect to your account.
Investing in stocks requires a comprehensive research: you should carefully study all the available data, e.g. company's financials, related news, and its technical analysis. So Latent View Analytics Limited technincal analysis shows the sell today, and its 1 week rating is sell. Since market conditions are prone to changes, it's worth looking a bit further into the future — according to the 1 month rating Latent View Analytics Limited stock shows the sell signal. See more of Latent View Analytics Limited technicals for a more comprehensive analysis.
If you're still not sure, try looking for inspiration in our curated watchlists.
If you're still not sure, try looking for inspiration in our curated watchlists.