Ldo become scamWhile all market bleeding scam team decide to sell tokens on 1m$
while lowcaps and scam coin -10% on dump,this "top staking" project -16% and continued dumping,lol
Related pairs

#LDO/USDT — Critical Retest at Demand Zone vs Long-Term Downt#LDO
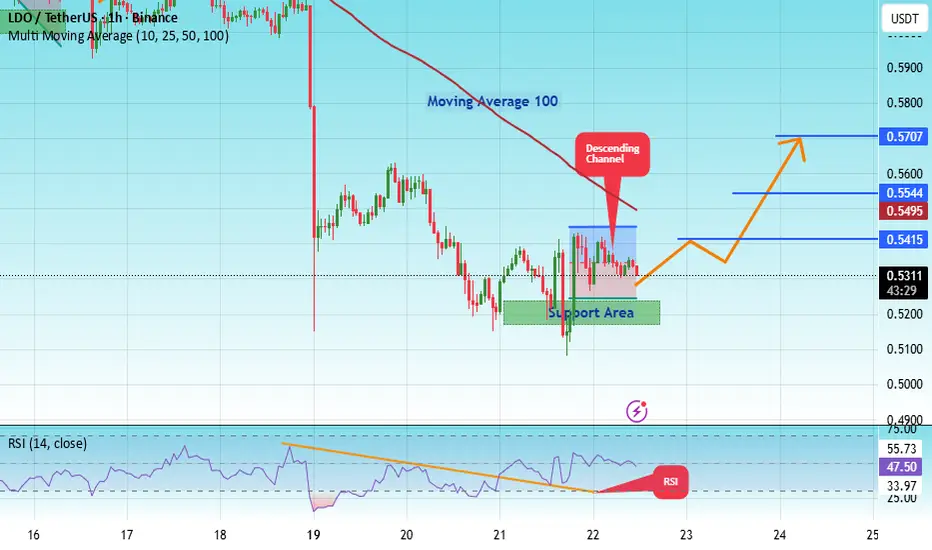
The price is moving within a descending channel on the hourly timeframe. It has reached the lower boundary and is heading towards a breakout, with a retest of the upper boundary expected.
The Relative Strength Index (RSI) is showing a downward trend, approaching the lower boundary, and an upw

#LDO/USDT — Critical Retest at Demand Zone vs Long-Term Downt#LDO
The price is moving within a descending channel on the hourly timeframe. It has reached the lower boundary and is heading towards a breakout, with a retest of the upper boundary expected.
The Relative Strength Index (RSI) is showing a downward trend, approaching the lower boundary, and an upw

LDOUSDT algotrading long setupPress "Grab this chart", run strategy tester for entire history and make sure that is good time for a long to yellow line.

#LDO/USDT — Critical Retest at Demand Zone vs Long-Term Downt#LDO
The price is moving within a descending channel on the hourly timeframe. It has reached the lower boundary and is heading towards a breakout, with a retest of the upper boundary expected.
The Relative Strength Index (RSI) is showing a downward trend, approaching the lower boundary, and an upw
#LDO/USDT — Critical Retest at Demand Zone vs Long-Term Downt#LDO
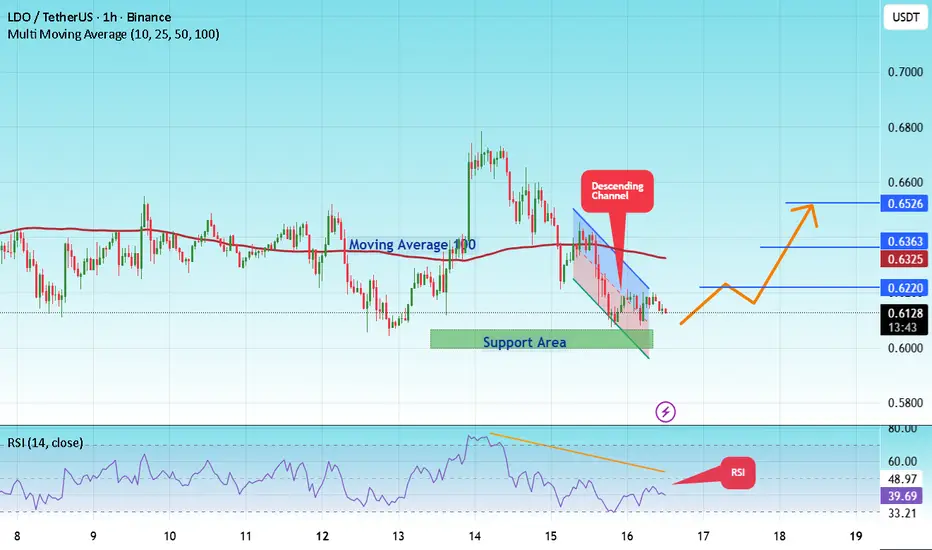
The price is moving within a descending channel on the hourly timeframe. It has reached the upper boundary and is heading towards breaking it. A retest of this boundary is expected.
The Relative Strength Index (RSI) is showing an upward trend, as it has approached the upper boundary. A bearis
#LDO/USDT — Critical Retest at Demand Zone vs Long-Term Downt#LDO
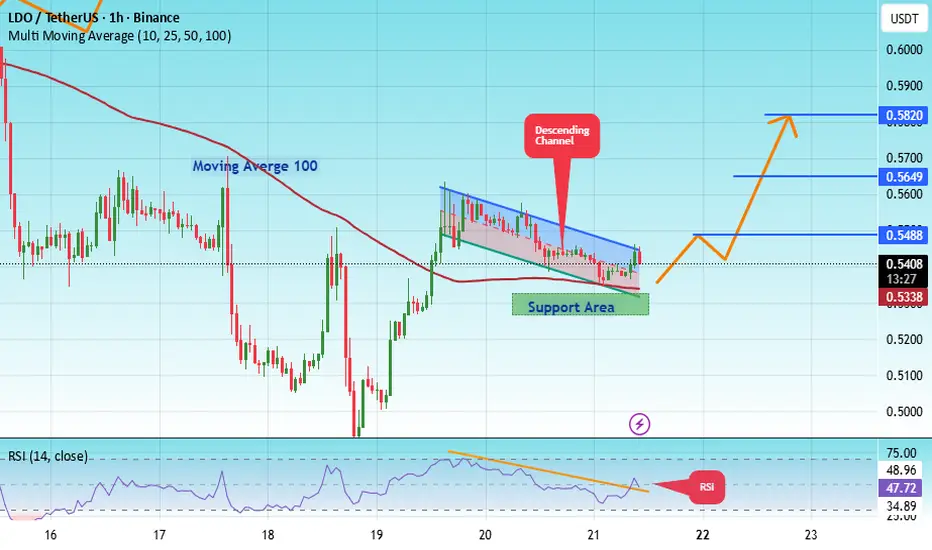
The price is moving in a descending channel on the 1-hour timeframe. It has reached the lower boundary and is heading towards a breakout, with a retest of the upper boundary expected.
We are seeing a bearish bias in the Relative Strength Index (RSI), which has reached near the lower boundary,

LDO Looks Bullish (4H)This symbol is in a symmetrical pattern, and it seems that wave G, which was an ABC, has completed.
Key areas have been cleared, and if we are lucky, we can enter a long/buy position on the pullback.
We have two entry points, which we will enter using DCA.
The targets are marked on the chart.
A

LDOUSDT UPDATE#LDO
UPDATE
DGB Technical Setup
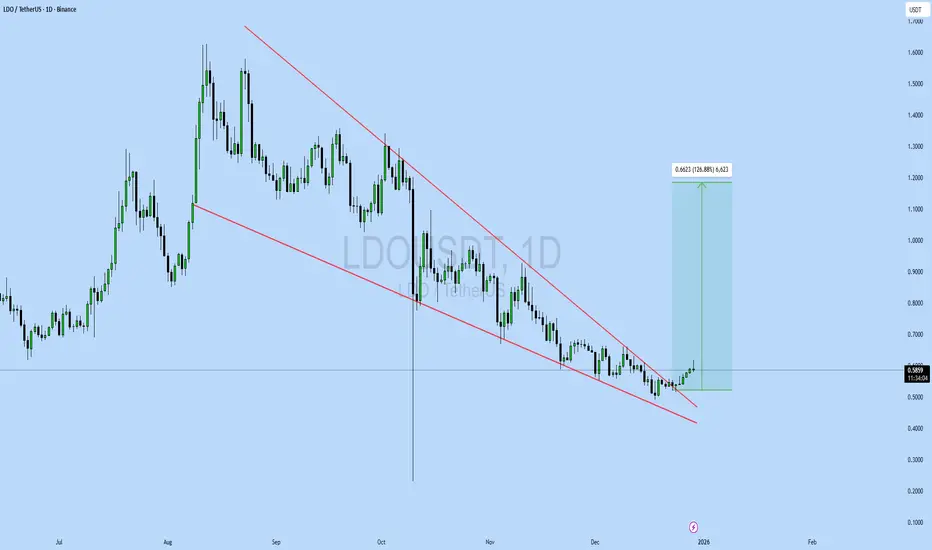
Pattern: Falling Wedge Pattern
Current Price: 0.5833
Target Price: 1.25
Target % Gain: 126.88%
Technical Analysis: LDO is breaking out of a falling wedge pattern on the 1D chart, indicating bullish potential. The price has recently pushed above the wedge suppor
#LDO/USDT — Critical Retest at Demand Zone vs Long-Term Downt#LDO
The price is moving in a descending channel on the 1-hour timeframe. It has reached the lower boundary and is heading towards breaking above it, with a retest of the upper boundary expected.
We have a downtrend on the RSI indicator, which has reached near the lower boundary, and an upward reb
See all ideas
Summarizing what the indicators are suggesting.
Oscillators
Neutral
SellBuy
Strong sellStrong buy
Strong sellSellNeutralBuyStrong buy
Oscillators
Neutral
SellBuy
Strong sellStrong buy
Strong sellSellNeutralBuyStrong buy
Summary
Neutral
SellBuy
Strong sellStrong buy
Strong sellSellNeutralBuyStrong buy
Summary
Neutral
SellBuy
Strong sellStrong buy
Strong sellSellNeutralBuyStrong buy
Summary
Neutral
SellBuy
Strong sellStrong buy
Strong sellSellNeutralBuyStrong buy
Moving Averages
Neutral
SellBuy
Strong sellStrong buy
Strong sellSellNeutralBuyStrong buy
Moving Averages
Neutral
SellBuy
Strong sellStrong buy
Strong sellSellNeutralBuyStrong buy
Displays a symbol's price movements over previous years to identify recurring trends.
Frequently Asked Questions
The current price of LDO / TetherUS (LDO) is 0.3558 USDT — it has fallen −0.94% in the past 24 hours. Try placing this info into the context by checking out what coins are also gaining and losing at the moment and seeing LDO price chart.
LDO / TetherUS price has fallen by −1.54% over the last week, its month performance shows a −42.14% decrease, and as for the last year, LDO / TetherUS has decreased by −80.86%. See more dynamics on LDO price chart.
Keep track of coins' changes with our Crypto Coins Heatmap.
Keep track of coins' changes with our Crypto Coins Heatmap.
LDO / TetherUS (LDO) reached its highest price on Jan 11, 2024 — it amounted to 4.0380 USDT. Find more insights on the LDO price chart.
See the list of crypto gainers and choose what best fits your strategy.
See the list of crypto gainers and choose what best fits your strategy.
LDO / TetherUS (LDO) reached the lowest price of 0.2314 USDT on Oct 10, 2025. View more LDO / TetherUS dynamics on the price chart.
See the list of crypto losers to find unexpected opportunities.
See the list of crypto losers to find unexpected opportunities.
The safest choice when buying LDO is to go to a well-known crypto exchange. Some of the popular names are Binance, Coinbase, Kraken. But you'll have to find a reliable broker and create an account first. You can trade LDO right from TradingView charts — just choose a broker and connect to your account.
Crypto markets are famous for their volatility, so one should study all the available stats before adding crypto assets to their portfolio. Very often it's technical analysis that comes in handy. We prepared technical ratings for LDO / TetherUS (LDO): today its technical analysis shows the sell signal, and according to the 1 week rating LDO shows the sell signal. And you'd better dig deeper and study 1 month rating too — it's sell. Find inspiration in LDO / TetherUS trading ideas and keep track of what's moving crypto markets with our crypto news feed.
LDO / TetherUS (LDO) is just as reliable as any other crypto asset — this corner of the world market is highly volatile. Today, for instance, LDO / TetherUS is estimated as 3.08% volatile. The only thing it means is that you must prepare and examine all available information before making a decision. And if you're not sure about LDO / TetherUS, you can find more inspiration in our curated watchlists.
You can discuss LDO / TetherUS (LDO) with other users in our public chats, Minds or in the comments to Ideas.