LINK has formed a Double Bottom pattern📊 LINK Market Update
LINK has formed a Double Bottom pattern ✅
It broke out of the red resistance zone 🔴 and is now approaching the first target at the blue line level 🎯
If momentum continues, the second target will be the next blue line level 📈
LINKUSDT.3S trade ideas

The LINK/USDT will probably go lower📉 Trend and Structure
The price is currently trading within a descending channel (yellow lines), which has been in place since late August.
The price attempted to break out of the channel at the top around $23.40, but buyers lacked strength – it was rejected at resistance and fell back below the downtrend line.
Currently, the price is just below the upper edge of the channel and below the 50/200 EMA, confirming that the medium-term trend remains downward.
🔹 Key Technical Levels
Support:
$21.40 – local support, which is currently being tested.
$20.80 – strong support from previous price reactions.
$19.68 – lower boundary of the channel, a very important level for bulls.
Resistance:
$22.20–$22.70 – zone of the 50/200 EMA and previous rejections.
USD 23.40 – the last local high and the point of the false breakout.
USD 24.90 and USD 25.50 – key breakout levels from the channel, paving the way to USD 27–28.
⚙️ Technical Indicators
MACD:
The MACD line has crossed the upside signal → sell signal.
The histogram has turned slightly negative, indicating a loss of upward momentum.
RSI (14):
Currently around 51, with a slight downward slope.
Neutral, but with a strong upside – a drop to around 40 is possible before the bulls attempt a rebound.
🧭 Scenarios
🔻 Bearish Scenario (more likely)
If the price remains below $22 and the channel is not broken, a further decline to $20.80 is possible, or even a test of the lower band of the channel at $19.70.
Confirmation will be a close of the 4-hour candle below $21.40.
🔺 Bullish Scenario (less likely at this time)
If the bulls reclaim $22.70–$23.00 and close the 4-hour candle above it, a breakout from the channel could occur.
The targets will then be $23.40, $24.90, and $25.50, respectively.
Increased volume and confirmation on the MACD (bullish cross) are required.

LINE CHART Sometimes the best way to draw zones and trendlines is to use the line chart because it gives clear pionts
Watch how the zones and trendlines match
You can also draw your zones on your chartthen switch to line chart 💯

LINKUSDT lose that zone and we see a dropIf LINKUSDT loses that zone we'll see a short drop from that level
I'll keep my eyes on it
Entry only if we lose that zone
#linkusdt

LINKUSD – Bullish Impulse Toward D-Point Target
LINKUSDT:
Title: LINKUSD – Bullish Impulse Toward D-Point Target
Price action has completed a corrective ABC structure, finding strong support at point C. The current breakout above mid-structure resistance confirms bullish momentum, aiming toward the D-point completion. Risk is managed below the breakout zone, with potential for trend continuation if price sustains above local support.
Risk Management Notes:
– Entry aligned with breakout confirmation
– Stop-loss below structural support (C-area)
– Take-profit near projected D-point completion

LINK Daily: Short-Term Rejection, Long-Term StrengthLINK Daily – Watching the Retrace
LINK on the daily just got rejected from the 50MA, confirming it as short-term resistance.
The next key support sits around the 0.618 Fibonacci level, which also marks the origin of the last bounce that was rejected at the 50MA.
From a system perspective, the current structure reads:
Price < BB Center (orange) < SMA < MLR10 — indicating a short-term downtrend.
However, on the long-term view, price remains above the 200MA, meaning the broader uptrend is still intact.
At this stage, LINK needs a daily close above the BB Center to regain short-term momentum and open the path for recovery.
With Q4 underway and the narrative in the US shifting in favor of crypto, LINK could soon find conditions for continuation once the local structure stabilizes.
Bias:
Neutral-bullish: short-term pressure within a long-term bullish structure.
Always take profits and manage risk.
Interaction is welcome.

CHAINLINK October Trade PlanWe're approaching what could possibly be the last 2-4 weeks of the 4y cycle (October 17th - derived as 546 days from Halving to Top in prior two cycles). This time might be different, but this trade plan assumes the timing remains valid - until proven otherwise.
Throughout this cycle LINK has been responsive to HTF rejections from 3W order blocks and the 0.786 / 0.705 Fib Area (in March'24, and December '24), as shown.
When we extend a connecting trend line between these two pico tops, there is confluence with another 3W order block, the 0.705 / 0.786 area again AND our suggested cycle top date. This gives a Price Target and potential Short entry from $38-$42.
In the immediate short term, on the Long side, I'm looking for price to reach an 18H HOB at around $19.11 / 0.705 Fib, at the lower end of MTF channel trend support. There is an additional high probability support area (2D OB) at $17.91 for a potential lower entry.
Summary:
LONG from $19.11 (add at $17.91), Targets above $38
SHORT (Hedge or Isolated) from $38.77, Targets below $16

LINK USDTLink Currency Analysis
We are now in wave 3 and you can make good profits until the end of the period
No analysis is 100%

LINK Update📊 LINK Update
LINK has formed a bullish double bottom pattern and successfully reached the first target ✅
Now we’re waiting for the second target at the green line level 🚀


LINK LONG 4HR lows taken out ,
Anticipating a reversal to reclaim support and trade higher ,
stop:21.7
entry :22.00
targets :3 tps as shown in chart

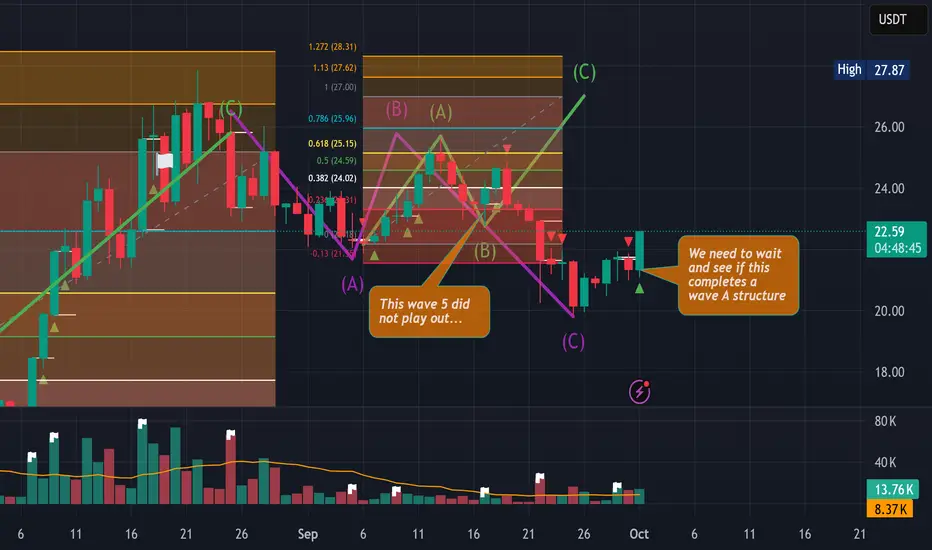
Watching for wave A structure on LinkOur target of $27 did not play out as I thought with an extended wave 5. I think too much hype and too many leveraged long positions caused a breakdown in the play but we look good if we stay moving in the next few days to see a move to the upside with the same target likely.
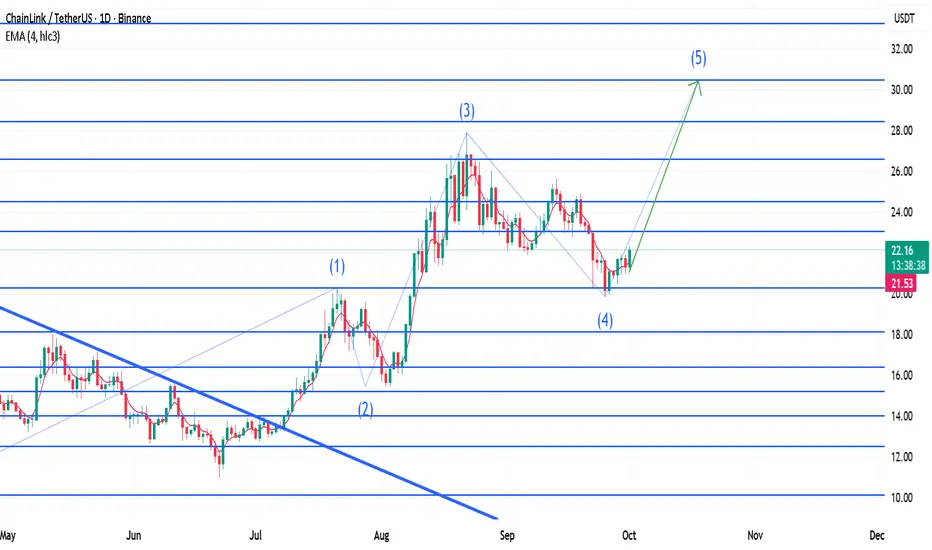
Chainlink 5th wave target 30,4$ then crashIN my view chainlink is drawing last 5th wave of the bulilsh cycle targeting 30,4$ where I expect bearish inversione and the beginning of the bear cycle
CHAINLINK (LINKUSDT) IN AFAVOURABLE ZONE TO BUYThe project Chain link is in the favorable zone to make entries but since the ALTs season has not yet started so build the positions gradually. The CMP is the FIB level 0.618 which is a good level for DCA as well.
So build your entries and wait for the ALT season to ride .......
What are your views on this ??????

LINK
📊 **Setup LINK/USDT (15m)**
🟢 **Entry Zone (Demand QML):**
≈ 21.043 – 21.048
🔻 **Stop Loss (SL):**
20.777
🎯 **Take Profit (TP):**
* TP1 👉 21.263
* TP2 👉 21.545
* TP Max 🚀👉 21.879

LINK analysis : What is next ? MORE DUMP OR ...... ?There are two scenarios that could play out.
bottom is almost in. A pump toward 30 and above is the next major move. in short term tho, LINK can either go up from 20 level or grab liquidity at 18 level and then go up.
overall, the bottom is almost in and look for spot buys at 18-21 area.

LINK/USDT - Ready for Takeoff? Major Bullish Reversal in Play!🚀 Trade Setup Details:
🕯 #LINK/USDT 🔼 Buy | Long 🔼
⌛️ TimeFrame: 1D
--------------------
🛡 Risk Management (Example):
🛡 Based on $10,000 Balance
🛡 Loss-Limit: 1% (Conservative)
🛡 The Signal Margin: $534.47
--------------------
☄️ En1: 20.74 (Amount: $53.45)
☄️ En2: 19.34 (Amount: $187.06)
☄️ En3: 18.4 (Amount: $240.51)
☄️ En4: 17.51 (Amount: $53.45)
--------------------
☄️ If All Entries Are Activated, Then:
☄️ Average.En: 18.87 ($534.47)
--------------------
☑️ TP1: 24.56 (+30.15%) (RR:1.61)
☑️ TP2: 27.87 (+47.69%) (RR:2.55)
☑️ TP3: 32.73 (+73.45%) (RR:3.93)
☑️ TP4: 40.16 (+112.82%) (RR:6.03)
☑️ TP5: 50.34 (+166.77%) (RR:8.91)
☑️ TP6: Open 🔝
--------------------
❌ SL: 15.34 (-18.71%) (-$100)
--------------------
💯 Maximum.Lev: 3X
⌛️ Trading Type: Swing Trading
‼️ Signal Risk: 🙂 Low-Risk! 🙂
🔎 Technical Analysis Breakdown:
This technical analysis is based on Price Action and Smart Money Concepts. All entry points, Target Points, and the Stop Loss are calculated using professional mathematical calculations. As a result, you can have an optimal trade setup based on great risk management.
Technically, LINK is bouncing off key support levels and forming a solid accumulation structure, suggesting strong hands are preparing for a breakout. With multiple confluences aligning — including long-term trend support and bullish divergence — this setup favors patient swing entries with impressive risk-to-reward potential.
📊 Sentiment & Market Context:
Chainlink (LINK) is showing signs of renewed bullish strength following a consolidation phase and broader market resilience. The crypto market has recently seen improved sentiment amid increasing institutional involvement and growing anticipation around real-world asset tokenization — a core use case for Chainlink's oracle solutions.
🔎 About LINK:
Chainlink is a decentralized oracle network that enables smart contracts to securely interact with real-world data. It plays a critical role in DeFi, insurance, gaming, and more — bridging on-chain and off-chain systems. As adoption of decentralized infrastructure grows, LINK continues to position itself as a key infrastructure asset in the blockchain ecosystem
⚠️ Disclaimer:
Trading involves significant risk, and past performance does not guarantee future results. This analysis is for informational purposes only and should not be considered financial advice. Always conduct your research and trade responsibly.
💡 Stay Updated:
Like this technical analysis? Follow me for more in-depth insights, technical setups, and market updates. Let's trade smarter together!

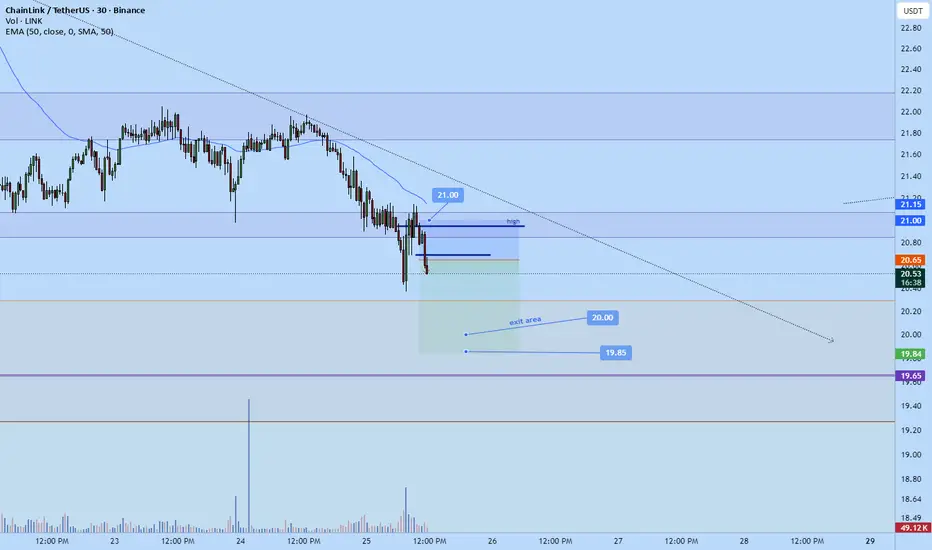
chainLink scalp short sub $20Just went short on chainlink
sl: 21
Tp: 19.85
Potential early close at $20
Roughly 2 RR trade
LINK MOON?LINK is showing Bullish Divergence making higher lows and lower low on Rsi , it is safe to long from here

LINK/USDT Weekly FVG Tap
BINANCE:LINKUSDT has arrived right at a strong level that I see as a solid opportunity to enter.
This zone, together with the lower DCA area I highlighted as backup, looks like a prime region to build a spot position on LINK.
I’ll share another update if needed.

Chainlink (LINK): Successful Re-Test Near 100EMA | BullishChainlink has retested the 100 EMA together with the broken resistance, which has now turned into support. Price reacted well from that zone, keeping the bullish structure intact. As long as buyers continue to defend this area, we look for continuation towards the marked target above.
Swallow Academy

LINKUSDTLast week BINANCE:LINKUSDT , after touching 24.80 dollars 🚀, the price failed to hold and moved into correction. The overall structure still shows a range between key support and resistance, with compression signaling the potential start of the next trend. Currently, momentum leans slightly bearish 📉, but the market has not yet confirmed a clear direction.
Key Levels:
Initial support: 23.18 dollars 🛡️
Next supports: 22.50 dollars – 21.60 dollars
Nearby resistance: 24.40 dollars
Higher resistances: 25.20 dollars – 26.50 to 27.50 dollars 🎯
