$LINK – PREMIUM PUMP, DISCOUNT DUMP? THE SQUEEZE SETUP EXPLAINEDLINK – PREMIUM PUMP, DISCOUNT DUMP? THE SQUEEZE SETUP EXPLAINED
Traders,
LINK — and likely the broader crypto market — is setting up for a premium squeeze that turns into a discount dump.
ANALYSIS
On Binance Perpetuals you can see longs piling in near $24 while price stalls → CVD pushes up, price doesn’t. That’s buying with no progress = bearish absorption with CVD non-confirmation. Check the data here ibb.co
Aggregated Spot CVD (all exchanges) is flat. No real spot demand → only leveraged longs propping up price. Check the data here ibb.co
Price is now inside the Golden Pocket retracement zone. High-probability reaction area where strong hands fade late longers.
Measuring swing low → swing high (06 Sep – 13 Sep), price is right at the Value Area High (VAH). This is the edge of acceptance.
Confluence: we’re also tagging the upper Anchored VWAP band (green line) from both the swing high and the swing low.
→ Why this matters: Anchored VWAP tracks the average cost basis of participants from a chosen pivot. When the swing low → high AVWAP band and the swing high → low AVWAP band overlap in the same zone, it creates double confluence: longs from the bottom see this as “expensive” and reduce risk, while shorts from the top defend their break-even. Historically, these overlaps act as strong rejection zones unless fresh spot demand breaks through.
MY TAKE
Expecting rejection at $24 and a move back toward $21 (blue AVWAP test). I think - based on data - that we might move even lower.
Setup = trapped longs at premium + no spot demand + strong confluence of VAH, Golden Pocket, and dual AVWAP resistance.
Invalidation = acceptance above $25 with spot CVD joining the move.
LINKUSDT.3S trade ideas

LINK (Chainlink) – Triangle Pattern Breakout Loading?#LINK is currently consolidating within a triangle pattern on the 4H timeframe. No bearish signals are visible for now, but volume remains low — indicating traders are waiting for a decisive move.
Key Points:
Triangle pattern forming on 4H chart
No bearish structure yet
Low volume = patience needed
Breakout above resistance with strong volume = bullish confirmation
Best setup: Enter long on retest with proper risk management
Plan the trade, trade the plan. A clean breakout with strong momentum could bring exciting upside opportunities.
What’s your outlook on #LINK? Do you expect a bullish breakout, or will bears surprise us? Drop your thoughts
#LINK #Chainlink #Crypto #Altcoins #Breakout #TrianglePattern #TradingView #CryptoTrading #PriceAction #CryptoCharts
LINK LONG AND SHORT IDEAHi guys . i have this setup for BINANCE:LINKUSDT a double position . a long to upper FVG then short from there . in both case my SL above and blow major pivots.

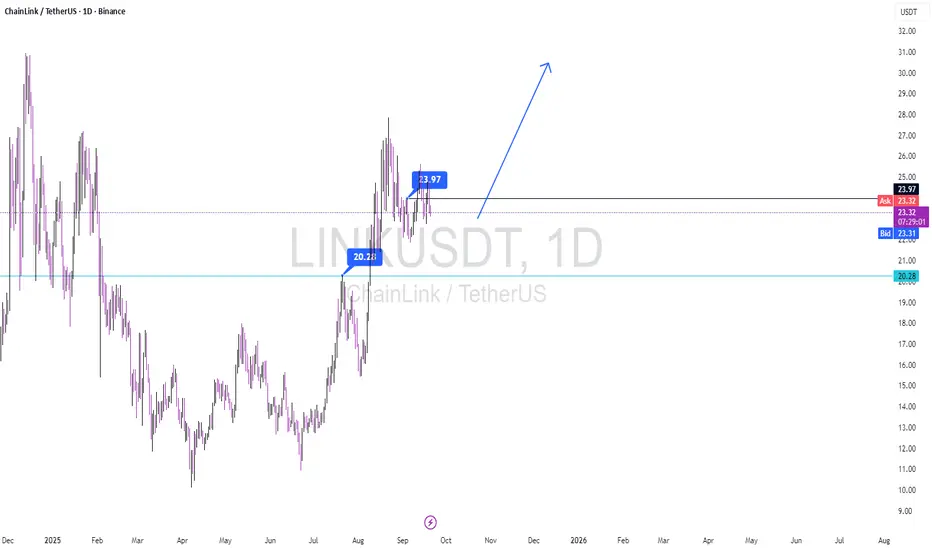
Professional Analysis: LINK/USDT (Daily Timeframe)Current Setup: LINK has successfully breached and held above the key support level of $20.28, demonstrating bullish momentum. The price action is currently consolidating in what appears to be a Bull Flag pattern, suggesting a potential continuation of the prior upward move.
Trigger & Confirmation: A decisive daily close above the pattern's resistance at $23.97 will serve as the primary buy signal according to my strategy. I am awaiting confirmation from a secondary indicator before considering this trigger fully validated.
Projection: Upon a confirmed breakout, LINK possesses a clear trajectory to target higher resistance levels on the daily chart.
Risk Management: A strict stop-loss is essential for this setup. Any move resulting in a daily close back below $20.28 would invalidate the bullish structure and signal an exit.
I will issue a formal ' SPECIAL SIGNAL ' alert once all confirmation criteria are met and the trade is officially live.
Trade Safe,
S.Reza Mehrjuyan / CEO FNS
Analyst, Manager
LINK/USDTI have a strange interest in marking up charts. I find it relaxing/soothing. I enjoy the design/art of it. Here is LINK/USDT for no real reason.

LINKUSDT 12H#LINK is moving inside a descending channel on the 12H timeframe. If it bounces from the middle line of the channel, which is aligned with the 12H SMA100, we can expect a move toward the channel resistance. In case of a breakout above the channel, the potential targets are:
🎯 $26.39
🎯 $27.79
🎯 $29.19
🎯 $31.18
⚠️ Always remember to use a tight stop-loss and follow proper risk management.

$LINK on the 4-HR chart = falling WEDGE breakout intactLet's zoom in on that CRYPTOCAP:LINK on the 4-HOUR chart as the DAILY with the pennant is looking incredibly interesting.
Here we have already had a falling wedge breakout underway and targetting $28 for starters, and we also had a BULLISH OBV divergence followed by a BULLISH RSI divergence so this is looking pretty well here.
Not right now but if this is bouncing here then thats a higher low, so we would need a higher high on good volume, above $25.5 - $26.5 (or scale in with triggers spread in this zone).
This is a journal only remember, not advice👽💙

$LINK with a BULLISH PENNANT well formed now on 1-DCRYPTOCAP:LINK has been trading inside of that BULLISH pennant pattern I highlighted yesterday, and my BAT harmonic pattern spotted on the WEEKLY has been playing out well so far.
In terms of Elliot's Wave count we have likely completed WAVE 4 and starting the WAVE 5 once we break out from the pennant.
Some bullish OBV divergences were popping up recently so this is worth watching for a breakout, details in this quoted post below💙👽

Chainlink long to $25.25 areaJust setup a limit order to long chainlink at $24.57
Sl: 24.23
Scale out tps on chart.
Anticipating a bullish push soon
Time sensitive

LINK / USDT : Showing strong momentum LINK/USDT is showing strong momentum and preparing to break out of a symmetrical triangle.
📌 Entry: $23.60 – $24.38
🎯 Targets: $26 – $28 – $30
⛔ Stop Loss: $22.30
Always manage risk properly and DYOR ✅

TradersCity Pro | LINK Eyes Fresh Rally From Critical Support👋 Welcome to TradeCity Pro!
In this analysis, I’m going to review LINK, one of the RWA coins with a market cap of $16.41 billion, currently ranked 12th.
📅 Daily Timeframe
On the daily chart, after getting support around 11.55, LINK started an upward move and in its first wave rallied up to 26.73.
✔️ After reaching this zone, volume began to decline and a short correction formed down to the 0.236 Fibonacci level.
⭐ This area is also an important support zone that overlaps with a PRZ (Potential Reversal Zone) at the Fibonacci level, meaning the price could start its next bullish wave if it holds this floor.
🔍 If a deeper correction occurs, price could extend down to the 0.382 or 0.5 Fibonacci levels. Naturally, the deeper the correction, the weaker buyers’ strength becomes.
🎲 For long positions, if the price holds these key zones or breaks above 26.73, we can look for entries. The main confirmation of a bullish continuation will be a clean breakout of 26.73.
📝 Final Thoughts
Stay calm, trade wisely, and let's capture the market's best opportunities!
This analysis reflects our opinions and is not financial advice.
Share your thoughts in the comments, and don’t forget to share this analysis with your friends! ❤️


LINK/USDT - Bearish Flag PatternBINANCE:LINKUSDT LINK/USDT - Looking for strong bearish, Bearish Flag Pattern Formation
Fundamental Updates :
SEC listing rules to boost crypto ETFs, but no guarantee of inflows: Bitwise
The US Securities and Exchange Commission streamlining the approval process for crypto exchange-traded products (ETPs) may trigger a surge of new offerings, but that doesn’t guarantee their success, a crypto executive warns.
Support by Likes and Comments.
Thank you.

linkusdt, LINK/USDT is showing signs of potential bullish reversal after a corrective downtrend. Price action has been respecting a descending trendline, but we are now seeing a breakout attempt with strong buying interest around the $23.15 support zone.


Scalp Setup — LINKUSDTHeads-up traders: LINK will likely steal stops 22.4–22.9. Let it. We act only after the grab + structure break. Calm hands get paid.
🔴 Scalp Setup — LINKUSDT
1) HTF/MTF Bias (12H/4H)
• Price ≈ 23.85.
• Trend: Uptrend; first clean pullback after a vertical leg, ranging 23.0–25.0.
• Sweep targets: below 23.00 → 22.80 / 22.60; above 24.30–24.60.
2) LTF Execution (15m)
• Confirmation: CHoCH/BOS up (change of character / break of structure) right after a sub-23 sweep — close beyond prior 15m lower high.
• OB/FVG: Enter on 50–100% fill of the FVG/OB created by the BOS leg; prefer OB body or 0.50–0.618 fib of the impulse.
• Liquidity: below 22.95 / 22.80 / 22.60, above 23.40 / 23.70 / 24.00.
• Volume/Delta: Sweep candle ≥ 1.5× 20-bar average or clear delta absorption in the 22s.
3) Derivatives
• OI: Stable-high; slight rises on dips.
• Funding: Near flat (no crowding).
• CVD: Attempting a higher low after a week-long drift.
• Resting liqs: 22.8 and 23.6–23.8.
4) Trade Map
• Bias: Long after downside sweep → BOS up.
• Sweep Zone: 22.4–22.9.
• Entry: 22.75–22.90 limit (refine to OB body / FVG 50–100% fill).
• Stop: 22.55 (beyond sweep wick / opposite OB edge by ~0.15× ATR-15m).
• TPs: 23.40, 23.70, 24.00 (opt).
• RR: From 22.82 mid-fill → TP1 ≈ 2.1:1, TP2 ≈ 3.3:1, TP3 ≈ 4.4:1.
• Trust Meter: A+ (88%).
👉 LINKUSDT = Scalp A.
Rotation
• Sector: Oracles (LINK).
• Narrative: Trend pullback with calm derivatives; watch sweep → reclaim → continuation.
⚔️ Candle Craft | Signal. Structure. Execution.

LINK - BULLISH Im buying some CRYPTOCAP:LINK here on this green zone 📈
Weekly uptrend & daily retest; price might start to tank again! 📈
Remember my medium term outlook: 29.50 - 30.00$ = magnet resistance weekly.
Lower key demand zone: 22.30 - 21.50 - 20.60 - 19.00$

LINK/USDTPrice has rejected from the bearish supply zone (2) and expanded lower into demand (3). We now see a reaction (4) inside daily demand (DLY), forming a potential reversal base. For continuation higher, price must hold above demand and clear the nearest bearish OB. Failure to do so risks another sweep into deeper liquidity (5).
I'm waiting for another leg (5) and SWEEP. If it runs before that - so be it. I have to stay rules based.

LINK - Swing Long OpportunityLINK - Swing Long Opportunity
📊 Market Sentiment
Market sentiment remains strongly bullish as the FED is expected to deliver a 0.25% rate cut, with speculation building for a possible 0.5% cut in September. Monetary policy shifts are being driven by both inflation trends and weakening labor market data. The latest August and September job reports were soft, signaling that the economy is cooling rapidly. This environment continues to fuel expectations for a major bullish run in the weeks ahead.
📈 Technical Analysis
Price is bullish on the HTF, so I will only be interested in long setups.
Price recently broke and closed above the bearish trendline, confirming bullish continuation.
We also saw a break and close above the HTF Key Level, which should now act as support.
Moreover, the 0.5 Fibonacci retracement level aligns perfectly with the HTF Key Level, creating strong confluence for a potential entry.
📌 Game Plan
I will be entering long positions at the 0.5 Fibonacci retracement / HTF Key Level intersection.
🎯 Setup Trigger
Confirmed 15M break of structure before entry.
📋 Trade Management
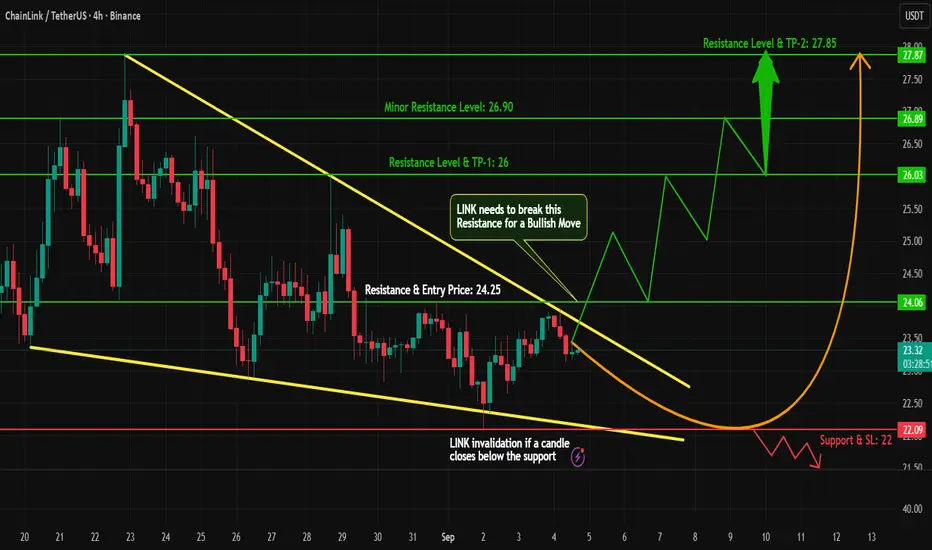
Stoploss: Daily close below the HTF Key Level or hard stop at $22.64
Targets:
• TP1: $26.03
• TP2: $26.63
• TP3: $27.85
💬 Like, follow, and comment if you find this setup valuable!
⚠️ Disclaimer: This content is for informational and educational purposes only and does not constitute financial, investment, or trading advice. Always do your own research before making any financial decisions.

Link Long Yep, simple as that.
Long link from the identified area and target the liquidity above ⬆️.
Looks solid setup. Just stick to SL regardless of the outcome.
If SL hit, then my analysis was wrong and we can buy cheaper.
Confidence in this trade is 7 out of 10.

