Fundamental & Technical Report – LINK/USDT📊 Fundamental & Technical Report – LINK/USDT
🔹 Fundamental Overview
Chainlink (LINK) remains one of the leading decentralized oracle networks, providing off-chain data to smart contracts. Its adoption continues to grow across DeFi, staking, and institutional blockchain projects. Recent momentum in the broader crypto market, alongside increased usage of Chainlink’s CCIP (Cross-Chain Interoperability Protocol), has boosted investor confidence. Market sentiment around LINK is neutral-to-bullish, supported by strong community activity and continuous integrations with major DeFi protocols.
🔹 Technical Outlook
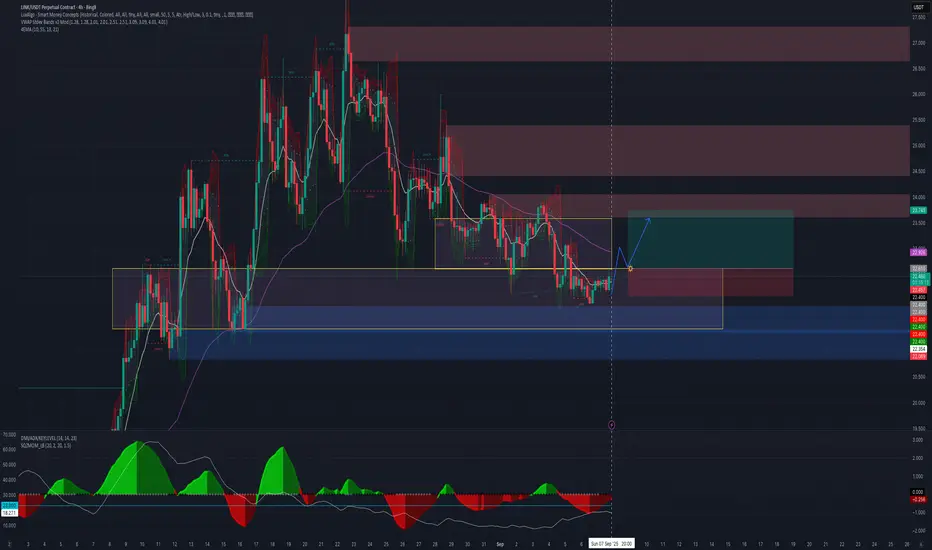
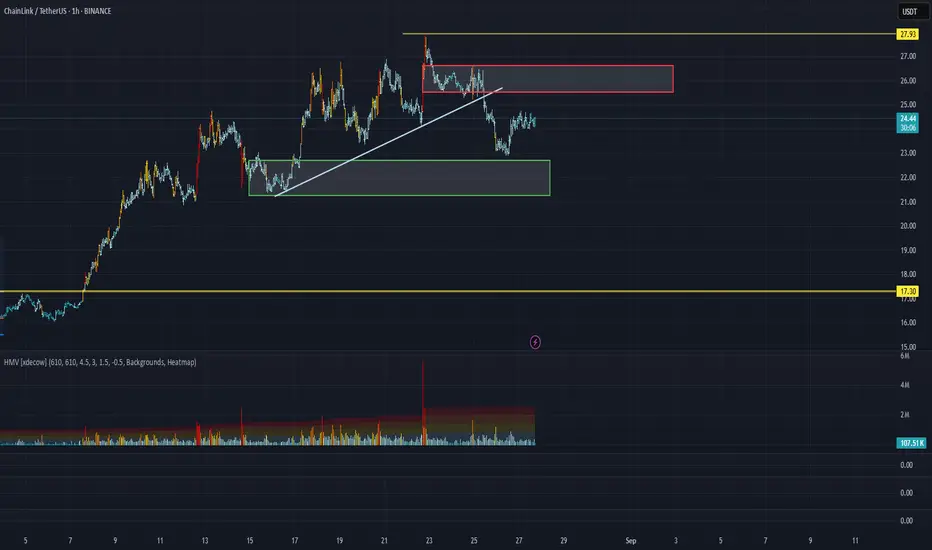
From a technical perspective, LINK has recently broken free from a prolonged downward channel, signaling a shift in market sentiment. The breakout was accompanied by rising volume, reflecting renewed accumulation interest from larger market participants.
After the initial rally, price action has entered a consolidation phase, characterized by reduced volatility and sideways movement. This type of structure often suggests the market is preparing for its next impulsive leg, with traders waiting for confirmation in momentum direction.
Market profile data indicates that institutional players have been actively positioning in the mid-range zone, suggesting confidence in LINK’s medium-term outlook. Current price behavior shows signs of healthy market rotation—short-term cooling off after an impulsive rally, which is a common technical pattern before trend continuation.
LINKUSDT.5S trade ideas

LINKUSDT SellLINKUSDT just broke my bullish counter trendline, also, I don't how long the sell is going to last so fingers crossed. Hopefully it hits the TP and then it can fly to where it likes.

Link short back to $22 todayOpened a short on link a while ago
Market is currently a daily LH structure point area and I don't think the trend is ready to flip back bullish yet on the daily as we're still relatively high when viewed from the weekly tf. Expecting deeper correction
Sl: 23.7
tp: $22

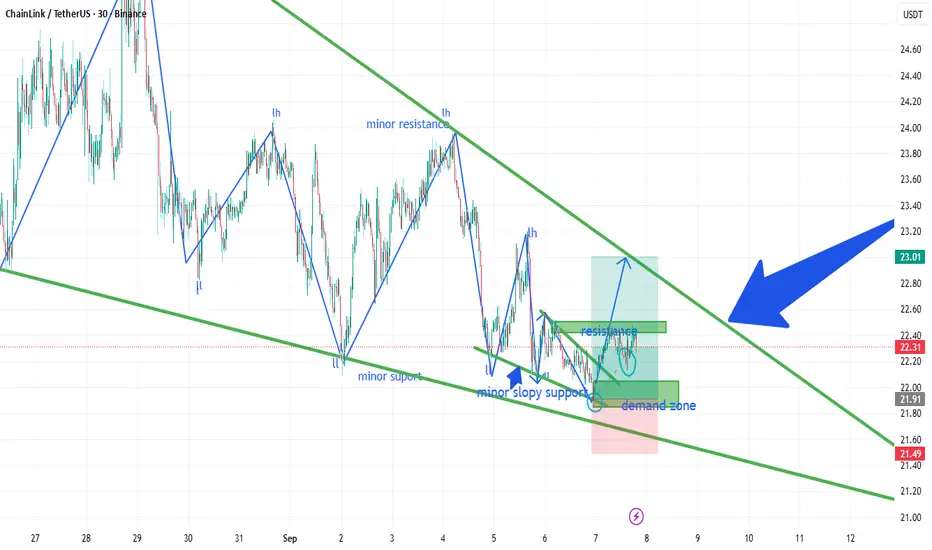
LINK/USDT: Daily Breakout to 50?BINANCE:LINKUSDT is gearing up for a bullish breakout on the daily chart , with an entry zone in the red box between 15-20 near a critical support and consolidation zone.
The target range of 38-50 aligns with the next major resistance, signaling strong upside potential. Set a stop loss at 15 on a daily close below to manage risk effectively.
A break above 22 with solid volume could ignite this move, driven by network upgrades and altcoin momentum. Watch market trends! 💡
📝 Trade Plan:
✅ Entry Zone: 15 – 20 (red support & consolidation box)
❌ Stop Loss: Daily close below 15 to manage risk
🎯 Target Zone: 38 – 50 (next major resistance area)
NOTE: This set up is only for spot trading .
Ready for this lift-off? Drop your take below! 👇

Chainlink Rising "Mid-Air" · Long-Term Support FoundThis is perfect. Here we can see Chainlink growing in "mid-air." Can that be said?
"Mid-air" because the rise keeps on happening and the retrace finds support where there is no support; that is, LINKUSDT continues to grow straight up. This is as good as it gets.
We had only five days red and LINK turns green again. This doesn't change anything on the smaller or bigger picture, market dynamics remain the same.
If this day is red, the next day red and another 3, 5, 9 days red; it doesn't matter, we are in a bullish wave.
If this day is green, the next day green, then red, then green and so on; it doesn't matter, you are looking at market noise.
The noise will continue and at times it will even intensify. Volatility will also increase as prices continue to increase. Trading complexity will be up. Risk will be higher but, right now, it is still early because Chainlink can easily hit $100+. Knowing this, I buy and hold.
Namaste.

LINK/USDT FVG reversal with a test prior lowThe plan here is simple: look for price to retrace into the nearest FVG and show rejection, then target back down toward yesterday’s low as the liquidity objective. All the best.

what I will do with link “Waiting for a range breakout and reversal at 22.61 to target 23.74 for a 5% move, stop at 22.07, 2:1 ratio.”
LINK/USDT - SHORTI expect this decision to be implemented in about a month or two.
(This is not an investment recommendation).

Chainlink (LINK): Looking For Proper MSB (market structure breakChainlink struggled to break the local 200EMA line, where the price is hovering between the support area at $12.83 and the 200EMA line.
Nevertheless, we are still seeing the demand for breakout so we are expecting to see some sort of buyside movement with proper MSB, which would back our trade idea.
Swallow Academy

LINK: Forming "Three-Drive to a Bottom"Will the price action complete the classic Larry Pesavento's "Three Drives to A Bottom"? - Anyyway, a good entry point for a long should be somewhere between now and 21.550
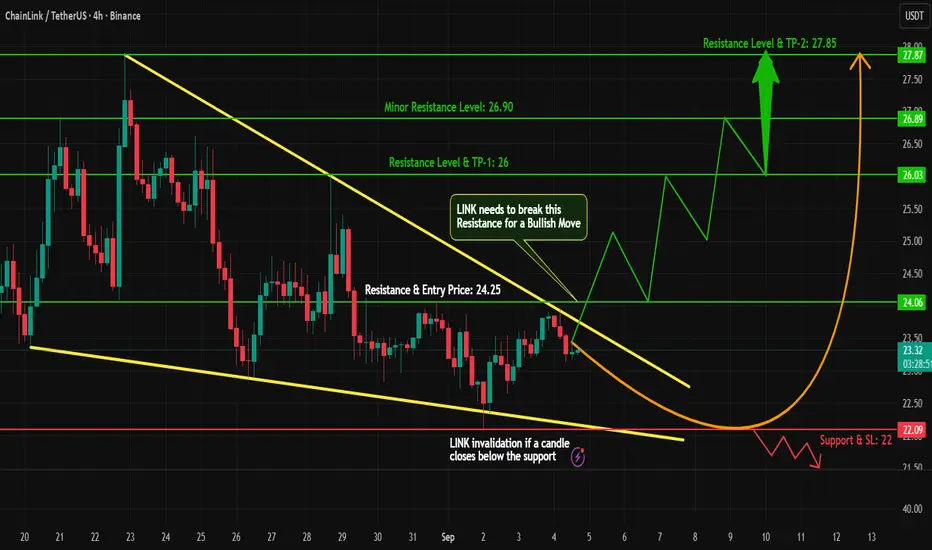
Chainlink 4H Update | LINK Testing $23.50My bias is still more upside mid-term. On the 4-hour chart, if LINK reclaims 23.50, the path opens toward 24.83 and 26.71. If it fails and drops below 22.78, the next supports are 21.92 and 21.62. The immediate battle is all about whether buyers can flip 23.50 back in their favor.

LINK (Chainlink) – Triangle Pattern Breakout Loading?#LINK is currently consolidating within a triangle pattern on the 4H timeframe. No bearish signals are visible for now, but volume remains low — indicating traders are waiting for a decisive move.
Key Points:
Triangle pattern forming on 4H chart
No bearish structure yet
Low volume = patience needed
Breakout above resistance with strong volume = bullish confirmation
Best setup: Enter long on retest with proper risk management
Plan the trade, trade the plan. A clean breakout with strong momentum could bring exciting upside opportunities.
What’s your outlook on #LINK? Do you expect a bullish breakout, or will bears surprise us? Drop your thoughts
#LINK #Chainlink #Crypto #Altcoins #Breakout #TrianglePattern #TradingView #CryptoTrading #PriceAction #CryptoCharts
LINK — Range Games at 22–25: Who Blinks First?Chainlink is pacing its cage between 22 and 25, tail swishing, waiting for the zookeeper (aka liquidity) to open the gate. The 12H structure is still intact, but the pullback keeps everyone guessing.
Structure (12H)
• Price ~23, consolidating inside 22–25 range.
• Trend intact unless 21.5 cracks.
Orderflow + Derivatives
• OI stable → no fireworks.
• Funding neutral → crowd balanced.
• CVD soft → sellers nudging.
Scalp Scenarios
• Short Idea (Grade A–): Fade rejection 24.8–25.3 supply. First stop 23.5, then 22.5.
• Long Idea (Grade B): Sweep 21.5–22, reclaim 22.2, ride to 23.5 → 24.5.
Conclusion
The range is tight, the edges are clear — it’s classic LINK behavior: pretend to nap in the middle, then pounce on whichever side leaves liquidity exposed.
🐺 Trade safe, stay sharp, and remember: the market hunts sheep, not wolves.

Scalp Setup — LINKUSDTHeads-up traders: LINK will likely steal stops 22.4–22.9. Let it. We act only after the grab + structure break. Calm hands get paid.
🔴 Scalp Setup — LINKUSDT
1) HTF/MTF Bias (12H/4H)
• Price ≈ 23.85.
• Trend: Uptrend; first clean pullback after a vertical leg, ranging 23.0–25.0.
• Sweep targets: below 23.00 → 22.80 / 22.60; above 24.30–24.60.
2) LTF Execution (15m)
• Confirmation: CHoCH/BOS up (change of character / break of structure) right after a sub-23 sweep — close beyond prior 15m lower high.
• OB/FVG: Enter on 50–100% fill of the FVG/OB created by the BOS leg; prefer OB body or 0.50–0.618 fib of the impulse.
• Liquidity: below 22.95 / 22.80 / 22.60, above 23.40 / 23.70 / 24.00.
• Volume/Delta: Sweep candle ≥ 1.5× 20-bar average or clear delta absorption in the 22s.
3) Derivatives
• OI: Stable-high; slight rises on dips.
• Funding: Near flat (no crowding).
• CVD: Attempting a higher low after a week-long drift.
• Resting liqs: 22.8 and 23.6–23.8.
4) Trade Map
• Bias: Long after downside sweep → BOS up.
• Sweep Zone: 22.4–22.9.
• Entry: 22.75–22.90 limit (refine to OB body / FVG 50–100% fill).
• Stop: 22.55 (beyond sweep wick / opposite OB edge by ~0.15× ATR-15m).
• TPs: 23.40, 23.70, 24.00 (opt).
• RR: From 22.82 mid-fill → TP1 ≈ 2.1:1, TP2 ≈ 3.3:1, TP3 ≈ 4.4:1.
• Trust Meter: A+ (88%).
👉 LINKUSDT = Scalp A.
Rotation
• Sector: Oracles (LINK).
• Narrative: Trend pullback with calm derivatives; watch sweep → reclaim → continuation.
⚔️ Candle Craft | Signal. Structure. Execution.

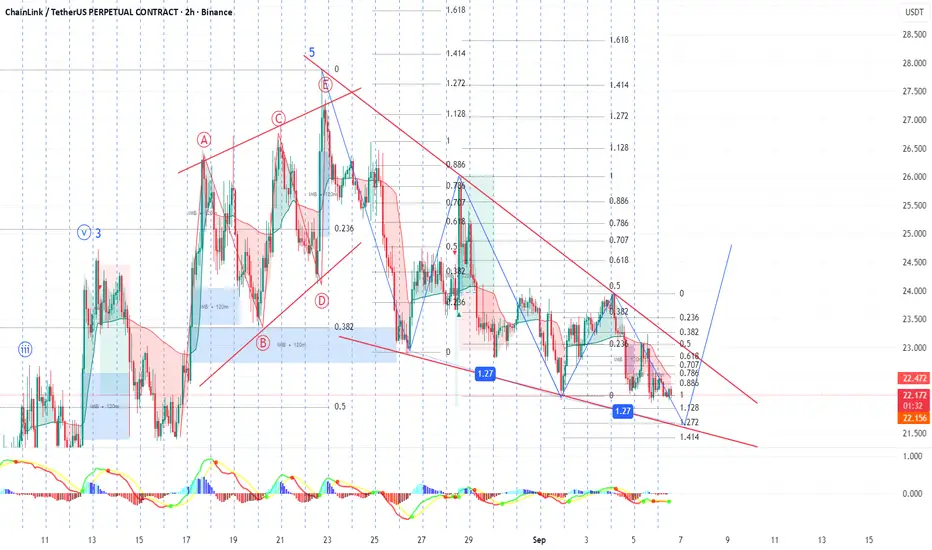
Chainlink bear trend ends next weekIn my view current bearish move represents wave #4 of a 1-2-3-4-5 pattern.
Wave #4 could end next week in 19.8 area then last bullish wave could start to targt 30.4$ to cmplete the bullish cycle

LINK 4H – Supply Rejection Into DemandLINK is consolidating between supply and demand zones, with liquidity pools sitting just above and below. Price has rejected the upper supply zone near 26.50 and is now testing the demand zone around 23.50.
Upside path: If buyers defend demand, a bounce could target liquidity at 26.81 above supply.
Downside path: Failure to hold 23.50 risks continuation toward liquidity at 22.91.
This setup is boxed in between clean levels, making liquidity grabs on either side the next likely driver of direction.

LinkusdtAfter a strong rally from the early August lows near $13.50, Chainlink has managed to establish a higher low structure and is currently consolidating around the $24–25 zone.
We can observe a clear uptrend forming since mid-August, with buyers consistently stepping in on dips. However, price action in the last few days shows some exhaustion near the $26–27 resistance zone, where supply has been strong.
At the moment, LINK is holding above $24, which is a key short-term support. A clean breakout above $26.50–27 could trigger further momentum toward the $30 psychological level. On the downside, losing $22.80–23 would likely invite more selling pressure, with the next support resting near $20.
📌 Key Levels to Watch
Support: $23 – $20
Resistance: $26.50 – $30
Overall, the bias remains bullish as long as LINK holds above $22.80, but traders should stay cautious of potential volatility near

link Bullish IdeaHigh probability trade setup for link price rallied strongly from wave 2 now i'm looking for wave 4 pullback
entry Sl and tp are mentioned in chart
Note: this is not a financial advice in sort

LINK/USDT Analysis. Short Setup
This asset has made a trend break to the downside. A strong volume zone has formed above the current price. If the price tests the $25.5–$26.6 range and shows a reaction, we consider short entries.
LINK LONG1D Technical Analysis for CRYPTOCAP:LINK Surrounding Supply Zone and 4H Demand Confirmation
On the daily chart, CRYPTOCAP:LINK is currently testing a key supply zone around $25 to $26, where sellers have historically stepped in to limit upside price moves. This zone acts as a significant overhead resistance level, creating a challenge for bulls to maintain momentum beyond it.
Recently, CRYPTOCAP:LINK price action confirmed strong buying interest after tapping the 4-hour demand zone, indicated by back-to-back bullish 4H candles. This demand zone provided a critical short-term floor that has supported a bounce and recovery wave.
The confirmation at the 4H demand zone adds confidence to bulls' attempts to push through the nearby daily supply zone, suggesting a growing battle of power between buyers reclaiming control and sellers defending the resistance.
Momentum indicators on the daily timeframe show positive signs: the RSI hovers above neutral 50, Bollinger Bands contract signaling potential volatility expansion, and moving averages are aligned bullishly with a recent golden cross event.
Volume surges during recent rebounds further validate the buying strength that emerged after the 4H demand was respected, hinting at possible continuation toward the next resistance targets near $27–$30 if bulls sustain above supply.

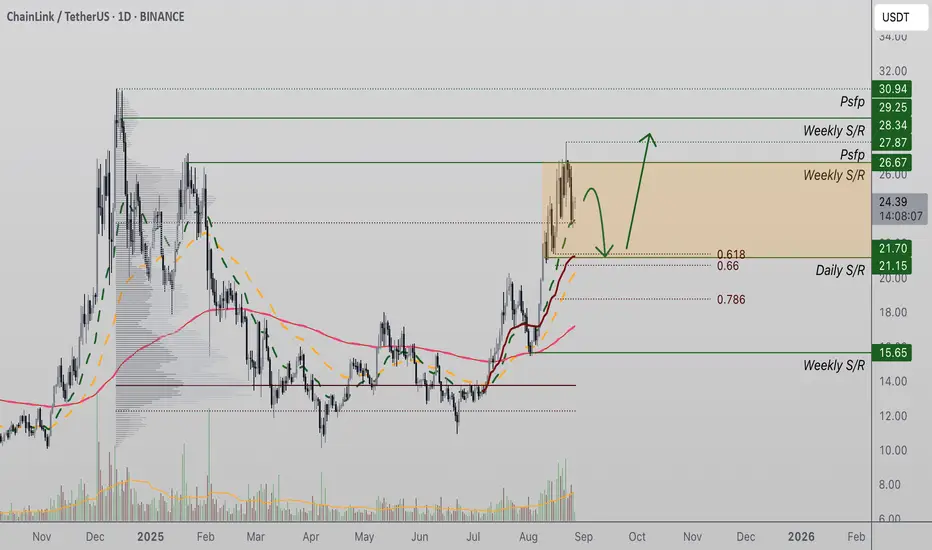
Chainlink Rejected at $26 but Support at $21.15 Holds Chainlink (LINK) has faced rejection from the $26 high time frame resistance after forming a bearish engulfing candle. Price now eyes the $21.15 support level, which is reinforced by strong technical confluence.
LINK’s recent rejection at $26 has temporarily slowed bullish momentum, with price retracing from its high time frame resistance. However, a key support zone is emerging at $21.15, a level backed by multiple technical indicators. If buyers defend this level during a retest, LINK’s bullish structure will remain intact, and a rotation toward higher objectives becomes highly probable.
Key Technical Points:
- Rejection at $26: Price was capped by high time frame resistance, leading to a bearish engulfing candle.
- Critical Support at $21.15: Confluent with the 50-day moving average and 0.618 Fibonacci retracement.
- Next Target $28.34: A confirmed bullish retest could open the path to this high time frame resistance.
LINK’s reaction at $26 highlights the importance of this resistance zone. The bearish engulfing pattern that formed here suggests profit-taking and the presence of sellers, leading to a retest of the value area high. Despite this rejection, the retracement appears orderly, with price action respecting key structural elements that still support a bullish outlook.
The $21.15 level now stands as the critical line in the sand. This zone is not only a horizontal support but also aligns with the 50-day moving average and the 0.618 Fibonacci retracement. Such a confluence often serves as a strong foundation for reversals or trend continuation. If LINK revisits this level and demand emerges, it would confirm the presence of buyers and validate the ongoing bullish structure.
Market structure remains favorable as long as higher lows are respected. Even after the rejection, LINK has not broken below key structural supports, meaning that the overall trend bias remains intact. A successful retest of $21.15 would reestablish bullish confidence and allow for continuation toward the next resistance target at $28.34. Without a breakdown, the broader market narrative still leans toward continuation higher.
What to Expect in the Coming Price Action:
If LINK holds $21.15 during a retest, bullish continuation becomes the most probable outcome, with $28.34 serving as the next upside target. However, a failure to maintain this support could weaken the structure and open the door to deeper corrective moves before any renewed upside momentum develops.
LINK: Bearish Setup: Rising Wedge BreakdownLINK: Bearish Setup: Rising Wedge Breakdown
This setup favors short positions or caution for long trades. The breakdown below the wedge provides a clear change in trend. If LINK fails to invalidate this pattern quickly, the path toward $17 looks increasingly probable.
LINK has already broken below the wedge, which confirms the bearish bias.
This breakdown suggests sellers are gaining control, and a deeper move is likely.
Target 1: $23.00
Target 2: $21.50
Target 3: $19
Target 4: $17
You may find more details in the chart!
Thank you and Good Luck!
PS: Please support with a like or comment if you find this analysis useful for your trading day
