Link Make A And B And Now Go To Target CLink Make A And B And Now Go To Target C
Targe
31
38
41
44
47
51
57
Take Profit After Tp
LINKUSDT.5S trade ideas
Link buy longLink looks good for buying if the market bounces from here link can start its rally again

LINK/USDT buy opportunitywaiting for pullback, step down to 22.51 to buy, a lot of demand on that price area, after consolidation near that price range, think that at least 5% step up is pretty possible

LINKUSDT shortAfter the Liquidity Sweap and breaking the structure I expect the market to fill the inbalance. I will wait for a retest into the OB and enter a short trade

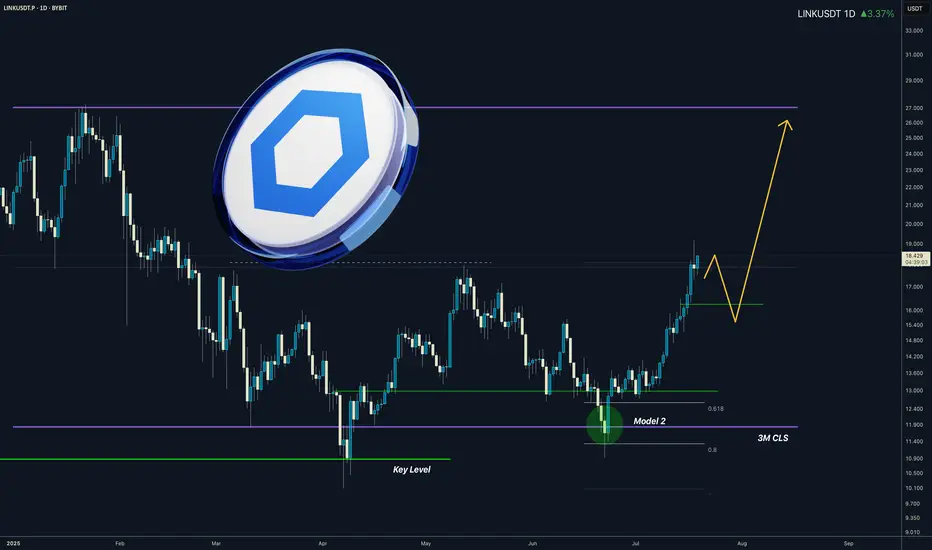
LINK I 3M CLS I Model 2 In the Motion I Target Full CLS rangeYo Market Warriors ⚔️
Fresh Crypto Analysis— if you’ve been riding with me, you already know:
🎯My system is 100% mechanical. No emotions. No trend lines. No subjective guessing. Working all timeframes. Just precision, structure, and sniper entries.
🧠 What’s CLS?
It’s the real smart money. The invisible hand behind $7T/day — banks, algos, central players.
📍Model 1:
HTF bias based on the daily and weekly candles closes,
Wait for CLS candle to be created and manipulated. Switch to correct LTF and spot CIOD. Enter and target 50% of the CLS candle.
For high probability include Dealing Ranges, Weekly Profiles and CLS Timing.
Analysis done on the Tradenation Charts
Disclosure: I am part of Trade Nation's Influencer program and receive a monthly fee for using their TradingView charts in my analysis.
Trading is like a sport. If you consistently practice you can learn it.
“Adapt what is useful. Reject whats useless and add whats is specifically yours.”
David Perk aka Dave FX Hunter
💬 Comment any Coin I ll give you my quick view
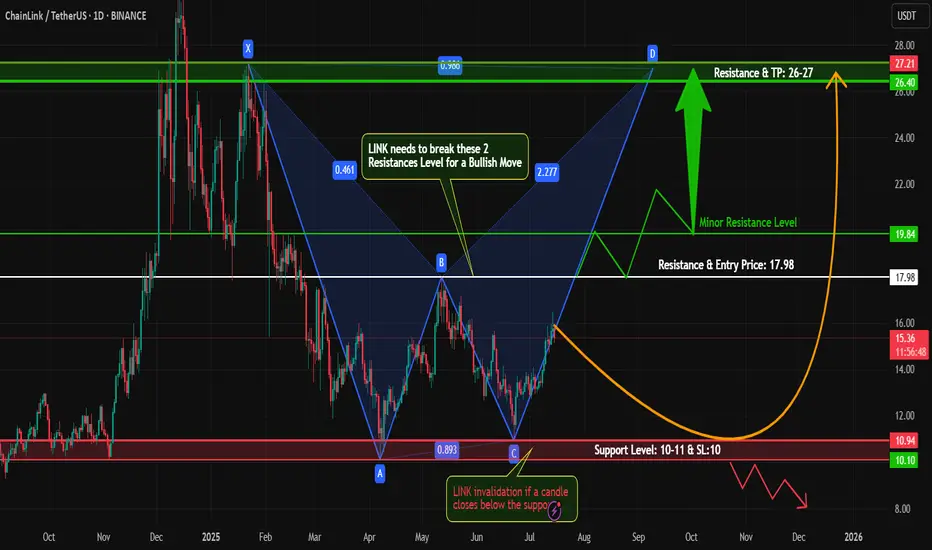
#LINKUSDT – Bullish Harmonic Pattern in Play!Hey Traders!
#LINK is currently trading near the bottom and forming a potential harmonic pattern, suggesting a possible move towards the D-point completion.
Technical Outlook:
Price action is respecting the harmonic structure.
We're watching closely for a break above key minor and major resistance levels.
A successful breakout and retest could confirm a bullish reversal.
Entry on retest with tight risk management and SL as marked on the chart.
Caution: Stay alert for fake breakouts, bearish divergence, or any signs of rejection near resistance. Patience is key — wait for confirmation!
What are your thoughts on #LINK? Are you bullish or bearish? Drop your analysis below!
If you found this setup helpful, like, comment, and follow for more high-probability trading setups every week!
#Crypto #LINK #HarmonicPattern #Altcoins #ChartAnalysis #CryptoTrading #TradingView #BullishSetup #BreakoutTrade #RiskManagement
Check if it finds support around 23.98-25.17 and rises
Hello, fellow traders!
Follow us to get the latest information quickly.
Have a great day.
-------------------------------------
Chainlink is one of the coins connected to many ecosystems.
Therefore, I believe it's worth holding for the medium to long term.
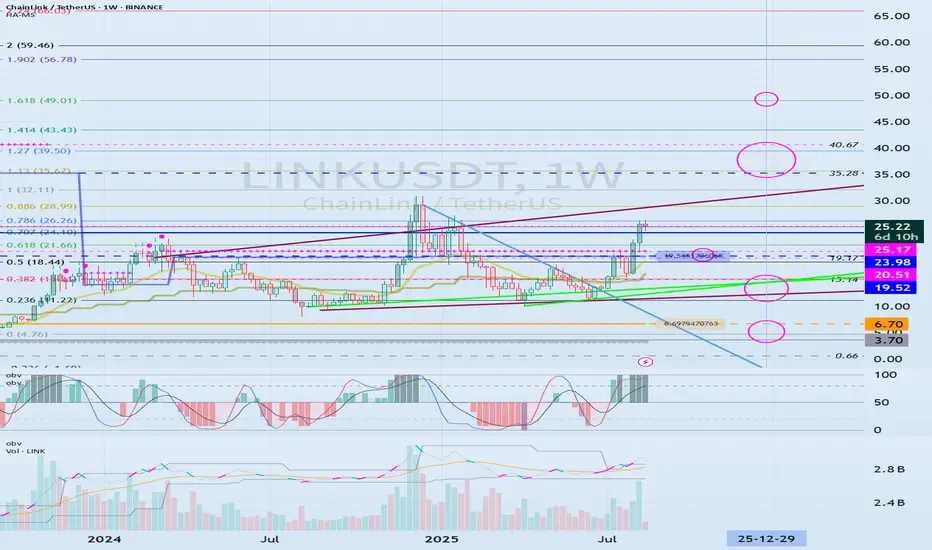
(LINKUSDT 1M chart)
The key is whether the price can find support around 23.98-25.17 and rise along the uptrend line.
If not, caution is advised as it may touch the lower uptrend line.
-
(1W chart)
If the price finds support around 23.98-25.17 and rises,
1st: 35.28-40.67
2nd: Fibonacci ratio 1.618 (49.01)
It is expected to rise to the 1st and 2nd levels above.
After that, a bearish turn appears likely.
Based on the current price, if it falls below the 19.52-20.51 range, it is recommended to stop trading and wait and see how the situation develops.
-
(1D chart)
Ultimately, the key is whether the price can break above the uptrend line (1).
If not, you should check for support within the circled area marked on the chart.
However, if the price falls below the M-Signal indicator on the 1M chart, you should stop trading and wait and see how things turn out.
-
Thank you for reading.
I wish you successful trading.
--------------------------------------------------
- This is an explanation of the big picture.
(3-year bull market, 1-year bear market pattern)
I will explain in more detail when the bear market begins.
------------------------------------------------------
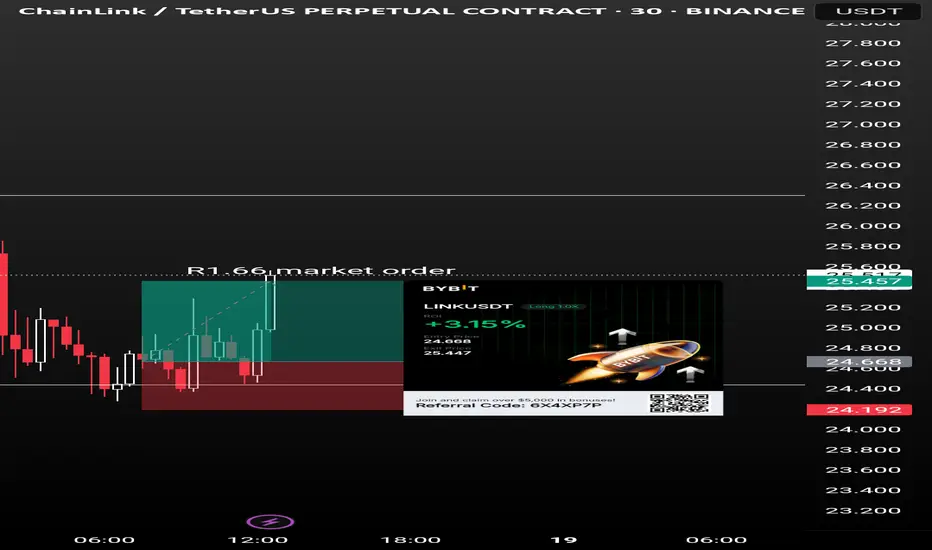
Trade long on link doneA Good long trade on link took today on 30min TF.
Wish you all Good, leverage x1. Keep the process step by step
Chainlink Faces Make-or-Break at $25.70Chainlink (LINK) is flashing strength on the charts, but one BINANCE:LINKUSDT level could define the next move. The price is currently pinned between $24.70 and $25.70. A clean breakout above $25.70 sets the stage for a possible run toward $28.20 and even $30.10—based on Fibonacci projections.
But here’s the caution: if LINK dips below $21.40, the short-term bullish trend breaks down.
Whales have recently added over 1.1 million LINK (~$27 million), and Smart Money wallets are still accumulating. That’s been the fuel behind LINK’s outperformance in a weak market. But exchange reserves just jumped by 300,000 LINK, signaling potential profit-taking. The top 100 wallets are also showing mild signs of selling.
The BINANCE:LINKUSDT resistance at $25.70 is the line to watch. If the bulls clear that, momentum could flip hard. Until then, the $21.40 support is the risk zone traders need to respect.

LINK Retest in Play — Watching Fib SupportsLINK recently broke above a key resistance level, which has now turned into support. The price is currently retesting this zone, and a reversal to the upside may follow from here.
If the price dips further, additional support lies at the 0.618 and 0.5 Fibonacci retracement levels, where another potential reversal could occur. Let’s watch how price action develops around these levels.

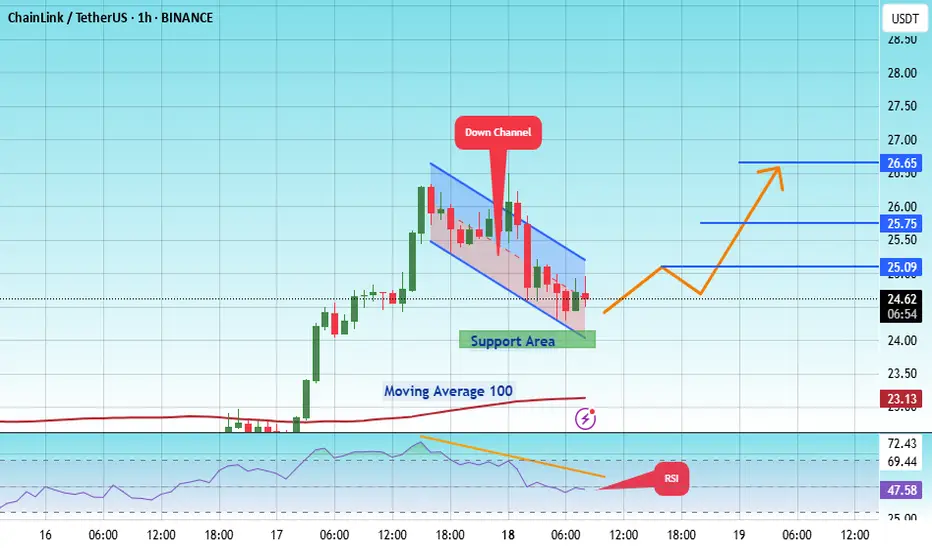
#LINK/USDT in upward mood !#LINK
The price is moving within an ascending channel on the 1-hour frame, adhering well to it, and is on track to break it strongly upwards and retest it.
We have support from the lower boundary of the ascending channel, at 24.20.
We have a downtrend on the RSI indicator that is about to break and retest, supporting the upside.
There is a major support area in green at 24.00, which represents a strong basis for the upside.
Don't forget a simple thing: ease and capital.
When you reach the first target, save some money and then change your stop-loss order to an entry order.
For inquiries, please leave a comment.
We have a trend to hold above the 100 Moving Average.
Entry price: 24.60.
First target: 25.09.
Second target: 25.75.
Third target: 26.65.
Don't forget a simple thing: ease and capital.
When you reach your first target, save some money and then change your stop-loss order to an entry order.
For inquiries, please leave a comment.
Thank you.
Link shows clear bearish divergenceIf we look closely at LINK/USDT right now, the charts are flashing a clear bearish divergence. This setup usually acts as a warning sign, and the price action is already hinting at a potential correction. The first important zone to watch is around 19.5 – it lines up with the golden pocket as well as a previous resistance that can now flip into support.
But if Bitcoin dominance continues climbing, there’s a risk of LINK moving deeper into correction territory. In that case, the 17.5 zone becomes a realistic target, and a move into that range would confirm a stronger bearish dump.
So the play here is simple: keep an eye on 19.5 as the first defense zone. If it holds, bulls might get some relief. If it breaks, prepare for the possibility of LINK sliding down toward 17.5.

LINK 1D – Descending Resistance Broken, Retest in ProgressChainlink has broken out of a long-term descending resistance, flipping structure bullish on the daily timeframe. Price is now hovering near the breakout point, with potential for a successful retest.
Support: 24.0 (breakout retest), 18.0 (trendline support)
Resistance: 30.9 (major local high target)
Stoch RSI: Elevated, but still with room if momentum sustains
If LINK continues holding above 24, the breakout structure remains valid, setting sights on 28–30.9. Failure to hold this retest risks a deeper pullback toward 18.

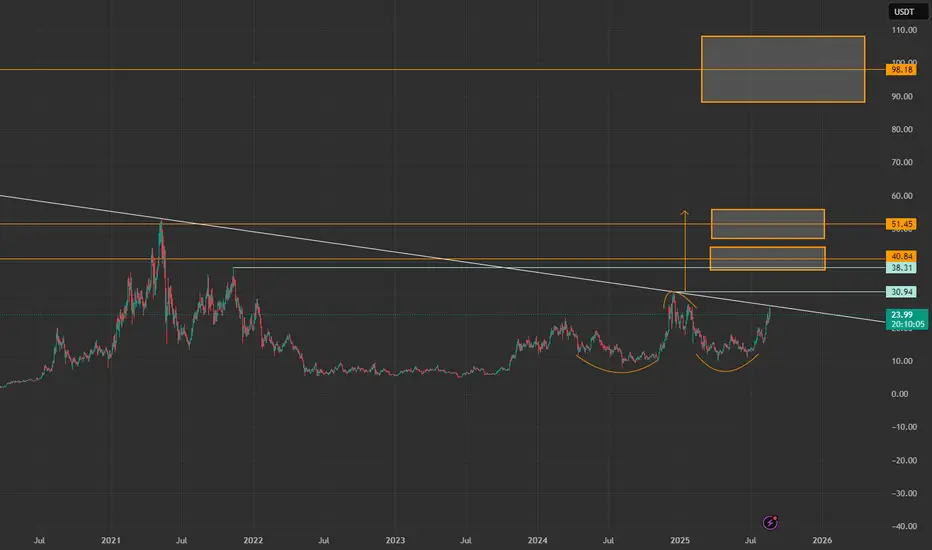
Chainlink 2025 All-Time High Price Projection At $130 & $82Chainlink market bottom after the last bull market happened June 2023. The orthodox end of the bear market was June 2022. Chainlink is a very strong project.
After reaching bottom in mid-2022, the pair immediately started trading sideways. LINKUSDT went sideways for an entire year—bottom consolidation/accumulation/opportunity buy zone—and finally entered a new uptrend. This uptrend is what we are witnessing up close.
After the rise in late 2023 ending March 2024 LINKUSDT settled for a wide consolidation channel with a bullish bent, with higher highs and higher lows. LINKUSDT has been moving in this channel for more than a year and we are seeing the unfoldment of a new higher high.
The way the chart is drawn, the candles and the patterns, the way the market is behaving and the rising volume are all pointing towards a major advance. It is already happening, but everything is about to speed up. It is already good, great, but it is about to get better.
The first target and immediate resistance is $35. This would produce the highest prices since November 2021 and open up the last stage of the 2025 bull market for this pair. Remember, each pair is different.
Then $82 is a strong target and very likely to be a troublesome resistance point. There can be a stop here... If my thinking is right, LINKUSDT can hit $130 in this cycle. The final target is between $82 and $130 but these might be conservative numbers.
Thank you for reading.
Namaste.

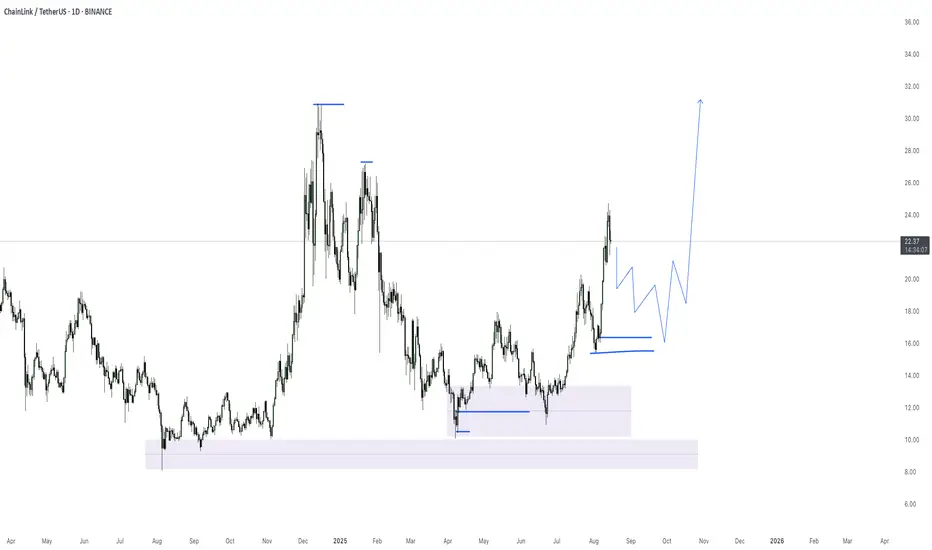
Chainlink is up 160% since early April —What now?This is the perfect chart. This chart is perfect proof of where the market is at as a whole and where it is headed. Chainlink is moving higher and now trades at the highest price since January 2025.
Go a bit higher, a target of $32, and we have the highest prices since November 2021, the previous bull market. And LINKUSDT will achieve this target easily and move higher. I also predict that we are going to see a new all-time high in 2025. And this is a high probability prediction, there is just too much data in favor of.
It all starts with a low in April and then we have a higher low in June. The market goes sideways for at least four months (120 days) without any significant growth before turning extremely bullish. By the time we reach this week, the market has been green for an entire month, since 16-June.
Ethereum did something similar. A low in April followed by a small recovery then sideways consolidation. When the sideways consolidation ended the advance is still on going today and ETHUSDT almost hit a new all-time high.
Chainlink is moving forward and becoming stronger. Cardano is moving forward and many more projects are doing great. Slowly but surely, the altcoins market is starting to heat up and everything will change so fast, for the better.
One day we are buying, waiting, sharing, learning, holding and trading, the next day the entire market is up 300-500%. Then it keeps on growing.
Chainlink (LINKUSDT) is up more than 160% since its 7-April 2025 low. There is room for plenty of additional growth.
We will look at this pair again soon with 2025 all-time high projections. Make sure to follow to receive a notification when the post goes live.
Namaste.

LINK/USDT 20% CONFIRM MOVEBullish bias is strong: All major indicators (RSI, MACD, MAs) are aligned, pointing to continued upward movement.
Watch key zones: Holding above $24.7 would support further upside, while a drop to $19–$20 might offer a better entry point.
Realistic target range: $26–$28 in the short term; sustained momentum could open a path toward $30+
LINK IS ALREADY TESTING MAJOR FIB LEVEL WATCH OUT FOR RETEST ANND BUY WITH POTENTIAL TARGET of 31$ PREVIOUS HIGH. COULD MOVE UPTO $45+

link in upward mood
LINK is on an upward trajectory and has managed to achieve significant growth.
Support and resistance levels are clearly indicated on the chart.
$26 and $30 are important resistance levels."

LINK: The Sleeping Giant About to Wake Up...Hello Traders 🐺
In this idea I want to talk about LINK price targets, because I really believe that in the next 3 months we’re going to see a massive pump in the Altcoin section — and Chainlink will be one of those coins that surprises a lot of people. Let’s talk about it 👇
As you can see on the chart, LINK has formed a gigantic Triangle pattern over the years, and right now the price is sitting around the triangle resistance line. In my opinion, there’s a high chance to finally break above it — especially because ETH is currently pushing against its ATH around $4,900. If ETH manages to break above, the top 20 altcoins will most likely follow ETH as a leading indicator for the whole altcoin section.
🔑 Price Targets:
Using the Fibonacci trend-based tool (which works perfectly for triangle breakouts, especially on the log chart), we can clearly spot the most important levels for LINK.
First target: The current ATH around $53 → potential first take-profit zone.
But in my opinion, it’s too early to fully exit here. A much better target is around the 0.786 Fib level, where I would personally consider closing around 75% of my long positions, moving stop-loss to the ATH ($53), and letting the rest ride for even higher targets.
And as always, my friends, remember our golden rule:
🐺 Discipline is rarely enjoyable, but almost always profitable. 🐺
🐺 KIU_COIN 🐺

LINK Rally Cools Off — Next Long Opportunity at $20LINK has awakened with strength, rallying +60% in just 10 days. Price completed a clean 5-wave Elliott impulse, topping at the 1.0 trend-based Fib extension, which aligned with:
0.702 Fib retracement
Pitchfork upper resistance line
Key resistance zone
This perfect confluence marked the 5th wave top, followed by a -13% correction.
🔴 Short Opportunity
The current structure is forming a Head & Shoulders pattern.
➡️ Resistance zone: $23 – $23.5
🧩 Confluence factors:
Anchored VWAP (red line) from the 5th wave top
Fib speed resistance fan – Golden Pocket
➡️ Target: $20 support zone.
🟢 Long Opportunity Zone
The $20 zone offers the strongest confluence for a long entry:
Yearly Open (yOpen): $20.02
0.5 Fib retracement: $20.09 (of the 5 Elliott waves)
Pitchfork golden pocket
Anchored VWAP (green line): $20.28 (swing high)
Fair Value Gap (FVG) / imbalance fill
Liquidity pool
$20 psychological level
Trade Plan:
Entry: $20.5 – $19.5
Stop Loss: Below $19
Take Profit: $25
Potential gain: +25%
R:R: ~1:5
🔍 Indicators used:
DriftLine — Pivot Open Zones → For identifying key yearly/monthly/weekly/daily opens that act as major S/R reference points
➡️ Available for free. You can find them on my profile under “Scripts” and apply them directly to your charts for extra confluence when planning your trades.
_________________________________
💬 If you found this helpful, drop a like and comment!

Short LinkI am Stiller bullish on crypto alts, but i think link will make a LH then continue to uptrend

LINK 1D – Pullback Toward Demand Zone in UptrendLINK has pulled back from descending resistance after an aggressive rally, with price now approaching the $19–$20 demand zone that aligns with ascending trendline support. A bounce here could set up another attempt at the $24–$25 descending resistance, where a breakout would open targets toward $28+. Failure to hold the demand zone risks a deeper retracement toward the $16–$17 area. Stoch RSI remains elevated but is beginning to roll over, signaling that momentum could cool before the next leg.

LINK/USDT - LONGdaily chart analysis highlights strong bullish momentum, marked by a sharp upward move. The price is expected to perform a pullback to the 18$–15$ support zone before resuming its bullish trend, potentially reaching 27$–32$.
Chainlink correctionIn my view current short term correction could stop @ 17,9$ area where bullish trend could restart to target 33-34$ area
