LINK to 1000 USDTChainlink (LINK) is setting up for a major breakout. Based on my technical analysis, the current market structure and momentum indicators suggest an accelerated move toward the $1,000 level is on the horizon. Key support holds strong, volume patterns are aligning with historical rally setups, and macro sentiment in the crypto space is turning bullish. This idea outlines my chart-based reasoning for why LINK could reach four figures sooner than many expect.
LINKUSDT.5S trade ideas

$LINK / USDT – Indicators Not Maxed, Big Picture Thinking.ChainLink is hovering just above Buy Zone 2 — price hasn’t tapped it yet, but it's close. This zone around $13.21 to $12.50 remains the key area of interest. If the market gives us that dip, it could be a solid spot for high-conviction entries.
Looking at the 3D timeframe, indicators like the MACD, stochastics, and other oscillators are nowhere near overheated. We’re not seeing blow-off tops or maxed-out momentum — which tells us this market still has room to run. At the same time, it’s not “cheap” forever.
If you're thinking longer-term, this is the kind of setup where reasonable, staggered accumulation makes a lot of sense — especially in utility-heavy, fundamentally proven projects like ChainLink. You don’t need to go all-in, but building exposure in anticipation of a reaction from these zones is a rational approach.
Key Levels:
🟢 Buy Zone 2: Untouched, watching $13.21–$12.50
🟢 Buy Zone 3: $11.95–$10.00 (big bids if BTC corrects)
🔴 TP1: $15.15
🔴 TP2: $19.50
🎯 Final Target: $22.25–25.00
📈 We may not have the entry yet — but the structure is shaping up.
📡 Follow @BahtMover on X for real-time entries, updates, and volume-driven setups.

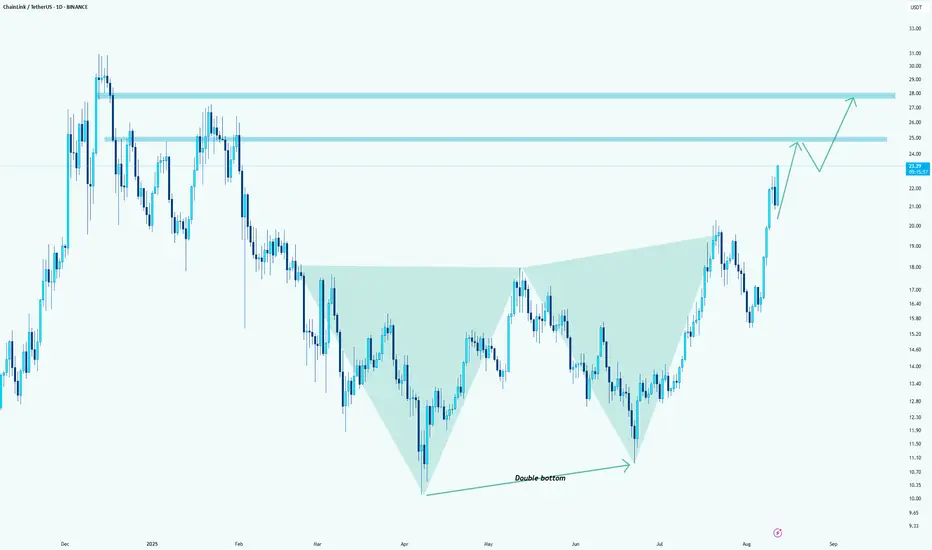
Link: it formed a double bottomHello guys.
Link formed a double bottom and a divergence at the same time!
You can count on longs here.
Target1: 25
Target2: 28
The pressure from buyers is high! I hope you can get it on the pullbacks
LINKUSDTThis chart is in a bullish trend, but it broke a new high at $22.7. If BINANCE:LINKUSDT can keep the price above $20, we can expect it to reach a higher high.
Please control risk management.⚠️


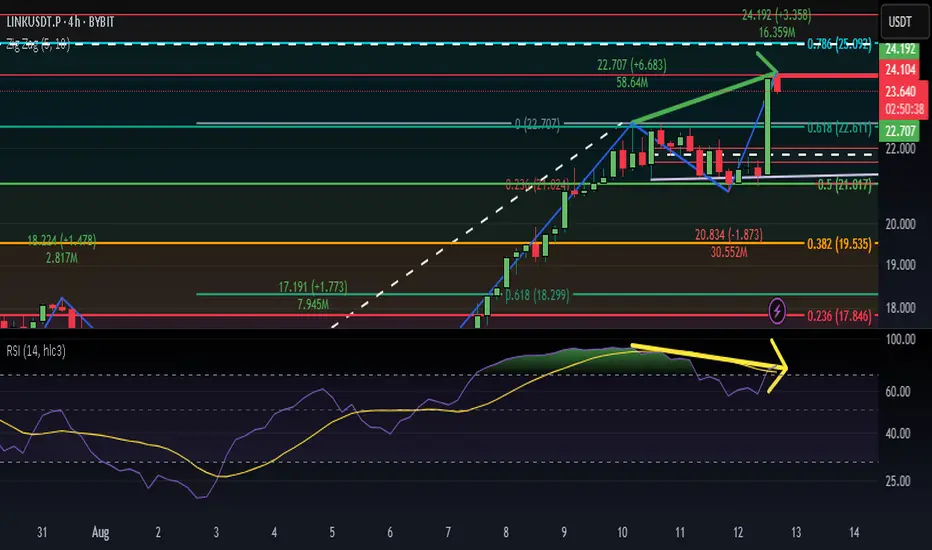
LINK 4H – Holding Above $21 Support After BreakoutChainlink surged above the $21 resistance, flipping it into support and consolidating near $23.80. The breakout aligns with strong bullish momentum from early August, with the $21 zone acting as a key defense area for bulls. Stoch RSI is mid-range, leaving room for further upside if momentum picks up. A push above $24.50 could target $26, while losing $21 risks a pullback toward the $15–$16 support region.

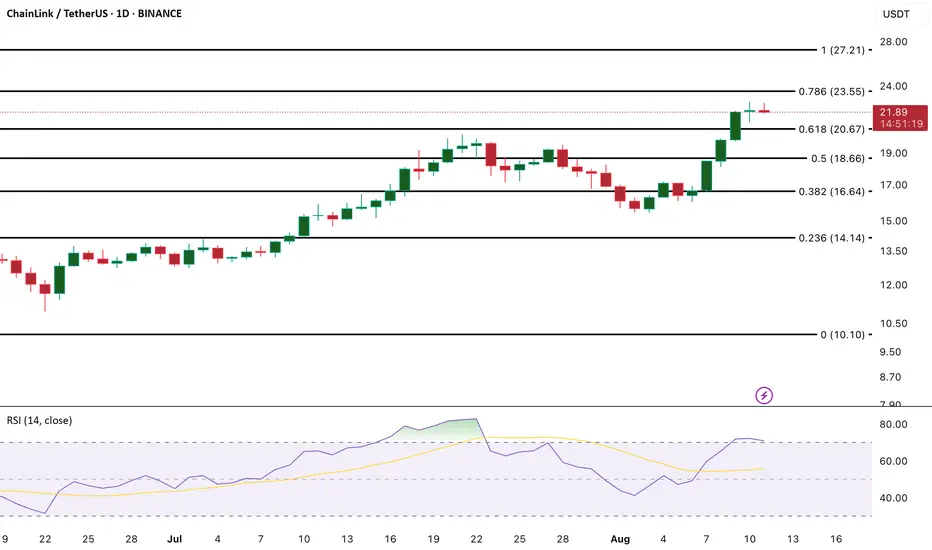
Chainlink Wave Analysis – 12 August 2025- Chainlink broke the resistance zone
- Likely to rise to resistance level 26.00
Chainlink cryptocurrency recently broke the resistance zone between the round resistance level 20.00, the resistance trendline of the daily up channel from April and the 50% Fibonacci correction of the downward impulse from December.
The price just reversed up from this price zone (acting as the support zone after it was broken) and continues to rise inside the active impulse wave (3).
Chainlink cryptocurrency can be expected to rise further to the next resistance level 26.00, which is the former strong resistance from January.

i see divegenceif 24.1 is one of the top a HH i see a devigence beetven rsi and price action i think 23 is support and 24.2 is resistance what you think??
Why I'm long on LINK 3 reason backed by chart LINK/USDT – Monthly Chart Analysis
Chainlink is currently testing a multi-year resistance line that has capped price since the 2021 peak. The asset has been forming a large ascending triangle pattern with higher lows since mid-2022, showing accumulation pressure building up.
Resistance Zone: $27–$35
Current Price: $23.94
Support Trendline: Holding strong since 2019 lows
Structure: Bullish compression into resistance
Key Takeaways:
A monthly close above the resistance line could trigger a breakout towards $35–$50 in the medium term.
Until the breakout is confirmed, expect possible rejections and retests of the $20–$21 zone.
The risk/reward is attractive for spot investors looking for a breakout play.
📌 Watch the monthly close carefully — confirmation above resistance could mark the start of a strong LINK rally.

Chainlink (LINK): Break of Structure | Looking For 35% Push Chainlink has done pretty well; in the first BOS we failed to maintain the price above the area, yet we had a good bounce from EMAss, where buyers showed once again the dominance and now the price is back in another BOS.
We are looking for another 35% of market price movement from here, with the price near BOS being our DCA zone, in case we fall.
Swallow Academy

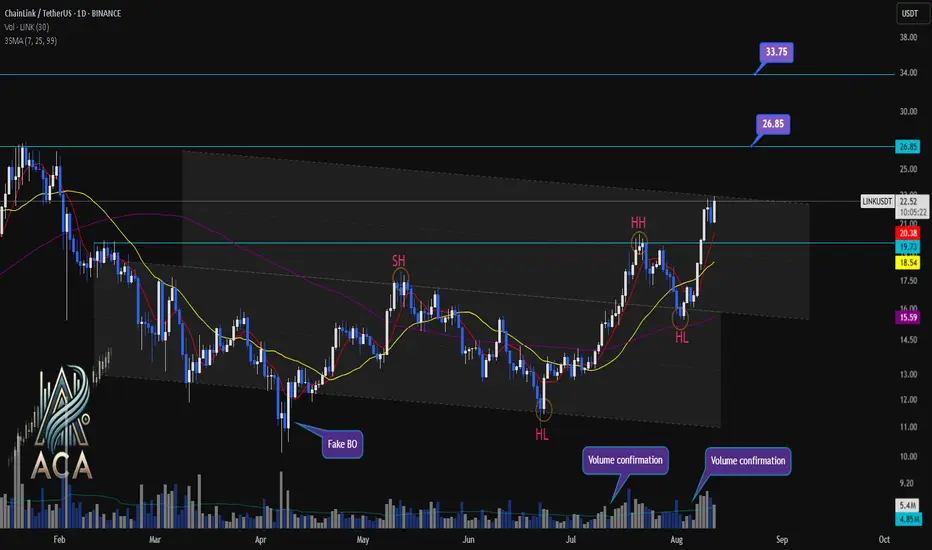
CHAINLINKUSDT Daily Chart Analysis | Channel BreakoutCHAINLINKUSDT Daily Chart Analysis | Channel Breakout & Bullish Momentum
🔍 Let’s dive into the ChainLink/USDT spot chart, analyzing key swings, channel dynamics, and fresh momentum signals for a bullish scenario.
⏳ 1-Day Overview
The daily chart shows LINKUSDT surging toward the RR1 (Risk-Reward 1) of its channel pattern, marked by powerful volume confirmations that help validate the move. Price has decisively broken above prior resistance zones and continues to print higher highs (HH) and higher lows (HL). The chart’s swing structure is clear: a series of ascending pivots signaling a bullish reversal from past lows.
🔺 Channel, Swings & Momentum:
- Price action is respecting the well-defined channel; current breakout and move to RR1 highlights bullish control.
- Swings are established: recent HL and HH confirm upward structure.
- Volume spikes on breakouts further confirm buyer strength, supporting the move out of consolidation.
- 3SMA (7, 25, 99) alignment shows short- and medium-term averages crossing above the long-term trend—often a leading indicator for the start of a strong uptrend.
- Next targeted levels stand at $26.85 and $33.75, while the long-term target remains a fresh All-Time High (ATH), should momentum persist.
- Past “Fake BO” (breakout) risk now superseded by true volume-backed move supported by technical confirmations.
📊 Key Highlights:
- Channel breakout with confirmation at RR1, swing HH/HL structure for bullish momentum.
- Volume surges on upward moves—critical for authenticating breakout strength.
- 3SMA configuration points to the potential beginning of a major trend extension.
- Upside targets: $26.85 for the next level, $33.75 as extension, and new ATH as the bold long-term bull case.
🚨 Conclusion:
ChainLink’s breakout above channel resistance signals bullish intent with strong volume and swing confirmation. Eyes on next targets: $26.85 and $33.75. If volume and trend continue, new ATH is on the horizon.
LINKUSDT 4H BULLISH SETUP. LINKUSDT | 4H Bullish Setup
✅ Price broke structure and created a clean FVG + Retest POI just below current levels.
✅ SSL liquidity resting near the demand zone.
🔍 Price is pulling back and may tap into 20.50 – 20.80 POI/FVG zone for demand mitigation.
📌 Trade Idea: Wait for price to reach POI and confirm bullish signals before entering.
🎯 Potential upside continuation after liquidity sweep.

chainlink short to $20.29Just now opened up a short position on chainlink. Aiming for $20.29 based on dtt analysis.
Scaling out 70% at $20.48
Full close at $20.29
Sl: 22.04
Sized up a bit as this trade is higher probability than normal

ascending tringle i see ascending triangle in 4h time frame we are ready for big bullish what you think ?next target is 26!

LINK - Link your folio again LINK usdt looks strong to push to $30,12H chart loooks strong very strong very strong, buys till 18 looks good

Bullish on LINKIdea: Possible Buyer Trap Before Bigger Move
On the 1H chart, we’re seeing a strong volume thrust from the demand zone, pushing the price toward a key resistance level around 21.97. My expectation is for a break above this level, which could attract breakout buyers.
However, instead of continuing straight up, the price may pull back to retest and trap early buyers, shaking out weak hands before resuming the main bullish trend toward the upper channel (potential target: 23+).
This setup combines liquidity grab + continuation. I’ll be watching for confirmation on the retest before considering entries.

Chainlink long to $23.55Just now opened up a long position on Chainlink. Based on the price action it looks set to continue the new day in 10 minutes with straight pump. Maybe minor 15 min correction but doesn't look like any major sell pressure is schedule.
SL: 21.23
tp: 23.55
Roughly 3RR

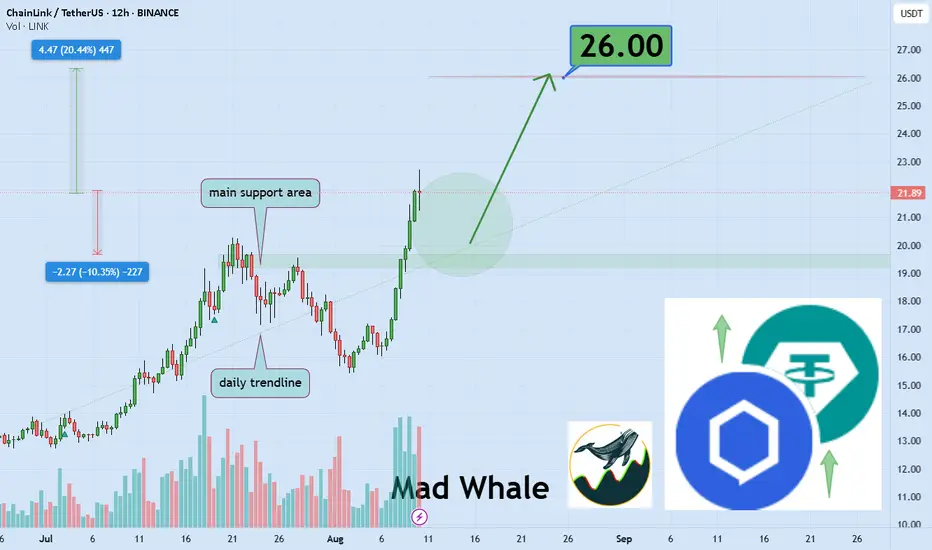
Chainlink Holding Strong Support, Targeting 20% Rally to $26Hello✌️
Let’s analyze Chainlink’s price action both technically and fundamentally 📈.
🔍Fundamental analysis:
Chainlink’s onchain reserve uses smart contracts to turn half of its fees and revenue into LINK buys. Since July 2025, over $1M in LINK has been saved, with no plans to sell soon.
This steady buying creates strong demand, like earning about 4.32% yearly staking rewards, which lowers available LINK. In the past, similar actions (like stock buybacks) have helped prices go up when usage grows.
📊Technical analysis:
BINANCE:LINKUSDT is holding key Fibonacci levels near strong daily support and a solid trendline. If it holds, a 20% rally toward $26 is likely 📈🔒
✨We put love into every post!
Your support inspires us 💛 Drop a comment we’d love to hear from you! Thanks, Mad Whale
LINK Surges 39% in a Week, but RSI Signals Pullback AheadChainlink (LINK) has gained impressive momentum, rising nearly 39% over the past week. This strong price action reflects renewed investor interest and bullish sentiment around the altcoin. However, technical indicators suggest caution may be warranted in the short term.
The Relative Strength Index (RSI), a popular momentum oscillator used to measure overbought or oversold conditions, currently indicates that LINK is overbought. RSI values above 70 typically signal that an asset might be overextended, making a pullback or consolidation likely before further upward moves.
For LINK, this means that despite the recent rally, traders should be prepared for a possible correction or sideways price action as the market digests gains.
#LINK/USDT targeting 17.77 $ ?#LINK
The price is moving within a descending channel on the 1-hour frame and is expected to break and continue upward.
We have a trend to stabilize above the 100 moving average once again.
We have a downtrend on the RSI indicator that supports the upward break.
We have a support area at the lower boundary of the channel at 15.60, acting as strong support from which the price can rebound.
We have a major support area in green that pushed the price higher at 15.30.
Entry price: 15.84
First target: 16.47
Second target: 17.00
Third target: 17.77
To manage risk, don't forget stop loss and capital management.
When you reach the first target, save some profits and then change the stop order to an entry order.
For inquiries, please comment.
Thank you.

ChainLink $32 & $47 · A Different PerspectiveGood evening my fellow Cryptocurrency trader, how are you feeling in this wonderful day?
We are back to work and today I am looking at ChainLink for you, on the weekly timeframe.
We want to know what is happening short-term and where the market is headed in the long haul. We want a clear analysis and we want positive results and hope.
Technical analysis
LINKUSDT Weekly. Notice the purple line on the chart, this is now support. Just last week LINK closed below this line. This week started lower and now LINKUSDT is trading far above this level. This was a price of $17 but ChainLink is trading at $22.22.
Where I am going with this is about bullish and bearish potential short-term. The drop is no more. LINKUSDT closed one week red but turned green the next week. This green is the confirmation of a failed breakdown. A bear-trap. The fact that LINK is now much higher signals the continuation to the next major resistance level and this is first $32.
This is a technical double-top with December 2024 and we know ChainLink has been moving in a channel (brown) that is composed of higher highs and higher lows, thus we expect a higher high next and that's when we get ChainLink trading at $47 and this will not be the end. This will only be one leg, one major advance, there will be more. The Cryptocurrency market is set to grow long-term.
Namaste.

$LINK (Chainlink) 6HChainlink remains a key infrastructure project in crypto, powering oracle solutions across DeFi and institutional blockchain integrations. Growing adoption in tokenized assets and cross-chain applications keeps LINK in strong demand.
After a strong breakout above the $20 zone, price is consolidating near $22. A healthy pullback could set up the next leg higher toward $26. Previous resistance at $20 now acts as strong support for the bullish continuation.

be carefulli see a head and shoulder in 4 time frame i think its really dangres chech rsi in dayly time if about 75 or 85 its possible to reverse !what do you think??
