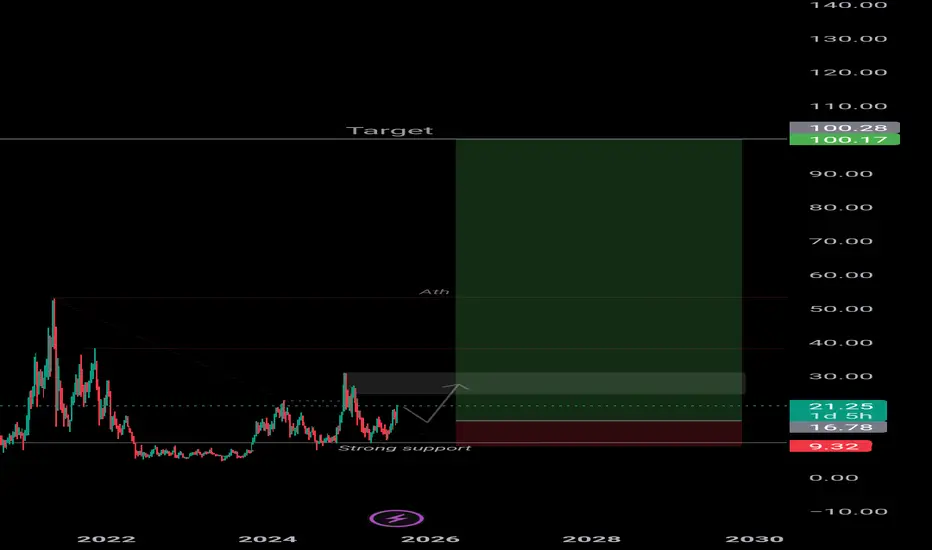
Link Bull Run CRYPTOCAP:LINK Final Target 100$ this cycle‼️‼️
Set-up 👇
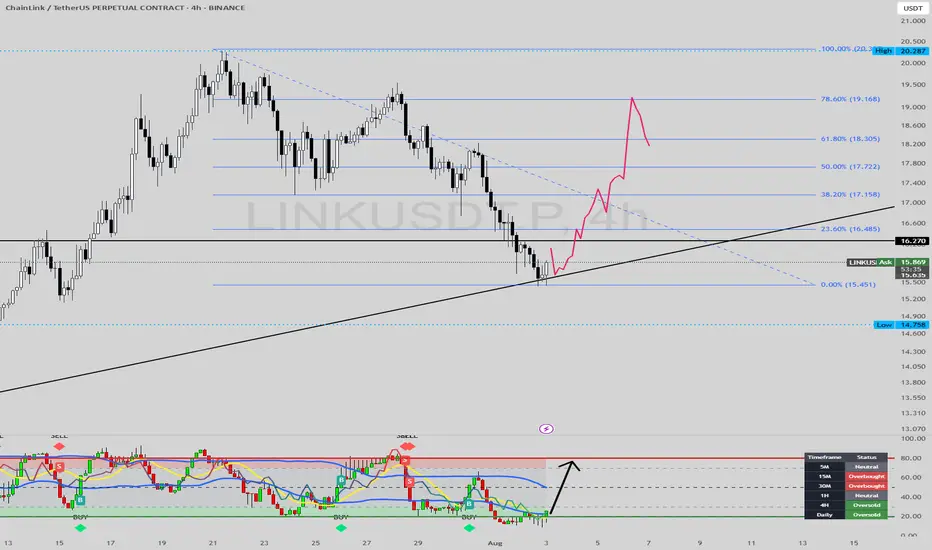
Holding above $16–$17 keeps the door open for $35, $50… maybe even $100 this cycle.
Spot Buy zone : 17$ - 14$
Tp & sl : Chart ✅
CRYPTOCAP:LINK
LINKUSDT.5S trade ideas
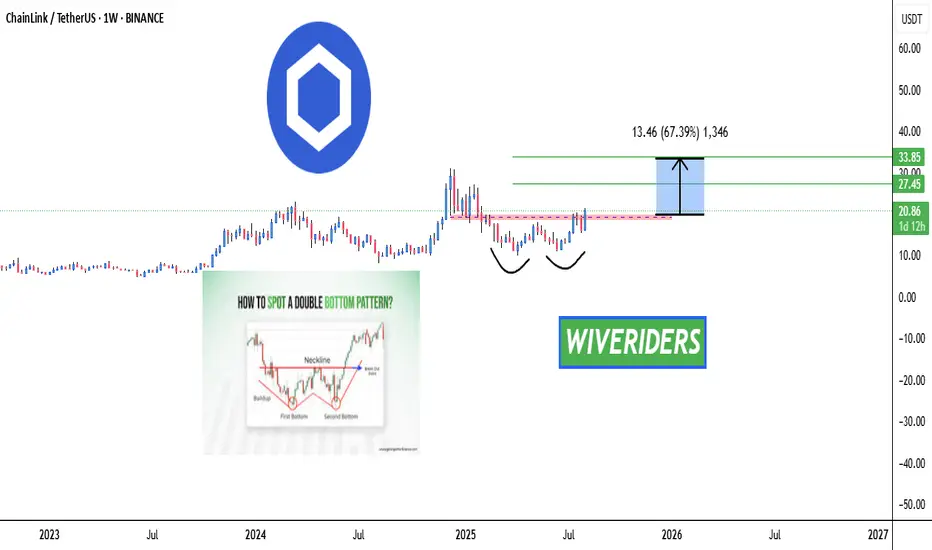
LINK Weekly Breakout Watch – Bullish Double Bottom Forming! 🚨 CRYPTOCAP:LINK Weekly Breakout Watch – Bullish Double Bottom Forming! 🔴📈
CRYPTOCAP:LINK is showing a bullish double bottom pattern on the weekly timeframe and is now testing the red resistance zone.
📊 If breakout confirms, next move could target:
🎯 First Target → Green line level 1
🎯 Second Target → Green line level 2
A breakout here could signal strong bullish continuation in the long term.
buy heavy link i See the trend is start bullish and i see a big bullish engulfing candle in weekly time frame its show link is going to 30 to next week just buy it now

Chainlink UpdateLooking at long term chart in my opinion chainlink will grow to 0.236 fibonacci level @41.6$, I don't think it can go beyond that target in this bullish cycle.
a great bullish engulfing candlei see a big bullish engulfing candle in weekly time frame we ready for big bullish next target is 240

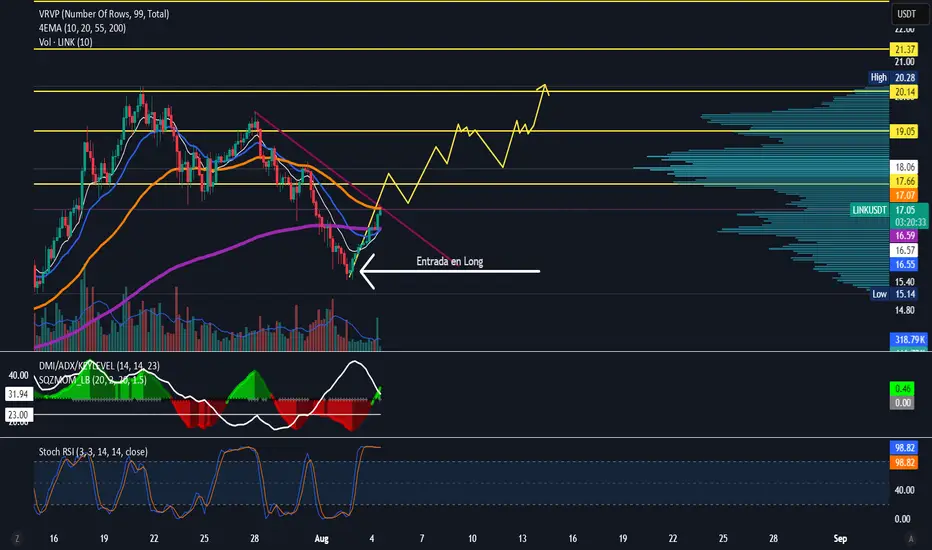
LINK/USDT Bullish Setup – Rebound from Demand Zone Targets ChainLink (LINK) is showing a potential bullish reversal on the 4H timeframe, after defending the key demand zone between $15.60 – $16.20. Buyers stepped in aggressively, and price is now forming higher lows — a good signal of trend shift.
🔍 Technical Breakdown:
Demand Zone (Support): $15.60 – $16.20 (highlighted in orange)
Current Price: $16.65 (bullish structure forming off support)
First Target (TP1): $17.95 (prior resistance / mid-range)
Second Target (TP2): $19.55 – $20.00 (major supply zone)
✅ Bullish Confluences:
Strong bounce off demand zone
Bullish structure forming (higher low + bullish candles)
Volume Profile (LuxAlgo VRVP) confirms demand at this level
Clear imbalance toward $19.55 zone
📌 Trade Plan:
If price continues upward and holds above $16.20:
Entry Zone: $16.50 – $16.80 (current market price)
Stop Loss (SL): Below $15.60 (beneath demand zone)
TP1: $17.95
TP2: $19.55
🧠 Notes:
Break above $17.95 confirms bullish continuation
Take partials around TP1 and trail remaining to TP2
$19.55 zone may trigger short-term pullback due to supply
🟢 Bias: Bullish (as long as $15.60 holds)

LINKUSD – Bullish Impulse Toward D-Point Target
LINKUSDT:
Title: LINKUSD – Bullish Impulse Toward D-Point Target
Price action has completed a corrective ABC structure, finding strong support at point C. The current breakout above mid-structure resistance confirms bullish momentum, aiming toward the D-point completion. Risk is managed below the breakout zone, with potential for trend continuation if price sustains above local support.
Risk Management Notes:
– Entry aligned with breakout confirmation
– Stop-loss below structural support (C-area)
– Take-profit near projected D-point completion


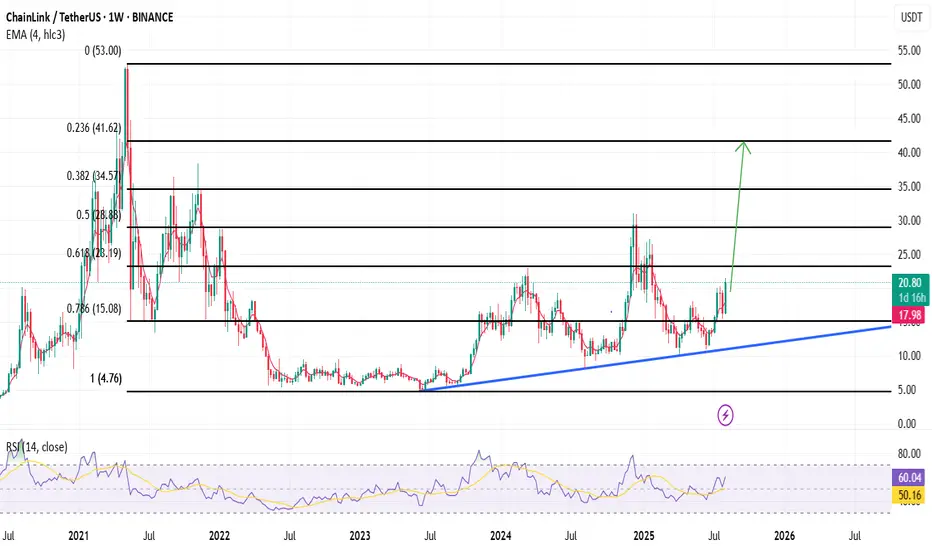
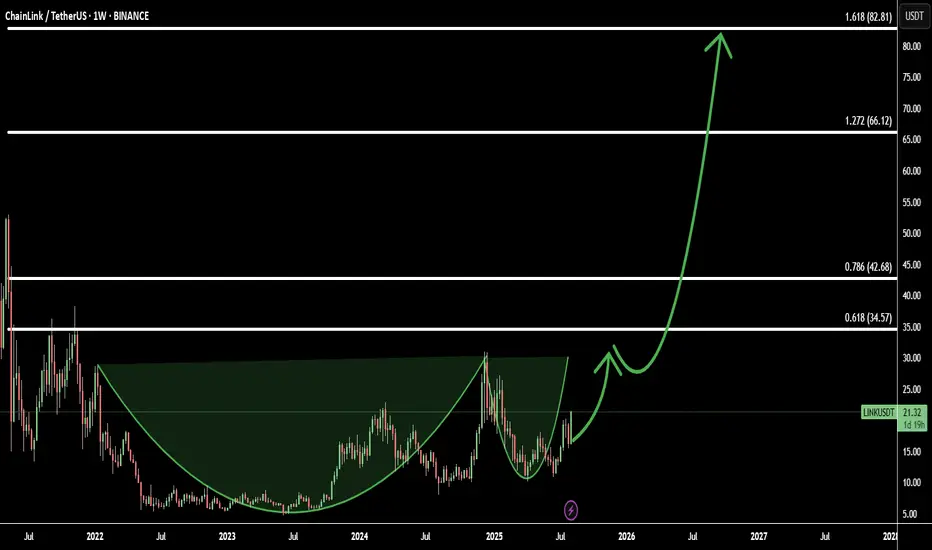
LINK/USDT – Cup & Handle Breakout: 4 Fibonacci Targets AheadGood luck to everyone who bought the dip — now Chainlink (LINK/USDT) is offering another buy opportunity before the big move.
On the chart, LINK has formed a cup & handle pattern — a strong bullish continuation setup that often marks the start of a major rally. This is the beginning of the movement, and price action is aligning perfectly with technical targets.
Using Fibonacci extensions, here are the 4 upside targets:
Target 1: 0.618 Fib – 34.57 - initial breakout confirmation
Target 2: 0.786 Fib – 42.68 - momentum acceleration zone
Target 3: 1.272 Fib – 66.12 - extended bullish target
Target 4: 1.618 Fib – 82.81 - full potential of the pattern
With momentum building and a clean breakout structure, LINK is ready to fly toward these targets.
You don't wanna miss LINK again Every sane person knows that LINK is a key project in the crypto industry. Without it, the entire ecosystem literally cannot exist. And its technological value is higher than SOL, XRP, and especially BNB.
However, many often dislike it because of its weak price growth. Well, now the price has started to rise, and it's time to take a closer look at the chart to see what lies ahead:
➡️ LINK is globally in a flag pattern and is now literally stuck in between, trying to find its next direction. This is a 5-year flag, so trust me, when it breaks out in one direction, the movement will be wild.
➡️ During its correction this winter, LINK formed a large GAP at the top at $26.46 - 20.45. And as we know, 99% of GAPs close sooner or later.
Of course, the last growth impulse was also quite ineffective and formed a gap right below us at the levels of $19.93 - 16.44.
➡️ Volume - there is a divergence in purchase volumes, which is certainly confusing. It shows a decline in buyer interest.
➡️ Money Flow - However, there is still harmony in liquidity inflows. This shows that new capital continues to flow into the asset.
📌 Conclusion:
The chart shows controversial trends, which largely indicate local overheating and a possible correction to the inclined support level. And don't forget that a decision on the LINK ETF is imminent. And while the DOGE ETF and other crap may not be approved, such a key project will not be overlooked.

Buy Trade Strategy for LINK: Driving Smart Contract ConnectivityDescription:
This trading idea focuses on LINK, the native token of the Chainlink network, a leading decentralized oracle solution that connects smart contracts with real-world data. LINK plays a critical role in enabling secure, reliable, and tamper-proof data feeds for DeFi, NFTs, gaming, and enterprise blockchain applications. As blockchain adoption accelerates, Chainlink’s expanding integrations and partnerships strengthen its position as the go-to oracle provider. The growing demand for accurate off-chain data in on-chain environments continues to support LINK’s long-term value proposition.
That said, the cryptocurrency market is highly volatile and influenced by factors such as regulatory changes, technological developments, and market sentiment. Investors should approach LINK with a clear strategy and strong risk management practices.
Disclaimer:
This trading idea is for educational purposes only and does not constitute financial advice. Cryptocurrencies like LINK carry substantial risks, including the possibility of losing your entire investment. Always perform your own research, assess your financial situation, and consult with a licensed financial advisor before making any investment decision. Past performance is not indicative of future results.

Long trade
📘 Trade Journal Entry
🔹 Pair: LINKUSDT
📅 Date: Friday, 8th August 2025
🕖 Time: 7:30 PM
🗺 Session: NY to Tokyo Session PM
⏱ Timeframe: 15-Minute TF
📈 Direction: Buyside
📊 Trade Details
Parameter Value
Entry Price 16.668
Profit Target 18.229 (+9.37%)
Stop Loss 16.562 (−0.64%)
Risk-Reward 14.73: 1
📌 Technical Context
Entry Zone: The trade was initiated after observing a sell-side liquidity sweep, followed by an internal break of structure (BOS), which supported the shift toward bullish intent. The trade aligns with a Wyckoff-style accumulation schematic, with a Phase C spring-type event visible. We anticipate that Phase D — a trending move within the range — is now underway.

Chainlink Wave Analysis – 7 August 2025- Chainlink reversed from the support area
- Likely to rise to resistance level 19.55
Chainlink cryptocurrency recently reversed from the support area between the support level 15.00 (former resistance from June), lower daily Bollinger Band and the 50% Fibonacci correction of the upward impulse i from June.
The upward reversal from this support area stopped the previous short-term ABC correction ii from last month.
Given the strongly bullish sentiment seen across the cryptocurrency markets, Chainlink cryptocurrency can be expected to rise to the next resistance level 19.55.

LINK : You want the link for the pump?Hello friends🙌
✅considering the recent market decline, the LINK market has also fallen like other currencies, and many of you are afraid that this is the end and the rise is over or is there still a rise?
✅Well, as we have indicated on the chart, after the price fell to the support area marked with Fibonacci, a double bottom pattern was formed and then the price was increased by buyers.
✅In this wave, we drew another Fibonacci and identified the area where the price pulled back, and we believe this currency has good potential for growth.
✅Now you can buy in steps in the specified areas with capital and risk management and move to the specified targets.
🔥Follow us for more signals🔥
*Trade safely with us*

SHORT LINKHere’s a detailed trading analysis for your SHORT setup on LINK/USDT based on the chart:
🔍 Chart Context
Pair: ChainLink / USDT
Exchange: Binance
Timeframes: 4H (left) and 15m (right)
Current Price: ~$18.05
Short Bias: Bearish reaction expected from supply zone
🔲 Key Zones & Levels
🔼 Resistance / Supply Zone
$18.11 - $18.50 (highlighted in purple box)
Price reacted sharply on first touch → signs of sell pressure.
Confluence:
Previous highs
Psychological resistance near $18.50
🔽 Support / Target Zone
$17.05 - $16.50 (marked by orange and green box levels)
Prior consolidation and demand area
First strong reaction expected around $17.10–$17.20
🧭 Trade Idea (SHORT)
🎯 Entry
Area: $18.05–$18.50 (preferably near the top of the purple box)
Confirmation: 15m or 1h bearish engulfing or liquidity sweep + reversal
⛔️ Stop Loss
Above $18.60
Reason: Above the wick and supply zone, avoiding stop hunt
📉 Targets
TP1: $17.50 (edge of green box, early profits)
TP2: $17.00 (orange support line)
TP3: $16.50–$16.00 (final target on full breakdown)
🔧 Technical Indicators
RSI (Relative Strength Index)
4H RSI: ~69.74 → nearly overbought
15m RSI: ~66.90 → potential bearish divergence
Conclusion: Momentum slowing, ripe for pullback
Volume
Spike on breakout to $18+ zone → Possible buy climax
Declining after → suggests distribution phase
🧠 Probability Triggers
✅ High Confluence for SHORT
Strong supply zone
Overbought RSI
High volume spike + exhaustion
Clear FVG (Fair Value Gap) and imbalance below
❌ Short Invalidated If
Break & close above $18.60 with volume
Consolidation above $18.50
📝 Summary
Criteria Details
Bias SHORT
Entry Zone $18.05 – $18.50
Stop Loss Above $18.60
Target Range $17.50 → $17.00 → $16.50
Risk/Reward Approx. 1:2.5 to 1:3.5
Confidence ✅ High (Supply zone + RSI + Volume confluence)

LINK SHORT It seems like a lower high has now formed. Following the trend positioning into a short position makes sense here.

Chainlink (LINK/USDT) from 1D interval📈 Trend and Market Structure
Current trend: Upward (higher lows and highs)
The price is moving within an ascending price channel, marked by two black trend lines.
The recent rebound occurred from support around 14.83 USDT, which coincides with the lower boundary of the channel.
🔍 Key Levels
✅ Resistance (green horizontal lines)
18.98 USDT – local high
21.16 USDT – main resistance, possible target after breaking $19
18.27 USDT – current local resistance zone, currently being tested
17.62 USDT – mid-range resistance
🛑 Support (red horizontal lines)
15.97 USDT – first local support
14.83 USDT – important support (price reaction, trend confirmation)
13.30–13.50 USDT – key demand zone
12.50 USDT – lower historical support
📊 Indicators
🔄 Stochastic RSI
%K and %D lines cross from below → buy signal
Currently emerging from oversold levels (< 20), which could indicate a continuation Growth
📉 MACD
The histogram is decreasing, but the rate of decline is slowing.
Possible buy signal if the MACD line crosses the signal line from below.
🔊 Volume
Increasing volume during gains, lower volume during corrections – confirms bullish strength.
The recent decrease in volume may indicate consolidation or preparation for the next move.
📌 Scenarios
🟢 Bullish Scenario:
Uptrend maintained within the channel.
Breakout above 18.27 and 18.98 → possible rally to 21.16.
Confirmation by MACD/Stoch RSI.
🔴 Bearish Scenario:
Break of support at 15.97 and the trend line → possible decline to 14.83 or lower (13.30).
MACD may continue to decline if a strong rebound is not achieved.
🧠 Summary
Trend: Bullish
Price is currently testing resistance at 18.27.
Key support levels to watch: 15.97 and 14.83.
Indicators are providing potential buy signals, but confirmation will be needed on higher time frames or on stronger volume.

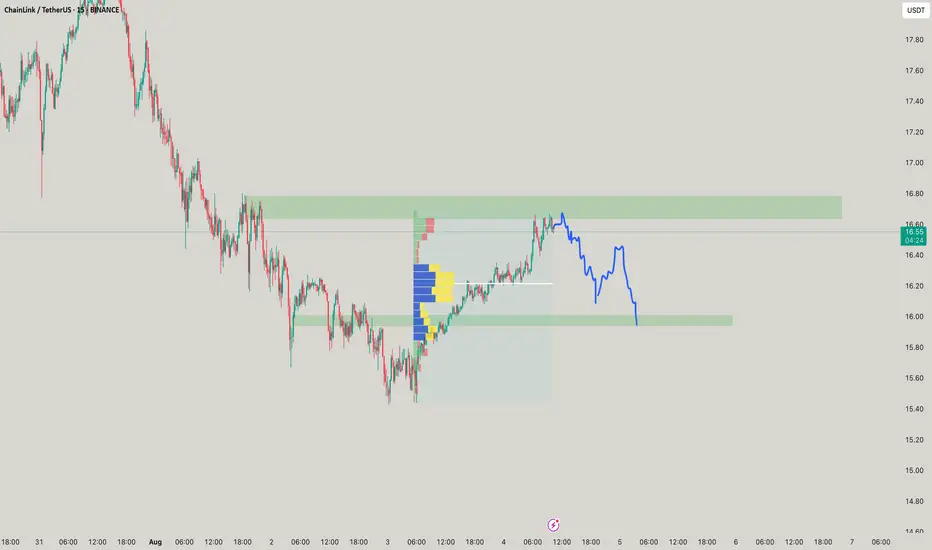
LINK/USDT 15M SETUP.LINK/USDT 15m Setup 🔥
Price confirmed a bullish shift with a clear ➜ ChoCH.
Now retracing and heading toward a Hidden Demand Zone, with Sell-Side Liquidity (SSL) resting above it.
📍 Expecting price to sweep SSL and tap the zone before a potential bullish reversal.
Perfect SMC setup — wait for reaction and confirmation! 📈


Buyer Setup BuildThere is a buyer setup already created. What to wait? Just some pullbacks, take longs, take profits on high demand zones, and wait for another pullback. This month I could wait for looking some new ATH on some criptos, i doubt a lot than link/usdt can reach yours, but nobody knows. In the meant time, keep waiting
LINK Targets $21.60 with Bullish MomentumLINK Targets $21.60 with Bullish Momentum
After Bitcoin’s explosive surge to $118800, the entire crypto market is on fire, and Chainlink (LINK) is one of the standouts.
LINK has broken out of a well-defined bullish pattern and continues its upward push since yesterday.
If you're already in the trade, consider holding your position, as LINK shows strong potential to reach $17.60, $19.60, and possibly even $21.60.
If you're not yet in, an ideal entry zone to monitor is around $14.00 to $14.50.
Momentum remains strong, and the breakout structure supports further upside.
You may find more details in the chart!
Thank you and Good Luck!
PS: Please support with a like or comment if you find this analysis useful for your trading day

ChainLink LongFollowing a significant decline, the asset will take support and bounce back from this point.
Disclaimer: This is not financial advice.
This algorithm provides highly precise buy and sell signals with alerts: