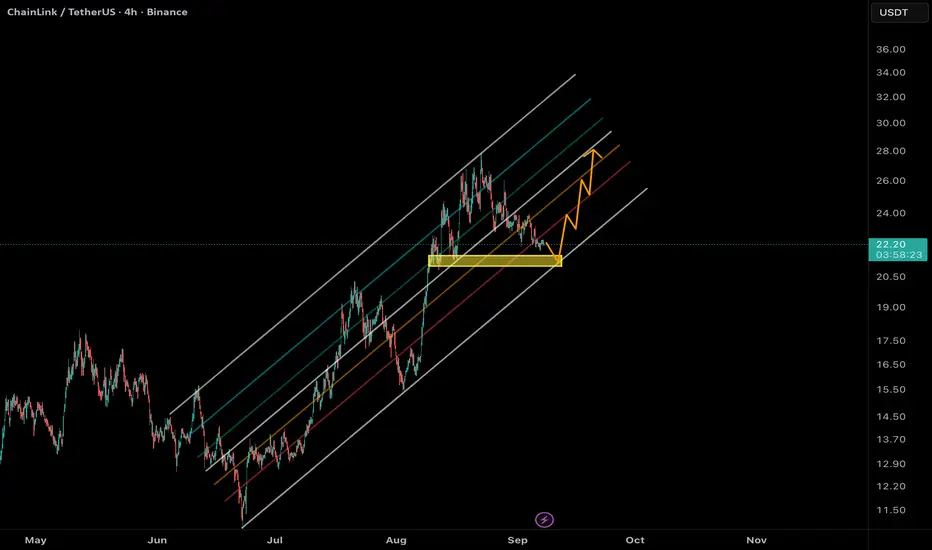
LINK 8H – Riding Trendline Toward $26.8 LiquidityChainlink continues to respect its ascending trendline while staying above both EMAs, with the Fib 0.5–0.618 cluster ($21.6–20.2) providing strong support on prior dips.
Upside:
Holding above $23 keeps momentum intact.
Next liquidity target sits at $26.86, with potential extension toward $28+.
Downside:
A break below the trendline risks a drop back into the Fib zone ($21–20).
The 0.786 retrace at $18.09 remains the last line of support.
Stoch RSI shows overbought conditions, so short-term cooling may occur, but structure remains bullish while price holds trendline and EMAs.
📊 Key focus: Can LINK hold trendline support and build toward $26.8 liquidity, or will it revisit the Fib cluster first?
LINKUSDT.P trade ideas

LINK chailink target priceConsidering the very clear Elliott Wave structure, we draw a short-medium term target of 30 to reach the previous highs in May 2024. So, goodbye to fear and long, long, long. Good luck.

LINK/USDT Weekly FVG Tap
BINANCE:LINKUSDT has arrived right at a strong level that I see as a solid opportunity to enter.
This zone, together with the lower DCA area I highlighted as backup, looks like a prime region to build a spot position on LINK.
I’ll share another update if needed.


Scalp Setup — LINKUSDTHeads-up traders: LINK will likely steal stops 22.4–22.9. Let it. We act only after the grab + structure break. Calm hands get paid.
🔴 Scalp Setup — LINKUSDT
1) HTF/MTF Bias (12H/4H)
• Price ≈ 23.85.
• Trend: Uptrend; first clean pullback after a vertical leg, ranging 23.0–25.0.
• Sweep targets: below 23.00 → 22.80 / 22.60; above 24.30–24.60.
2) LTF Execution (15m)
• Confirmation: CHoCH/BOS up (change of character / break of structure) right after a sub-23 sweep — close beyond prior 15m lower high.
• OB/FVG: Enter on 50–100% fill of the FVG/OB created by the BOS leg; prefer OB body or 0.50–0.618 fib of the impulse.
• Liquidity: below 22.95 / 22.80 / 22.60, above 23.40 / 23.70 / 24.00.
• Volume/Delta: Sweep candle ≥ 1.5× 20-bar average or clear delta absorption in the 22s.
3) Derivatives
• OI: Stable-high; slight rises on dips.
• Funding: Near flat (no crowding).
• CVD: Attempting a higher low after a week-long drift.
• Resting liqs: 22.8 and 23.6–23.8.
4) Trade Map
• Bias: Long after downside sweep → BOS up.
• Sweep Zone: 22.4–22.9.
• Entry: 22.75–22.90 limit (refine to OB body / FVG 50–100% fill).
• Stop: 22.55 (beyond sweep wick / opposite OB edge by ~0.15× ATR-15m).
• TPs: 23.40, 23.70, 24.00 (opt).
• RR: From 22.82 mid-fill → TP1 ≈ 2.1:1, TP2 ≈ 3.3:1, TP3 ≈ 4.4:1.
• Trust Meter: A+ (88%).
👉 LINKUSDT = Scalp A.
Rotation
• Sector: Oracles (LINK).
• Narrative: Trend pullback with calm derivatives; watch sweep → reclaim → continuation.
⚔️ Candle Craft | Signal. Structure. Execution.

Link Long Yep, simple as that.
Long link from the identified area and target the liquidity above ⬆️.
Looks solid setup. Just stick to SL regardless of the outcome.
If SL hit, then my analysis was wrong and we can buy cheaper.
Confidence in this trade is 7 out of 10.


Chainlink (LINK): Looking For Explosive Bounce | BullishLINK is sitting right on top of the 200 EMA, a level that has historically triggered explosive moves. We’ve seen similar setups before where price consolidated around the EMAs, only to follow up with strong upside continuation.
As long as buyers defend this zone, the expectation remains for a bounce — with the next targets sitting at the local resistance levels around $28 and $30. A clean break and hold above here could unlock the next phase of bullish momentum.
Swallow Academy

Long trade
15min TF overview
📘 Trade Journal Entry
Pair & Session
Pair: LINKUSDT (Perpetual Futures)
Date: Sun 7th Sept – Mon 8th Sept 2025
Sessions Covered: LND → NY AM / PM
First Trade Idea (Sellside)
Direction: Sellside
Entry: 21.659
Target: 21.059 (-6.77%)
Stop: 22.841 (5.47%)
Risk–Reward: 2.92
Context:
Idea based on breaker block & discount zone
Stopped out at 22.240 (-1.52%) with RR 5.42
Price reclaimed liquidity and invalidated downside bias.
Second Trade Idea (Buyside)
Direction: Buyside
Entry: 22.547
Target: 23.821 (+5.65%)
Stop: 22.462 (-0.38%)
Risk–Reward: 14.99
Context:
Entered after price flipped order block (7th Sept breaker block)
Clean FVG entries aligned with VWAP reclaim
RSI supportive (64–68, showing strength)
Volume expansion confirmed a breakout.
Key Levels
VWAP: 23.611
EMA: 23.675
TWH (Intraday High): 23.821
TWL (Intraday Low): 22.238
Asia Range: 23.077 – 23.313
1D Candle P03: 23.000
Structural Notes 🧠
The first short attempt was invalidated by a bullish market structure shift.
Strong breaker block support formed on 7th Sept, later acting as a bullish launchpad.
Price expansion ran to TWH 23.821, exceeding ADR and respecting PD array premium zone.
Multiple FVGs along the way provided re-entry opportunities for continuation.

Short trade
15min TF Sell-side trade idea
Pair: LINK/USDT
Date: Sun 7th Sept 25
Time: 6.32pm
Session: London PM
Timeframe: 15m
🔹 Trade Details
Direction: Sell-Side Trade Idea
Entry: 22.865
Profit Target: 21.099 (–6.77%)
Stop Loss: 23.079 (+0.93%)
Risk-Reward Ratio (RR): 20.96
Target Zone:
Order Block
BSLQ Lows
Pivot S2 (21.044)
🔹 Technical Context
Market structure: Ranging between 22.3 – 23.2 with repeated liquidity sweeps.
Confluence factors:
30m breaker block rejection + Order Block alignment.
Fair Value Gap (FVG) confirming sell-side inefficiency.
EMA/WMA flattening, pointing toward distributive phase.
Stop placement: Above OB rejection at 23.079, guarding against false breaks.
Targeting: Aggressive downside run into BSLQ lows around 21.0–21.1.
🔹 Trade Narrative
This trade is designed as a liquidity raid short. After multiple failed pushes above 23.0, price confirmed weakness at breaker block resistance. The setup captures a high-probability move into deeper downside liquidity pools, with confluence from OB rejection, FVG imbalance, and structural range breakdown.

LINK/USDT 12h chart🔹 key levels
• Support (red lines):
• 21.73 USDT → First strong support (tested several times).
• 20.17 USDT → Another key support (potential descent, if the price drops below 21.7).
• 18.10 USDT → deeper support (larger pullback).
• resistance (green lines):
• 23.22 USDT → The price is currently testing this level.
• 24.14 USDT → strong resistance if you manage to break 23.2.
• 25.54 USDT → Higher resistance, last local peaks.
⸻
🔹 Trend
• We see an upward trend (orange trend), which was defended at around 21.7.
• The price is currently testing the top of the channel → If the candle closes above 23.2, possible movement towards 24.1 - 25.5.
⸻
🔹 oscillators
• Stoch RSI:
• strongly bought (blue and orange line high in zone 80).
• It may suggest short -term withdrawal if there is no breakdown.
• RSI classic:
• He bounced off the level ~ 40 and grows slightly.
• Still a lot of space to grow before entering the purchase zone (70+).
⸻
🔹 Scenarios
1. Bycza (Bullish):
• Breaking above 23.2 USDT and confirmation of this level as support → Target 24.1 and 25.5.
2. Bear (bearish):
• Rejection from 23.2 and Trendline fracture down → decrease to 21.7, and then even 20.1.
⸻
✅ Summary:
The link is now at an important moment - either it will break 23.2 and will go higher (24-25.5), or will reflect and return to around 21.7. The oscillators show that there may be a small correction short -term, but the medium -term trend still looks upwards.

BREAKING: Grayscale just filed for Chainlink $LINK ETF🚨BREAKING: Grayscale just filed for Chainlink CRYPTOCAP:LINK ETF with the SEC.
🟩20% + correction from previous monthly level Given
🟩Clean falling wedge & continuation pattern 📈
🟩Weekly ichimoku flipped bullish
🟩Long term uptrend keep supporting prices
🚀Next step: 30$+
Key support to be maintained for bull scenario:
20.00 - 19.50$

Link coin long to $23Just recently opened a long position on link. Aiming for $23
sl: 22.12
Roughly 2 RR

LINKUSDT BuyLooks like the Bullish Falling Wedge has broken upwards so we're hoping for a bullish move. Hopefully 🤞🏾😂

Link has a good entry today.enter if Link price is within ±2% of 22.40.
take profit at 27.70.
this is a swing trade, not a quick one. patience pays off.
nb: if price goes against you, hold or move it to a Smart Rebalance Bot until the market turns.
don't allocate more than 5% of your portfolio per trade.

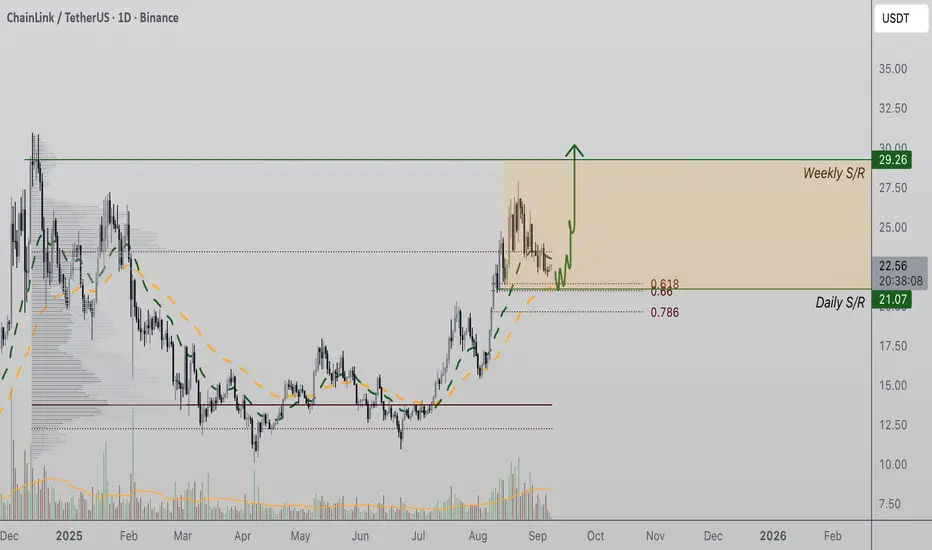
Chainlink Holds Key Support at $21, Eyes Bullish Rotation LINK price action has pulled back into a critical support region around $21, where the 0.618 Fibonacci retracement and strong moving averages align. This zone represents a decisive level for maintaining bullish market structure, with upside targets back toward $29 if volume confirms.
LINK Key Technical Points
- Support Test: $21 holds as a pivotal region supported by the 0.618 retracement and moving averages.
- Bullish Structure: Higher lows remain intact, keeping LINK’s overall trend constructive.
- Upside Target: Successful defense of $21 opens the path toward $29 resistance.
Analysis
The $21 level is emerging as a structural anchor for Chainlink. Its confluence with both the golden ratio retracement and long-term moving averages makes it a significant technical base. Defending this zone would reinforce bullish momentum by confirming another higher low in the broader trend.
The rejection from a swing failure pattern has introduced short-term pressure, but the broader structure remains bullish. Corrections into major support zones are common within trending markets and often precede renewed rallies once buying demand returns. As long as $21 holds on a closing basis, LINK maintains its bullish framework and the probability of rotation toward $29 remains high.
Volume will be the determining factor for continuation. Current activity shows price consolidating at support, but sustained bullish influxes are required to confirm a shift in momentum. A pickup in demand from this region would not only support a move back to $29 but could also reinforce the bullish narrative for higher time frames.
What to Expect in the Coming Price Action
As long as $21 holds, LINK remains positioned for continuation toward $29 resistance. A breakout above this level would signal strong bullish momentum, while failure to defend $21 risks deeper retracement.
Short trade
Pair: LINK/USDT
Date: Sun 7th Sept 25
Time: 6.32pm
Session: London PM
Timeframe: 15m
🔹 Trade Details
Direction: Sell-Side Trade Idea
Entry: 22.865
Profit Target: 21.099 (–6.77%)
Stop Loss: 23.079 (+0.93%)
Risk-Reward Ratio (RR): 20.96
Target Zone:
Order Block
BSLQ Lows
Pivot S2 (21.044)
🔹 Technical Context
Market structure: Ranging between 22.3 – 23.2 with repeated liquidity sweeps.
Confluence factors:
30m breaker block rejection + Order Block alignment.
Fair Value Gap (FVG) confirming sell-side inefficiency.
EMA/WMA flattening, pointing toward distributive phase.
Stop placement: Above OB rejection at 23.079, guarding against false breaks.
Targeting: Aggressive downside run into BSLQ lows around 21.0–21.1.
🔹 Trade Narrative
This trade is designed as a liquidity raid short. After multiple failed pushes above 23.0, price confirmed weakness at breaker block resistance. The setup captures a high-probability move into deeper downside liquidity pools, with confluence from OB rejection, FVG imbalance, and structural range breakdown.

what I will do with link “Waiting for a range breakout and reversal at 22.61 to target 23.74 for a 5% move, stop at 22.07, 2:1 ratio.”
Chainlink (LINK/USDT) AnalysisLINK is currently trading around $22.2.
According to the ascending channel structure, if the price pulls back to the channel support near $21.4, we could expect a potential bullish reaction from this level.
🎯 Possible upside targets in case of a rebound:
• $23.8
• $26
• $28
⚠️ However, if the $21.4 support fails to hold, a deeper correction toward $20 may occur.
LINK/USDT - SHORTI expect this decision to be implemented in about a month or two.
(This is not an investment recommendation).

LINK/USDT - Ready for Takeoff? Major Bullish Reversal in Play!🚀 Trade Setup Details:
🕯 #LINK/USDT 🔼 Buy | Long 🔼
⌛️ TimeFrame: 1D
--------------------
🛡 Risk Management (Example):
🛡 Based on $10,000 Balance
🛡 Loss-Limit: 1% (Conservative)
🛡 The Signal Margin: $534.47
--------------------
☄️ En1: 20.74 (Amount: $53.45)
☄️ En2: 19.34 (Amount: $187.06)
☄️ En3: 18.4 (Amount: $240.51)
☄️ En4: 17.51 (Amount: $53.45)
--------------------
☄️ If All Entries Are Activated, Then:
☄️ Average.En: 18.87 ($534.47)
--------------------
☑️ TP1: 24.56 (+30.15%) (RR:1.61)
☑️ TP2: 27.87 (+47.69%) (RR:2.55)
☑️ TP3: 32.73 (+73.45%) (RR:3.93)
☑️ TP4: 40.16 (+112.82%) (RR:6.03)
☑️ TP5: 50.34 (+166.77%) (RR:8.91)
☑️ TP6: Open 🔝
--------------------
❌ SL: 15.34 (-18.71%) (-$100)
--------------------
💯 Maximum.Lev: 3X
⌛️ Trading Type: Swing Trading
‼️ Signal Risk: 🙂 Low-Risk! 🙂
🔎 Technical Analysis Breakdown:
This technical analysis is based on Price Action and Smart Money Concepts. All entry points, Target Points, and the Stop Loss are calculated using professional mathematical calculations. As a result, you can have an optimal trade setup based on great risk management.
Technically, LINK is bouncing off key support levels and forming a solid accumulation structure, suggesting strong hands are preparing for a breakout. With multiple confluences aligning — including long-term trend support and bullish divergence — this setup favors patient swing entries with impressive risk-to-reward potential.
📊 Sentiment & Market Context:
Chainlink (LINK) is showing signs of renewed bullish strength following a consolidation phase and broader market resilience. The crypto market has recently seen improved sentiment amid increasing institutional involvement and growing anticipation around real-world asset tokenization — a core use case for Chainlink's oracle solutions.
🔎 About LINK:
Chainlink is a decentralized oracle network that enables smart contracts to securely interact with real-world data. It plays a critical role in DeFi, insurance, gaming, and more — bridging on-chain and off-chain systems. As adoption of decentralized infrastructure grows, LINK continues to position itself as a key infrastructure asset in the blockchain ecosystem
⚠️ Disclaimer:
Trading involves significant risk, and past performance does not guarantee future results. This analysis is for informational purposes only and should not be considered financial advice. Always conduct your research and trade responsibly.
💡 Stay Updated:
Like this technical analysis? Follow me for more in-depth insights, technical setups, and market updates. Let's trade smarter together!
