$LINK (DAILY): HIDDEN BEARISH RSI divergences persistMy last BIST:LINK update on Oct 25 played out pretty well. It was around $17.9 back then, fighting to hold the 200 MA sitting on top of the Golden Pocket.
Now at $15, and the $14.6 level I mentioned as one of two targets has been holding so far.
There have been 6 previous HIDDEN BEARISH divergences on the RSI — each one followed by a CRASH. I’ve marked the horizontal lines to show those rare but powerful hidden signals that almost never fail during broader market declines.
At this point, $14.6 remains the key SUPPORT to watch. If it breaks, the next stop is $12.6 — the 200 MA on the weekly chart.
I’m watching closely for another hidden bearish divergence to form at or near RESISTANCE on a LOWER HIGH. One more of these could offer a high-probability short entry.
Still, the OBV remains bullish, and that’s the only thing keeping me from fading this setup.
No shorts as long as CRYPTOCAP:BTC stays above $103K (the 1W 50 MA) — that’s my main market filter for now.
💙👽
Trade ideas


Hidden GapLINKUSDT - Short Setup | Hidden Gap & Order Flow Break
Timeframe: 15m
Exchange: Binance
Market Structure
Price has been following a bearish structure, forming consecutive lower highs (LH) and lower lows (LL). Recently, price created a minor pullback to a premium zone, tapping into an Order Block before resuming bearish momentum.
The market broke two significant floors (demand zones) — one representing Order Flow, and the other confirming a Hidden Gap imbalance — signaling strong bearish intent and liquidity sweep behavior.
Key Concepts in Play
MPL (Most Probable Liquidity): Two MPL points mark liquidity highs swept before the drop.
Hidden Gap: Acts as an imbalance zone left unmitigated — perfect entry confirmation once the price fills it and rejects.
Order Flow Break: The structure confirming sellers are in control.
Order Block (OB): The last bullish candle before a major bearish displacement. This is our short entry zone.
Trade Setup
Entry: 14.90 – 15.00 (inside Order Block / Hidden Gap zone)
Stop Loss: Above Order Block → ~15.20
Take Profit 1: 14.30 (previous structural low)
Take Profit 2: 14.00 (next liquidity zone)
Risk/Reward (approx): 1:3 – 1:4
Confluence Factors
✅ Break of structure confirming bearish order flow
✅ Mitigation of premium Order Block
✅ Hidden Gap fill and rejection
✅ Double floor break (liquidity cleared below)
✅ Continuation with overall bearish trend
Bearish Bias Summary
The market is maintaining a bearish order flow with a clear liquidity grab above the Order Block followed by aggressive selling pressure. As long as the price remains below 15.20, the bearish momentum is expected to continue.
Idea Summary:
Shorting from premium after a liquidity grab at the Order Block and Hidden Gap area. Looking for continuation toward new lows after confirming bearish order flow break.

LINK USDT LONG SIGNAL---
⚠️ Disclaimer:
This analysis reflects personal market observation and is not a buy or sell signal.
Always analyze the chart yourself and apply strict risk management before taking any trade.
📢 Signal Alert
🔹 Pair: LINK / USDT
📈 Trade Type: Long
💰 Entry Price: 14.774
🎯 Take-Profit Targets:
TP1 = 15.406
TP2 = 16.104
TP3 = 16.761
🛑 Stop-Loss: 14.375
📊 Timeframe: 1H
⚖️ Risk/Reward Ratio: 5.0
📌 Suggested Leverage: 5x–10x
🔄 After reaching TP1, move Stop-Loss to Entry to secure profits.
---
🧠 Technical Analysis Summary:
LINK is showing bullish momentum after bouncing from the support zone near $14.40–$14.50, which aligns with the trendline support and EMA50 on the 1-hour chart.
The pair has formed a higher low structure, suggesting continuation of the uptrend toward the next resistance at $15.40–$16.10.
The entry zone ($14.77) coincides with a demand area that has repeatedly rejected price decline, confirming strong buyer interest.
Momentum indicators (RSI > 50, MACD crossover) also support upward pressure.
Stop-loss ($14.37) is set below the last swing low, protecting capital while allowing natural volatility.
⚙️ Trade Management Tip:
Wait for a bullish confirmation candle close above $14.80 before entry.
Take partial profits at TP1 and trail stops to maximize gains as price approaches upper targets.
---

Chainlink (LINK) – SmartCon 2025 + Key Support TestLINK is in focus as SmartCon 2025 kicks off today, drawing attention to the broader Chainlink ecosystem. Historically, this event has sparked major announcements and partnerships, often impacting LINK price action. Traders are now watching for potential bullish catalysts during the event.
Technically, LINK is breaking down into a key support zone between $14.50 and $15.00. This zone has held in the past and could act as a launchpad for a reversal bounce, especially if event-driven sentiment kicks in. Failure to hold this zone opens the door to deeper retracements.
🛠️ Trade Setup (Idea Only):
Entry Zone: $14.50–$15.00
Take Profits: $20 / $22 / $25
Stop Loss: $13
Bias: Short-term bullish if support holds

LINKUSDT → A trap? Grabbing liquidity before the fall...BINANCE:LINKUSDT is forming a correction after a bearish run. A false breakdown of support is triggering a correction before a possible continuation of the decline.
The coin is testing the support of the trading range within the downtrend. The reaction to the false breakdown of support is a pullback to the zone of interest. After a strong downward distribution, a correction to the break-even zone is forming. A false breakout of resistance at 17.45 could trigger a continuation of the decline due to a weak market and a liquidity pool formed above 17.450, which is likely to stop the pullback on the bearish trend.
Resistance levels: 17.450
Support levels: 16.53, 15.77
The downtrend may continue. A retest of resistance may end in a fall and an update of the local minimum, as well as reaching the zone of interest at 15.77.
Best regards, R. Linda!

LINK – Calm Before the Storm?Chainlink is currently consolidating within a neutral accumulation range between $15.5–18.9, showing clear volatility compression on declining volume.
The chart structure combines a downtrend channel, Fibonacci retracement, and a projected volatility cone, all converging toward a potential breakout window around mid-November.
A daily close above FIB 0.236 could trigger the next wave toward $19.9; $21.9; $23.3. While on the other hand, losing $15.5 would likely send LINK back into a deeper correction.
RSI and EMAs are still neutral, so patience is key here.
Sibos conference (Nov 4–5) could be the catalyst that wakes the price up, especially if Chainlink or partners reveal new integrations or institutional news.
Right now, it’s all about patience — volatility is loading, and this looks like the calm before the storm.
Breakout > $18.9
Breakdown < $15.5

LINK USDT LONG SIGNAL ---
📢 Signal Alert
🔹 Pair: LINK / USDT
📈 Trade Type: Long
💰 Entry Zone: 17.188 – 17.496
🎯 Take-Profit Targets:
TP1 = 17.700
TP2 = 18.240
TP3 = 18.520
🛑 Stop-Loss: 17.000
📊 Timeframe: 1H
⚖️ Average Risk/Reward Ratio: ≈ 1 : 4
📌 Suggested Leverage: 10x
---
🧠 Technical Analysis Explanation
LINK is showing strong bullish continuation after defending the 17.0 support zone, which previously acted as a key demand area.
Price has formed a double bottom pattern with a higher low on shorter timeframes, signaling potential reversal strength.
The entry zone (17.188–17.496) aligns with the retest of a breakout area above EMA 50, while RSI shows a bullish divergence, supporting upward momentum.
Targets are placed near local resistance levels and Fibonacci extensions derived from the latest impulse wave.
The stop-loss at 17.0 protects against invalidation of the bullish setup.
---
⚙️ Trade Management Rule
After TP1 is reached, move Stop-Loss to Entry to secure capital.
Confirm entry only after a bullish candle close above 17.20.
Always apply strict risk management and avoid overleveraging.
---

LINK/USDT – Upside Target in Focus!Chainlink (LINK) is showing bullish momentum after rebounding from the 16.66 support zone.
If the price sustains above 17.57 the next potential targets are 18.37 📈

Lingrid | LINKUSDT Follow Through Pattern FormingBINANCE:LINKUSDT price action shows continued rejection from the descending trendline inside a well-defined downward channel. The structure remains bearish, with lower highs forming under resistance near $18.00. As long as this rejection holds, price could revisit the support area toward $15.00 before potential stabilization. Overall momentum aligns with a continuation of the broader downtrend.
⚠️ Risks:
Unexpected dovish shift in Fed tone boosting overall crypto sentiment
Strong BTC recovery above $120K improving altcoin structure
Short-term liquidity spikes causing false breakouts above $18.00
If this idea resonates with you or you have your own opinion, traders, hit the comments. I’m excited to read your thoughts!

LINK USDT SHORT SIGNAL ---
📢 Signal Alert
🔹 Pair: LINK / USDT
📉 Trade Type: Short
💰 Entry Zone: 17.65 – 18.256
🎯 Targets (Take Profits):
TP1 = 17.18
TP2 = 16.63
TP3 = 16.10
🛑 Stop-Loss: 19.10
📊 Timeframe: 1H
⚖️ Risk/Reward Ratio: 3.4
📌 Suggested Leverage: 5x – 10x
---
🧠 Technical Analysis Explanation
After several rejections near the $18.9 resistance, LINK shows clear signs of weakness.
Price action has formed lower highs within a short-term descending structure, signaling that sellers remain in control.
The RSI has turned below 50, confirming bearish momentum, and volume has increased during red candles — another sign of active selling pressure.
The entry zone (17.65–18.90) corresponds to a retest of the previous supply zone, offering a favorable short opportunity.
Targets are based on key support levels from previous swing lows and Fibonacci retracement zones.
The stop-loss at 19.10 is placed just above the previous swing high to protect against a fake breakout.
⚠️ Note: Always wait for a bearish confirmation candle or rejection wick near the entry zone before executing the trade. Proper risk management is essential.
-

LINK It has good growth potential in midtermWhat I see now is that the price could correct to the PRZ and then pump again, and currently, there is no specific bullish pattern in the chart. which could cause the price to drop below 13.5 dollars.
Best regards CobraVanguard.💚

LINK HOURLY TIMEFRAME UPDATE (ON DEMAND) ❤️ THIS POST AND I WILL SHARE NEXT pair
The Chainlink Network is driven by a large open-source community of data providers, node operators, smart contract developers, researchers, security auditors and more. The company focuses on ensuring that decentralized participation is guaranteed for all node operators and users looking to contribute to the network
ANY THOUGHTS ON CRYPTOCAP:LINK ?

Predicting Intraday CRASHES 10%+ w/ 5 Easy Steps1️⃣ Daily imbalance above has been rebalanced.
2️⃣ Price is rejecting from premium arrays (above equilibrium of the daily dealing range).
3️⃣ Intraday displacement (#4) aligns perfectly with that macro rejection.
4️⃣ Volume and spread expand on the breakdown — that’s real order-flow, not stop-hunts.
5️⃣ There’s untouched liquidity resting below the daily lows. That’s where the algorithm’s draw is.

LINK - BULLISHCRYPTOCAP:LINK - holding nicely! 📈
100$+ per tokens in 2026 still programmed!
Fundematals are too big. 💎

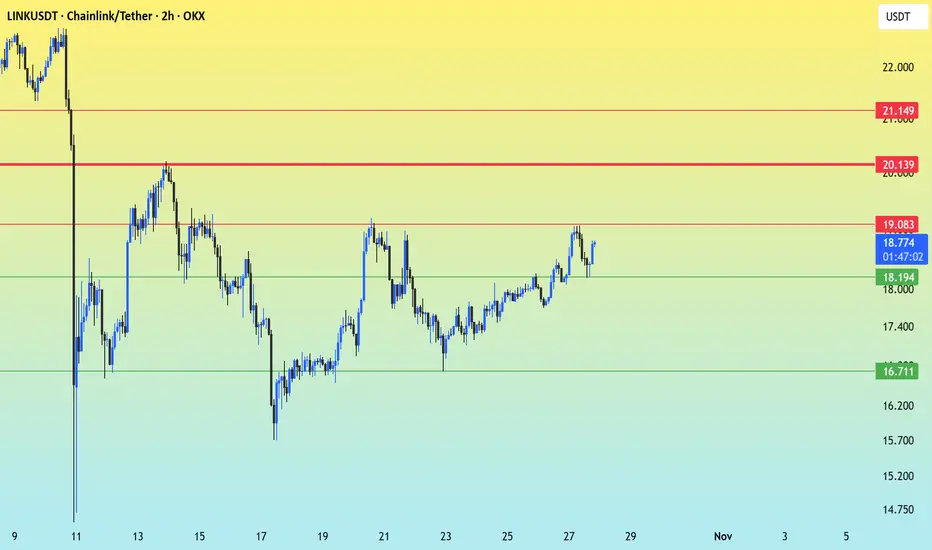
Chainlink at the Breaking Point: Is $19.08 the Gateway to $21.00LINK/USDT is in a recovery and consolidation phase after a sharp decline, currently testing the upper boundary of its range with increasing bullish pressure. Following a significant drop around October 9th-11th, the price has been in a horizontal channel, showing higher lows since the $14.75 low. It is now challenging the major ceiling around $19.08, signaling buyer control.
Support Levels:
- Immediate Support: $18.194 - Must hold to maintain momentum; break risks testing $16.711.
- Major Support: $16.711 - Strong consolidation floor; critical to defend to avoid deeper retracement.
Resistance Levels:
- Primary Resistance: $19.083 - Break and close above needed to exit consolidation.
- Major Target 1: $20.139 - First hurdle after breaking $19.083.
- Major Target 2: $21.149 - Final resistance before price drop.
Bullish Scenario: A breakout above $19.083 would confirm a new trend with targets at $20.139 and $21.149.
Neutral/Bearish Scenario: Failure to break $19.083 may lead to a return to the $18.194 support, with a drop below $16.711 indicating strong weakness.
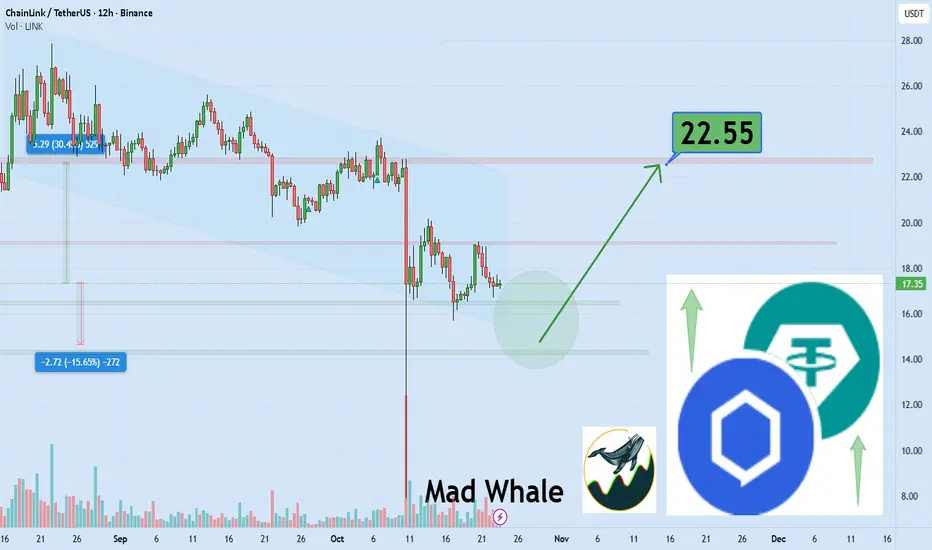
support area for link we can see upper level at least 30% gain Hi the support and resistances on the chart are based on the previous data and weekly candlesticks if BINANCE:LINKUSDT holds this last support the potential of 30% gain is logical toward 22.55$
$LINK (DAILY): GOLDEN POCKET support / 200 MA fightBIST:LINK on its WEEKLY chart: still a text-book BAT reversal intact, below the 50 MA, and just continuation to the downside. High selling volumes recently and essentially reverting back to its mean (200 MA on 1W at $12.8), although that's a long term chart.
We need a look on the DAILY to get a better idea if a reversal to the upside is an option soon.
1D chart is showing a fight to stay above a combo of crucial pivots:
1) 200 MA at $17.7, key moving average, for many traders, especially institutional: bear/bull boundary
2) horizontal support/former resistance $17.4
3) GOLDEN POCKET of the move that took the price from JUNE lows ($11) all the way up to the AUGUST top ($28).
OBV on the DAILY had two minor HIDDEN BULLISH divergences while the price was finding support in the pocket, that's interesting to see.
Holding the green 200 MA is the most important thing for now, no reversal yet, but if it was to remain a BULL MARKET asset, the BUYERS must step in immediately.
Close below the GOLDEN POCKET and we should see $14.6 and possibly $12.8 if that doesn't hold.
LONGS only above $19.5, I need to see a BULLISH market structure change to do anything here.
👽💙

LINK - BULLISH SCENARIO BIST:LINK - price analysis 🍿
Almost the same PA as $DOGE.
Very neutral area on the monthly, big volatility on both side. Really hard to trade & find a direction on the short term.
A Monthly close above 18.00$ would be good for bulls regarding the tails + Kijun level ichimoku.
Bullish consolidation likely if it hold above 15.80$ daily basis.
Local key support:
16.70 - 16.55$ - 15.70$
Price seems to be moving inside this downtrend channel ; but 👇
Possible bullish setup: $
A breakout of downtrend would surely lead to a push toward 20.00$ or even 22.80$ to fill the gap! 📈
Weekly resistance: 19.55 - 20.50 -
Also, I Hope that's not a bearish H&S pattern (3rd chart) with a neckline around 20.00 - 20.30$, otherwise, big bearish move could happen. 👀

LINKUSDT 1D#LINK is moving inside a symmetrical triangle on the daily chart, and there is a bullish divergence on the RSI. It is currently facing the daily SMA200. In case of a breakout above it, the potential targets are:
🎯 $19.01
🎯 $20.50
🎯 $21.70
🎯 $22.90
🎯 $24.61
🎯 $26.79
⚠️ Always remember to use a tight stop-loss and maintain proper risk management.

Chainlink (LINK): Looking For Breakout From 200EMA | BullishLINK is showing a nice recovery setup, where buyers are trying to take control after defending the recent drop. Price is still sitting below the EMAs, so for now, we’re waiting for a proper breakout — that’s the confirmation needed for continuation.
Once we see that breakout and reclaim of the EMAs, we can expect momentum to pick up quickly, targeting the $27–28 zone next.
Swallow Academy

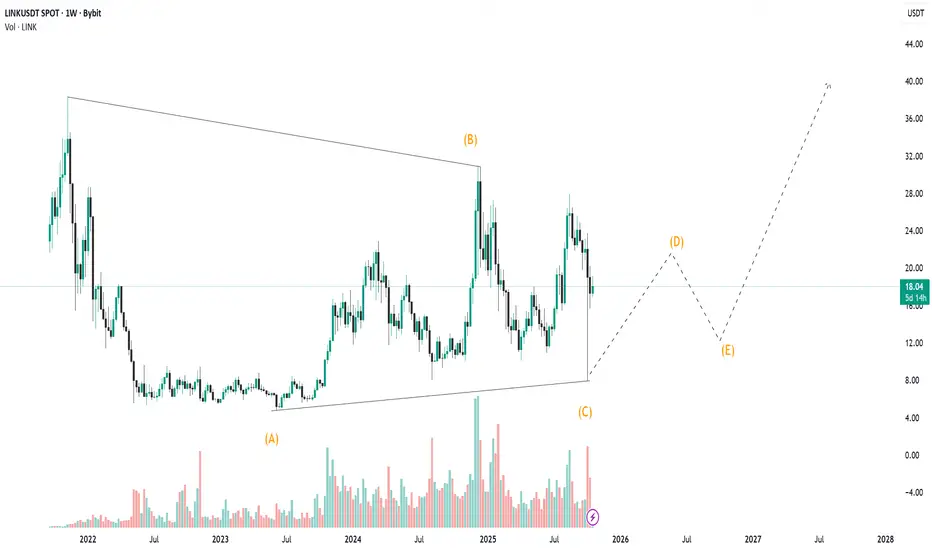
LINK Spot LONG LINK Spot LONG📈
Due to the formation of a zigzag structure, I am more inclined to form a triangle and further exit from it upwards. I no longer consider it as an impulse.
Expectations have not changed, I plan to start recording after updating the global maximum of 53.00. Only the time of the scenario implementation has changed, which may take a long time.
All altcoins with potential show approximately the same picture, which is encouraging. This structure provides the most accurate goals for profit-taking and scenario cancellation.
Lingrid | LINKUSDT Bearish Continuation Short OpportunityBINANCE:LINKUSDT has been moving inside a well-defined downward channel, consistently forming lower highs and lower lows in line with bearish structure. The recent rejection from the downward trendline confirms continued pressure from sellers near $18.50 resistance. Unless price breaks and sustains above this area, the broader momentum favors a move toward the $15.00 support level. Current structure implies that each rally attempt remains corrective within a larger downtrend.
⚠️ Risks:
A sudden BTC recovery could invalidate the bearish setup.
Failure to hold below $18.50 may trigger a short squeeze.
Softer macro sentiment or lower volatility could delay breakdown momentum.
If this idea resonates with you or you have your own opinion, traders, hit the comments. I’m excited to read your thoughts!
