CHAINLINK October Trade PlanWe're approaching what could possibly be the last 2-4 weeks of the 4y cycle (October 17th - derived as 546 days from Halving to Top in prior two cycles). This time might be different, but this trade plan assumes the timing remains valid - until proven otherwise.
Throughout this cycle LINK has been responsive to HTF rejections from 3W order blocks and the 0.786 / 0.705 Fib Area (in March'24, and December '24), as shown.
When we extend a connecting trend line between these two pico tops, there is confluence with another 3W order block, the 0.705 / 0.786 area again AND our suggested cycle top date. This gives a Price Target and potential Short entry from $38-$42.
In the immediate short term, on the Long side, I'm looking for price to reach an 18H HOB at around $19.11 / 0.705 Fib, at the lower end of MTF channel trend support. There is an additional high probability support area (2D OB) at $17.91 for a potential lower entry.
Summary:
LONG from $19.11 (add at $17.91), Targets above $38
SHORT (Hedge or Isolated) from $38.77, Targets below $16
Trade ideas

LINK USDTLink Currency Analysis
We are now in wave 3 and you can make good profits until the end of the period
No analysis is 100%

LINK/USDT: Stabilizing Above Trendline with Breakout Setup FormiLINK/USDT is holding above the 22.00 upward trendline after forming a bottom near 20.00 support. The recovery structure points to bullish continuation, with price emerging from a range consolidation.
As long as 22.00 holds, the next target lies near 25.50, with momentum building for a potential breakout toward the 27.50 resistance zone. Current price action suggests accumulation ahead of a possible upside move.
Lingrid | LINKUSDT Market Structure Break Long OpportunityBINANCE:LINKUSDT is stabilizing above the 22.00 upward trendline after forming a bottom near 20.00 support. Price action shows a clear recovery structure following a range consolidation, with the projection suggesting a move toward 25.50. As long as 22.00 holds, bullish continuation remains likely within the upward trend. Momentum context implies accumulation before a potential breakout into the resistance zone around 27.50.
⚠️ Risks:
A close below 22.00 may trigger another test of the 19.80 support.
Weakness in broader altcoin sentiment could limit upside.
Sudden Bitcoin volatility might distort the setup’s bullish structure.
If this idea resonates with you or you have your own opinion, traders, hit the comments. I’m excited to read your thoughts!

LINK: Bullish Setup in ProgressLINK: Bullish Setup in Progress
LINK continues to move in a strong uptrend after breaking out from the recent falling wedge pattern. The breakout shows renewed bullish momentum.
As long as the price stays above the breakout area, LINK could continue pushing higher toward the next resistance zones.
🎯 Targets:
$24.80
$27.50
Overall, the structure remains bullish while LINK trades above $22.50.
At the moment, Alcoin's movements are also supported by BTC, which created a new historical record level signaling further growth.
You may find more details in the chart!
Thank you and Good Luck!
❤️PS: Please support with a like or comment if you find this analysis useful for your trading day❤️

Long LINKLink has just broken the resistance trendline of a descendant channel.
A Long setup is as in chart.
Disclaimer:
This analysis is based on my personnal views and is not a financial advice. Risk is under your control.

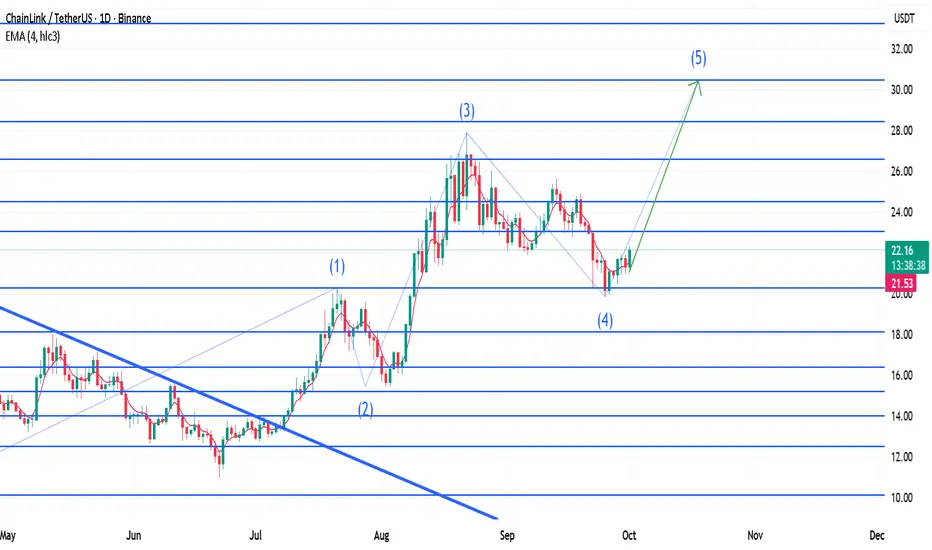
Link UPDATE (1D)LINK is about to complete its accumulation phase. On the daily chart, it’s breaking out of a clearly visible bull flag pattern, and according to Elliott Wave Theory, the 5th wave is now beginning.
If LINK manages to hold above $20, it could be on its way toward a target zone between $34 and $35.

LINK Update📊 LINK Update
LINK has formed a bullish double bottom pattern and successfully reached the first target ✅
Now we’re waiting for the second target at the green line level 🚀

Link short to $21.69 before EODWent short on Link
sl: 22.25
Tp: 21.69
Time sensitive. Anticipating more selling pressure next 2 hrs

LINK 1H – Sitting on a Cluster of SupportLINK 1H – Sitting on a Cluster of Support
LINK on the 1H looks quite similar to ETH, but with one key difference: the 200MA is much closer.
Price is now testing a tight cluster of support, where multiple technical factors align. If this area holds, LINK could rebound with strength.
However, if it breaks down, the 0.618 Fib sits below as the next potential shelter for price.
The next few candles will likely decide if bulls can defend this zone or if another leg lower is needed.
Key notes:
200MA nearby, acting as dynamic support
Local cluster of support being tested
0.618 Fib as next confluence level
Short-term structure mirrors ETH
Bias:
Neutral-bullish — holding this zone keeps the uptrend intact, but losing it could invite deeper retracement.
Always take profits and manage risk.
Interaction is welcome.

LINK Swing Long Idea - KZMT ModelLINK Swing Long Idea
📊 Market Sentiment
FED has resumed its rate-cutting cycle, starting with a 0.25% cut in September, with two more expected. Institutional liquidity inflows have accelerated as the U.S. officially adopts crypto as part of its reserves. Despite elevated inflation, a weakening labor market is forcing the FED to ease, pushing more capital into risk-on assets.
📈 Technical Analysis
Price is in a higher time frame (HTF) bullish trend, so I will only be looking for longs.
Price broke the HTF Key Zone and closed above, then retested and rejected from it — confirming the zone as demand.
Price also deviated and tapped back into the HTF bullish trendline, confirming trapped short-sellers and reinforcing bullish momentum.
📘 Model to be used – HTF Key Zone w/ HTF Manipulated Trendline (KZMT)
This model first identifies the HTF trend and only trades in that direction. Next, I locate key zones that support price. Finally, I look for a manipulated HTF trendline that aligns with those zones. When both confluences overlap, conviction for a strong bullish reaction increases.
📌 Game Plan
1)Price to revisit HTF Key Zone.
2)Retest of the HTF bullish trendline.
🎯 Setup Trigger
Limit entry at 22$
📋 Trade Management
Stoploss: Daily close below HTF Key Zone or hard stop at $19.5
Targets: TP1 = $25 | TP2 = $28
💬 Like, follow, and comment if this breakdown supports your trading! More setups and market insights coming soon — stay connected!
⚠️ Disclaimer: This content is for informational and educational purposes only and does not constitute financial, investment, or trading advice. Always DYOR before making any financial decisions.

LINK LONG 4HR lows taken out ,
Anticipating a reversal to reclaim support and trade higher ,
stop:21.7
entry :22.00
targets :3 tps as shown in chart

LINK - PERFECT SETUPWizzard TA on BIST:LINK
21.90$ retest - Accuracy: 100%
TP4 if I posted :)
Let's go!

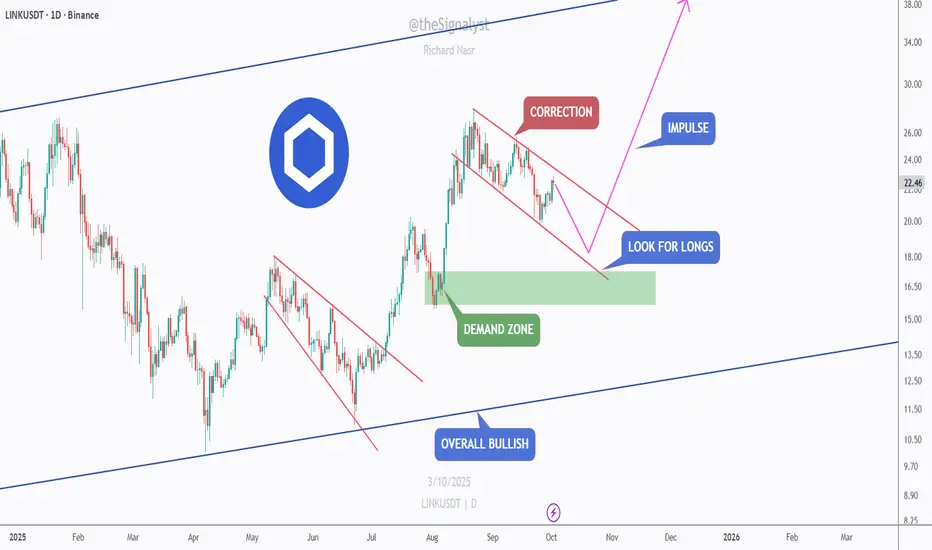
LINK — Bullish Structure, Corrective Dip into Demand!LINK remains overall bullish on the higher timeframe. Price is pulling back inside a descending channel (correction) after August’s impulse and is approaching a daily demand zone around $17–$18.5.
Scenarios:
Bullish 📈 Hold $17–$18.5 and/or break & close above $22.5–$23.5 → momentum toward $26, then $30+ if trend accelerates.
Bearish 📉 Daily close below $17 would weaken the structure and risk a deeper retrace before bulls try again.
Plan:
Look for confirmation at demand (higher low / bullish candle) or trade the break–retest above the channel for momentum entry.
⚠️ Disclaimer: This is not financial advice. Always do your own research and manage risk properly.
📚 Stick to your trading plan regarding entries, risk, and management.
Good luck! 🍀
All Strategies Are Good; If Managed Properly!
~Richard Nasr
LINKUSDT 12H1. Trend Structure
The price is in a descending channel (marked in orange) – the upper line acts as resistance, the lower line as support.
Currently, the price has rebounded from the lower boundary and is approaching the middle resistance levels.
2. Key Levels
Support:
21.73 USDT (the closest local support – already broken upwards, now being retested).
20.17 USDT (stronger support that previously halted the decline).
18.10 USDT (bottom of the channel – the main defense for the bulls).
Resistance:
23.22 USDT (local resistance, the price is very close to this level).
24.14 USDT (important horizontal resistance).
25.54 USDT (key level, a breakout of which could negate the descending channel).
3. Indicators (Stoch RSI)
The Stoch RSI is in the overbought zone (>80).
This suggests that upward momentum is slowly fading and a correction or consolidation near resistance levels (23–24 USDT) is possible.
4. Scenarios
Bullish:
If the price breaks and holds above 23.22 USDT, the next target will be 24.14 USDT, followed by 25.54 USDT (the upper boundary of the channel).
A break above 25.54 USDT could signal the end of the downward channel and a transition to a sideways/upward trend.
Bearish:
If the price rejects the 23.22 level and the Stoch RSI begins to decline, we could return to 21.73 USDT.
Losing this level will reopen the road towards 20.17 USDT and even test the lower limit of the channel (around 18-19 USDT).

LINK/USDT: Daily Breakout to 50?BINANCE:LINKUSDT is gearing up for a bullish breakout on the daily chart , with an entry zone in the red box between 15-20 near a critical support and consolidation zone.
The target range of 38-50 aligns with the next major resistance, signaling strong upside potential. Set a stop loss at 15 on a daily close below to manage risk effectively.
A break above 22 with solid volume could ignite this move, driven by network upgrades and altcoin momentum. Watch market trends! 💡
📝 Trade Plan:
✅ Entry Zone: 15 – 20 (red support & consolidation box)
❌ Stop Loss: Daily close below 15 to manage risk
🎯 Target Zone: 38 – 50 (next major resistance area)
NOTE: This set up is only for spot trading .
Ready for this lift-off? Drop your take below! 👇

LINK BULLISH outlook Link Breaks 1hr resistance , that is a good Bullish signal to go long targeting daily order block

Chainlink 5th wave target 30,4$ then crashIN my view chainlink is drawing last 5th wave of the bulilsh cycle targeting 30,4$ where I expect bearish inversione and the beginning of the bear cycle
CHAINLINK (LINKUSDT) IN AFAVOURABLE ZONE TO BUYThe project Chain link is in the favorable zone to make entries but since the ALTs season has not yet started so build the positions gradually. The CMP is the FIB level 0.618 which is a good level for DCA as well.
So build your entries and wait for the ALT season to ride .......
What are your views on this ??????

LINK
📊 **Setup LINK/USDT (15m)**
🟢 **Entry Zone (Demand QML):**
≈ 21.043 – 21.048
🔻 **Stop Loss (SL):**
20.777
🎯 **Take Profit (TP):**
* TP1 👉 21.263
* TP2 👉 21.545
* TP Max 🚀👉 21.879

TradeCityPro | LINK Coin Testing Key Resistance👋 Welcome to TradeCity Pro!
In this analysis, I'll be reviewing the LINK coin. It’s one of the popular RWA crypto projects with a market cap of 14.56 billion dollars, ranked 13th on CoinMarketCap.
⏳ 1-Hour Timeframe
In the 1-hour timeframe, after a downward movement, this coin has formed a large range box with the upper boundary at $22 and the lower boundary at $20.02.
📊 Currently, after getting support at the lower boundary of the box, the price has moved upwards in two legs toward the $22 level and has now reached it.
🧩 The price has reacted to this level before, and it has significant strength. It can be viewed as a Maker Seller zone.
✨ We can confirm the bullish trend of LINK after breaking this level. Before breaking this level, opening a position is risky, and if we want to open a position, we need to pay close attention to risk and capital management.
✅ In the upward movement towards the top of the box, a divergence has formed in the RSI. We can confirm this divergence activation by breaking the 40.91 level in the RSI. For the price itself, we can confirm a bearish trend by stabilizing below 21.25.
📉 For a short scalp position, we can enter with the break of 21.25. But be cautious, as this position is very risky, and if you open it, make sure to take profit with low-risk-to-reward ratios because the market momentum is not fully in our favor, and the chance of volatile fluctuations is high.
🔔 For a long position, the best trigger is the breakout of the top of the box. If the price touches this level multiple times, we can find an accurate trigger for the breakout, and in subsequent touches, we can enter with the breakout.
📝 Final Thoughts
Stay calm, trade wisely, and let's capture the market's best opportunities!
This analysis reflects our opinions and is not financial advice.
Share your thoughts in the comments, and don’t forget to share this analysis with your friends! ❤️

Long trade
Pair: LINKUSDT Perpetual
Trade Type: Buy-side trade
Date: Fri, 26th Sept 2025
Time: 9:00 am
Session: London to NY Session AM
Trade Details
Entry: 20.234
Profit Level (TP): 22.907 (+12.83%)
Stop Level (SL): 20.234 → 20.139 (-1.20%)
Risk-to-Reward (RR): 10.72
Market Structure & Context
Trend: Price recently pulled back into demand after a strong markdown. Current structure suggests accumulation before expansion.
Support Zone: 20.1–20.3 (Inflection point + consolidation base).
Breaker Block: 21.36–21.40 (first resistance to test).
Target Supply: 22.4–22.9 zone (aligned with FVG + previous OB).
Volume: Spike at inflection point suggests absorption of sell pressure and transition into demand.
Narrative (Wyckoff / SMC)
Accumulation: Price consolidated within 20.1–20.3 after a liquidity sweep of prior lows (19.83).
Inflection Point: Entry triggered post-consolidation breakout, aligning with early markup phase.
Liquidity Draw: Next upside target is the cluster of FVGs + Order Block near 22.9, which aligns with TP. Stop Placement: Below consolidation low at 20.13 to protect against false break.
Key Levels
Entry Zone: 20.23–20.24
Stop: 20.13
Intermediate Targets: 21.36 / 21.90
Final Target: 22.90
Action Plan
Monitor 21.36 breaker block as first reaction level.
Take partials at 21.90.
Hold remainder toward 22.90 liquidity pool.

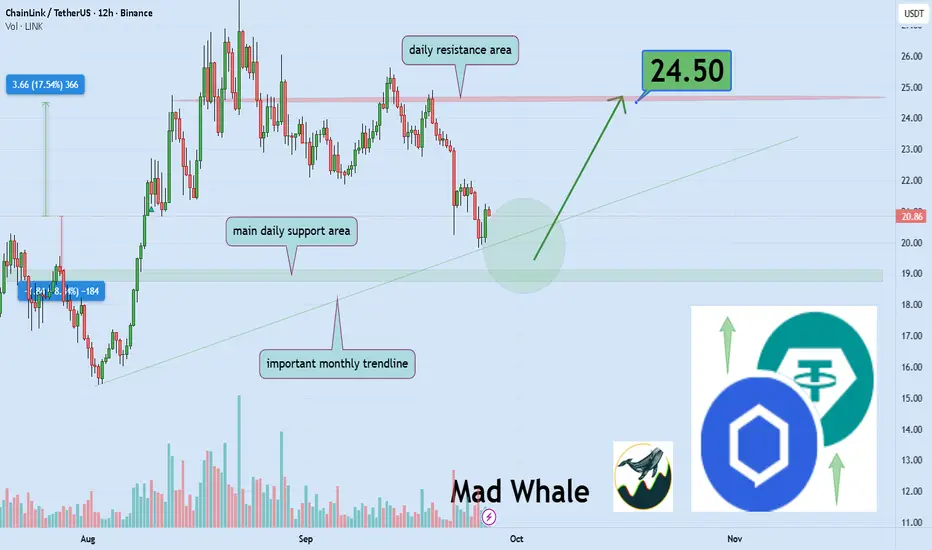
Is Chainlink ready for a potential 17% upside move? toward $24.5Hello✌️
Let’s analyze Chainlink’s price action both technically and fundamentally 📈.
🔍Fundamental analysis:
Deutsche Börse’s Crypto Finance is using Chainlink PoR to audit $17B in reserves.
This boosts LINK’s role in tokenization and could raise demand for the token.
📊Technical analysis:
BINANCE:LINKUSDT is testing a critical daily support along a strong trendline; if this level holds, a potential 17% upside toward $24.5 could unfold. 📈🚀
📈Using My Analysis to Open Your Position:
You can use my fundamental and technical insights along with the chart. The red and green arrows on the left help you set entry, take-profit, and stop-loss levels, serving as clear signals for your trades.⚡️ Also, please review the TradingView disclaimer carefully.🛡
✨We put love into every post!
Your support inspires us 💛 Drop a comment we’d love to hear from you! Thanks, Mad Whale