LINK LONG1D Technical Analysis for CRYPTOCAP:LINK Surrounding Supply Zone and 4H Demand Confirmation
On the daily chart, CRYPTOCAP:LINK is currently testing a key supply zone around $25 to $26, where sellers have historically stepped in to limit upside price moves. This zone acts as a significant overhead resistance level, creating a challenge for bulls to maintain momentum beyond it.
Recently, CRYPTOCAP:LINK price action confirmed strong buying interest after tapping the 4-hour demand zone, indicated by back-to-back bullish 4H candles. This demand zone provided a critical short-term floor that has supported a bounce and recovery wave.
The confirmation at the 4H demand zone adds confidence to bulls' attempts to push through the nearby daily supply zone, suggesting a growing battle of power between buyers reclaiming control and sellers defending the resistance.
Momentum indicators on the daily timeframe show positive signs: the RSI hovers above neutral 50, Bollinger Bands contract signaling potential volatility expansion, and moving averages are aligned bullishly with a recent golden cross event.
Volume surges during recent rebounds further validate the buying strength that emerged after the 4H demand was respected, hinting at possible continuation toward the next resistance targets near $27–$30 if bulls sustain above supply.
Trade ideas

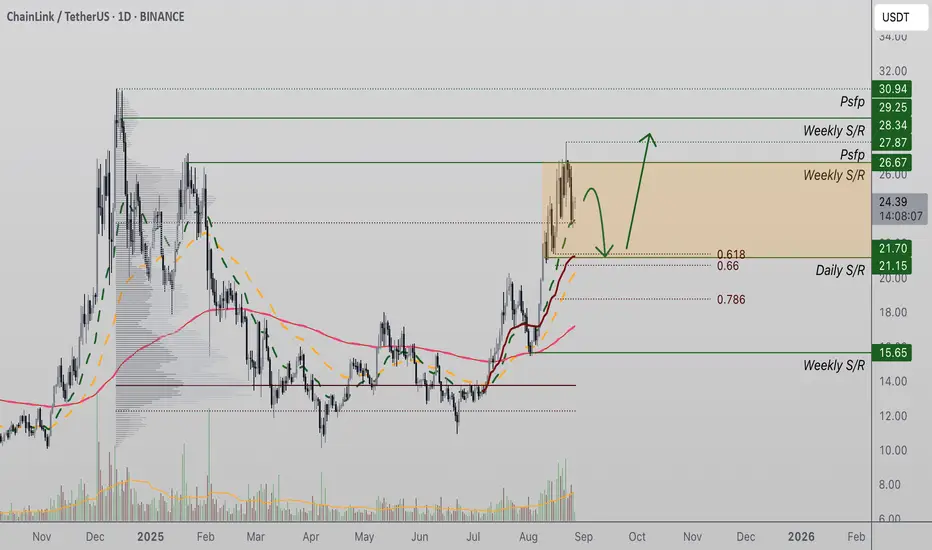
Chainlink Rejected at $26 but Support at $21.15 Holds Chainlink (LINK) has faced rejection from the $26 high time frame resistance after forming a bearish engulfing candle. Price now eyes the $21.15 support level, which is reinforced by strong technical confluence.
LINK’s recent rejection at $26 has temporarily slowed bullish momentum, with price retracing from its high time frame resistance. However, a key support zone is emerging at $21.15, a level backed by multiple technical indicators. If buyers defend this level during a retest, LINK’s bullish structure will remain intact, and a rotation toward higher objectives becomes highly probable.
Key Technical Points:
- Rejection at $26: Price was capped by high time frame resistance, leading to a bearish engulfing candle.
- Critical Support at $21.15: Confluent with the 50-day moving average and 0.618 Fibonacci retracement.
- Next Target $28.34: A confirmed bullish retest could open the path to this high time frame resistance.
LINK’s reaction at $26 highlights the importance of this resistance zone. The bearish engulfing pattern that formed here suggests profit-taking and the presence of sellers, leading to a retest of the value area high. Despite this rejection, the retracement appears orderly, with price action respecting key structural elements that still support a bullish outlook.
The $21.15 level now stands as the critical line in the sand. This zone is not only a horizontal support but also aligns with the 50-day moving average and the 0.618 Fibonacci retracement. Such a confluence often serves as a strong foundation for reversals or trend continuation. If LINK revisits this level and demand emerges, it would confirm the presence of buyers and validate the ongoing bullish structure.
Market structure remains favorable as long as higher lows are respected. Even after the rejection, LINK has not broken below key structural supports, meaning that the overall trend bias remains intact. A successful retest of $21.15 would reestablish bullish confidence and allow for continuation toward the next resistance target at $28.34. Without a breakdown, the broader market narrative still leans toward continuation higher.
What to Expect in the Coming Price Action:
If LINK holds $21.15 during a retest, bullish continuation becomes the most probable outcome, with $28.34 serving as the next upside target. However, a failure to maintain this support could weaken the structure and open the door to deeper corrective moves before any renewed upside momentum develops.
LINK: Bearish Setup: Rising Wedge BreakdownLINK: Bearish Setup: Rising Wedge Breakdown
This setup favors short positions or caution for long trades. The breakdown below the wedge provides a clear change in trend. If LINK fails to invalidate this pattern quickly, the path toward $17 looks increasingly probable.
LINK has already broken below the wedge, which confirms the bearish bias.
This breakdown suggests sellers are gaining control, and a deeper move is likely.
Target 1: $23.00
Target 2: $21.50
Target 3: $19
Target 4: $17
You may find more details in the chart!
Thank you and Good Luck!
PS: Please support with a like or comment if you find this analysis useful for your trading day

LINK 4H – Reaction at FVG, Reclaim or Deeper Pullback?Chainlink is reacting inside the Fair Value Gap while retesting the 0.5 Fib level.
Bullish path: A reclaim through the order block could send price back toward liquidity at 26.87.
Bearish path: Rejection here risks continuation lower, with retracement targets at 23.53 and 22.37, before testing the broader support zone.
Stoch RSI adds confluence to the decision — watch for momentum shifts around this reaction point.

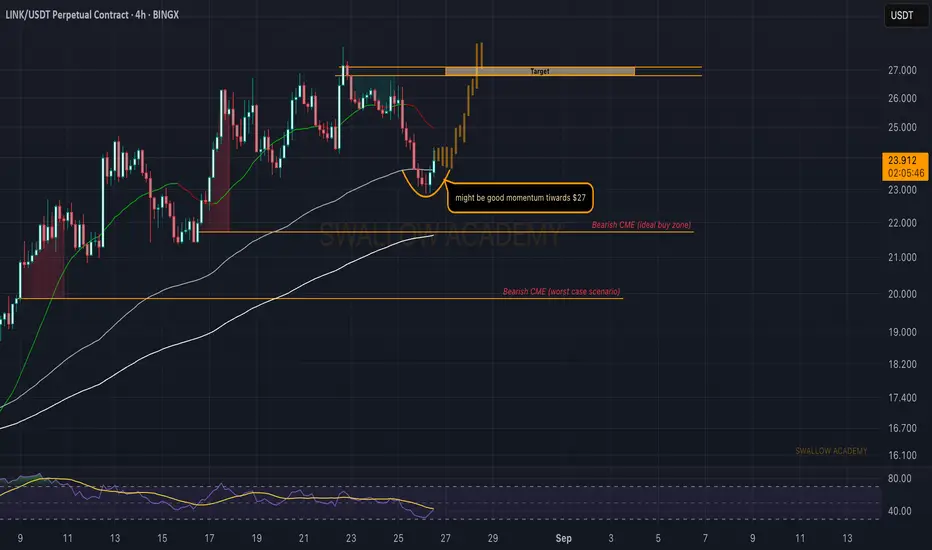
Chainlink (LINK): Possible Movement To $27.0 Chainlink has had a good BOS on smaller timeframes, where buyers took back control over the 100 EMA (4h timeframe) and now we might see the start of a trend reversal that will lead the price to the $27 area.
What concerns us here is the 2 bearish CME gaps, where one of them is sitting at 200 EMA (which would be an ideal buy entry on its own). So we keep an eye on them just in case sellers decide to pressure more and buyers lose control; then 200 EMA would be our next buy area.
Swallow Academy
LINK/USDT Price Prediction -1DTrend Prediction - LINK/USDT Analysis
A Harmonic Pattern is visible on the chart at key support and resistance levels!
**** Yousef Sharafi ****
Follow me here for more analysis

LINKUSDT SETUP.LINKUSDT | 1H Bullish Setup
📌 Key Structure Update
Price broke previous highs with a strong impulse and is now retracing. A clean OB + FVG = POI is marked around 24.5 – 24.7.
📍 POI Level
Demand zone + FVG overlap (confluence zone).
📝 Trade Plan
Wait for confirmation at POI before entry. Potential bullish reaction expected if price respects the demand zone.
🎯 Targets
TP1: 26.0
TP2: 27.0
❌ Invalidation
Setup invalid if price closes below 24.3.

LINKI think LINKUSDT move up
in touch order block in 1H
yellow Line is risk free position (SL = Entry)

A Potential Long for $LINKUSDTP. After series of bullish move, with a healthy pullback, we have currently tested the H4 order lock, with a bullish flag insight, but to increase our RR, we will be taking our entry at the H1 order block. Hopefully price doesn't leave us behind.
EN: 24.670
TP1: 26.560
SL:24.110
Goodluck🎉🎉🎉🚀🚀

LINK 5D – Testing Upper Liquidity, Retrace or Breakout?Chainlink has rallied aggressively into a key upper liquidity zone around $26.76, a level that previously triggered sharp reversals. Price is now pressing into this resistance while the Stoch RSI sits in extreme overbought territory, suggesting buyers may be stretched.
On the downside, the next major demand block sits around $15.50–18.00, aligned with the prior accumulation range and long-term support. A pullback into this zone would keep the broader uptrend intact and potentially offer a higher-low entry.
On the bullish side, a clean break and weekly close above $26.76 opens the door toward $32–36, which aligns with prior distribution levels.
Key levels to watch:
Resistance: $26.76 (liquidity sweep zone)
Support: $18.00–15.50 (demand block)
Long-term support: $13.00–14.00
This is a pivotal spot for LINK — either a liquidity-driven rejection back into support, or a breakout that confirms continuation into higher range targets.

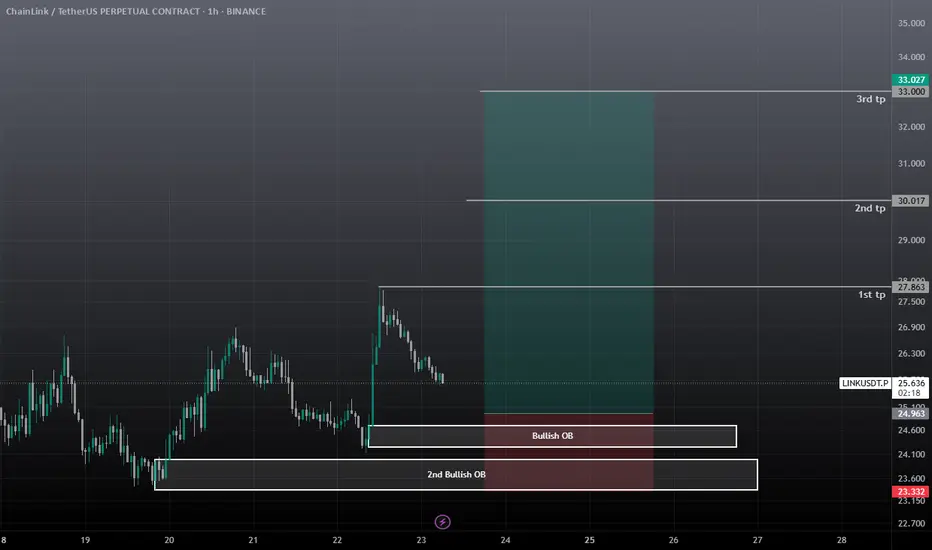
Link Long / Buy SetupLink has two Bullish OB, if first failed, 2nd OB will push the price, ETH bulish, link is also Bullish then. Use low risk as the pump was from an event so it can be a fakeout.
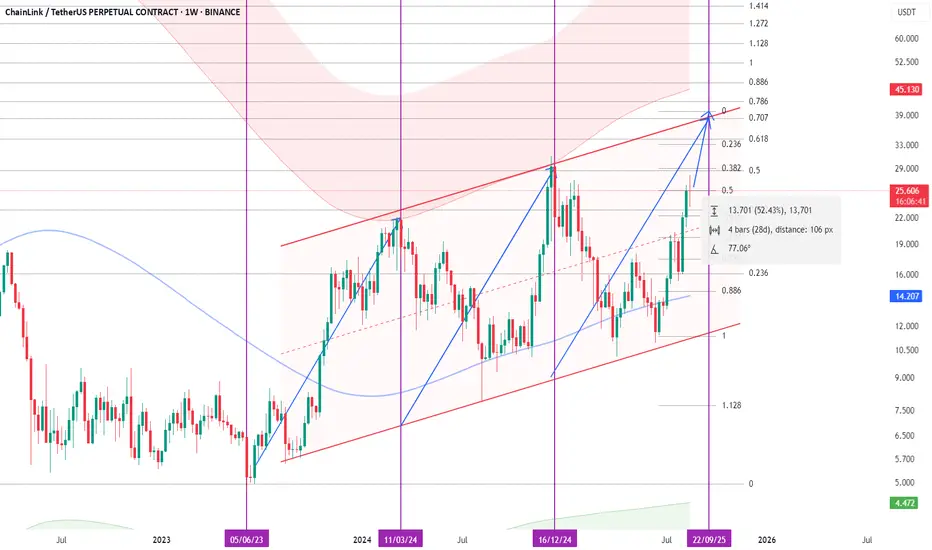
LINK: Growth to continue, but a peak is in sightChainLINK has shown spectecular growth outpacing its underlying ETH token by over 17% since 01-08-2025. Greed compels to join the frenzy. And you might as the potential has not been exhausted. Yet about 50% to go up before it hits a terminal resistance og $39-40 (here's on a log scale). A weekly Doji signals market's indecision after the ending diagonal forming from 15-08-2025. A correction to $22.5 should provide a good entry point to re-join the upward ascent.

LINK Update Mega pump caught in 4KLink we caught the bottom it was beautiful entry pumped 17 percent and I believe it has more fuel to reach 28 30 zone
Enjoy

Link | 6hrs | Short | Target: 21.40This technical analysis is for informational and educational purposes only. It does not constitute financial advice. Remember to always research and consult with a professional before making investment decisions. Good luck! 📈💼🚀

ATH coming for LINK?!LINK has been in existence since the 2017 cycle and is also part of the OG cryptos. I expect to see a new ATH as LINK rises in dominance especially during the 'utility' alt coin run with stable coins and oracles being a key narrative for Chainlink.
LINK.D is currently at c. 0.45% of the total crypto market. I expect this to surge to 1.5-2% of the crypto market when LINK is to top out in its cycle. Moonshots would be anything above 2%.
Key Targets for Take Profits:
1. $67-80
2. $110-128
3. $195-210 (Moonshot)

Chainlink Wave Analysis – 22 August 2025- Chainlink reversed from the resistance area
- Likely to fall to support level 23.30
Chainlink cryptocurrency recently reversed down from the resistance area between the multi-month resistance level 26.00 (which has been reversing the price from end of 2024) and the upper daily Bollinger Band.
The downward reversal from this resistance area created the daily Japanese candlesticks reversal pattern Bearish Engulfing.
Given the strength of the resistance level 26.00 and the overbought daily Stochastic, Chainlink cryptocurrency can be expected to fall to the next support level 23.30.

LINK LONG set upLINK has pulled back into a key demand zone (24.1–24.5) which also aligns with the ascending trendline support from mid-August. This confluence provides a strong technical base for a potential bounce.
Setup details:
✅ Entry: Demand zone retest + trendline support
✅ Stop-loss: Just below demand (~24.0)
✅ Target: Previous resistance zone around 26
✅ R:R: 1:1.5
Reasoning:
Structure is still bullish with higher lows intact.
Price consolidating at demand, looking for signs of strength.
Risk is defined — invalidation below demand zone.
⚠️ If demand breaks with volume, setup becomes invalid. Otherwise, looking for a clean move back toward 26.3 resistance.

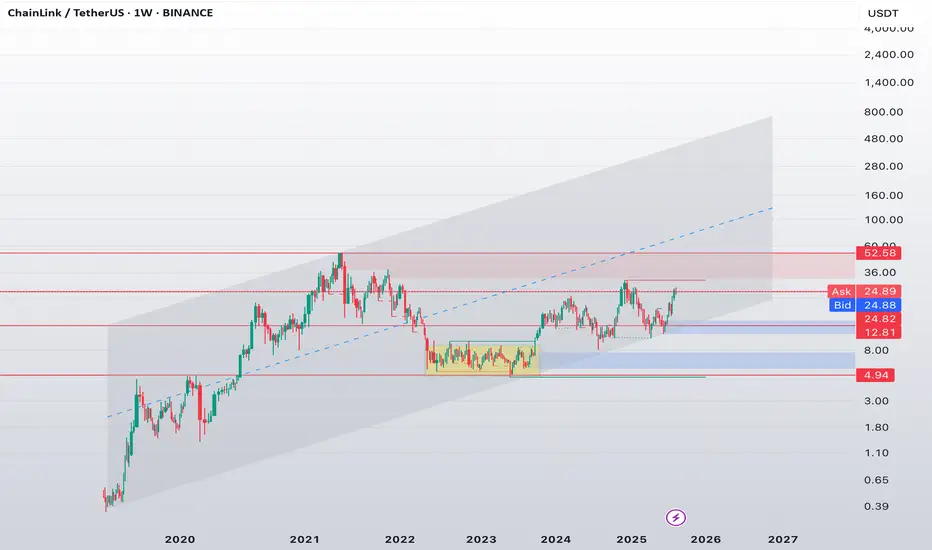
LINK Retesting Mid-Range Resistance Within a Healthy Uptrend📊 Chainlink ( BINANCE:LINKUSDT ) Retesting Mid-Range Resistance Within a Healthy Uptrend
On the weekly chart, CRYPTOCAP:LINK continues to maintain a clear higher low structure, currently retesting the critical resistance area around $25 — a level that historically capped upside in prior cycles.
🔍 Structural Highlights:
🔲The accumulation zone ($5–9) lasted over 500 days and ended with a breakout in late 2023
🔵 $12.80 held as a key higher low, validating the breakout structure
📈 Price is now approaching the $24–26 resistance — a historically significant supply zone that acted as a pivot point during 2021–2022
🧭 Scenarios I’m watching:
✅ Bullish case:
A confirmed breakout above $26 with weekly close ➝ opens the door toward $34–38 (next major supply block)
On macro strength, eventual extension toward $52 remains technically viable
❌ Bearish case:
Rejection at $25 ➝ pullback toward $18.50–$20 range for another higher low and continuation setup
🔬 Trend Dynamics:
Price is tracking inside a long-term ascending channel from the 2020 cycle
Current structure sits around the midline of the channel, which often acts as equilibrium or resistance in trend development
📌 My take:
CRYPTOCAP:LINK has completed its accumulation → expansion transition and is entering a more directional phase.
As long as we remain above $20, the macro structure stays bullish. But I’m not rushing into resistance at $25 — waiting for confirmation.
#LINK #Chainlink #CryptoAnalysis #TradingView #Altcoins #TechnicalOutlook #MacroStructure #MarketCycle
Chainlink Eyes $30 as Price Tests Key Resistance BINANCE:LINKUSDT ’s rally has paused just below a key resistance level. On the daily chart, the BINANCE:LINKUSDT price is trading near $24.65, facing pressure at $25.24; a level where 9.74 million LINK was accumulated. A daily close above this line could open the path to $28.67 and $30.67, per Fibonacci extension levels drawn from $15.44 to $24.78, with a retrace at $21.32.
However, if BINANCE:LINKUSDT slips below $21.32, the uptrend breaks, and short-term weakness may follow.
On-chain data support the bullish structure. Exchange reserves dropped 5.67% since June, falling from 172.23M to 162.45M LINK. That’s near the yearly low of 161.44 million — a zone that has preceded every rally this year. As long as reserves stay tight and price stays above $21.32, upside remains intact.

Chainlink LINK price analysis#LINK – Possible Breakout Setup?
🔹 Recent news indicates rising institutional interest in #Chainlink
🔹 The rally on OKX:LINKUSDT has been nearly correction-free
🔹 Next short-term targets: $28–31
🔹 Ideal pullback zone: $17–18, above the long-term blue trendline (since 2019)
🔹 If the trend holds, we could see a new impulse wave — possibly with ATH retest
🔍 What's your #LINKUSD target by end of 2025? 👇
______________
◆ Follow us ❤️ for daily crypto insights & updates!
🚀 Don’t miss out on important market moves
🧠 DYOR | This is not financial advice, just thinking out loud.

Is LINK Heading for a New ATH?⚡️ It’s been about a month since I said you don’t want to miss LINK. Many didn’t believe it, I suppose. And now LINK is being recognized by the White House as a key project. Surprising, isn’t it?
This is one of those projects where you don’t even need to look at the chart — it’s simply technologically essential for the crypto ecosystem, on the same level as Ethereum.
But let’s still look at LINK from a technical perspective — does it have room to grow further?
➡️ First: LINK is one of the very few tokens currently sitting at its local peak, while even ETH is still in correction.
➡️ Second: it’s also one of the only tokens where we see harmony in buying volume. Buyer interest is rising together with price, which signals the market considers LINK undervalued at current levels.
➡️ Third: there’s a clear inflow of fresh liquidity, and it’s actually increasing — while liquidity is flowing out of most of the rest of the crypto market.
➡️ And importantly — with this move LINK has now closed one of the upper gaps. That means the road higher won’t be as smooth. Right now, it’s already testing resistance at $25.95 and approaching its 5-year descending resistance line.
📌 Conclusion:
If LINK manages to hold above this level, we could very well see a run to a new ATH — and possibly beyond.
However, more and more gaps are forming below, and the overall market is weakening, which is definitely something to be cautious about.

LinkUSDT: Elliot Waves AnalysisHello friends, I have opened such a trade on the LINK currency. The strategy is based on Elliott waves and price action. I hope you can be profitable.
