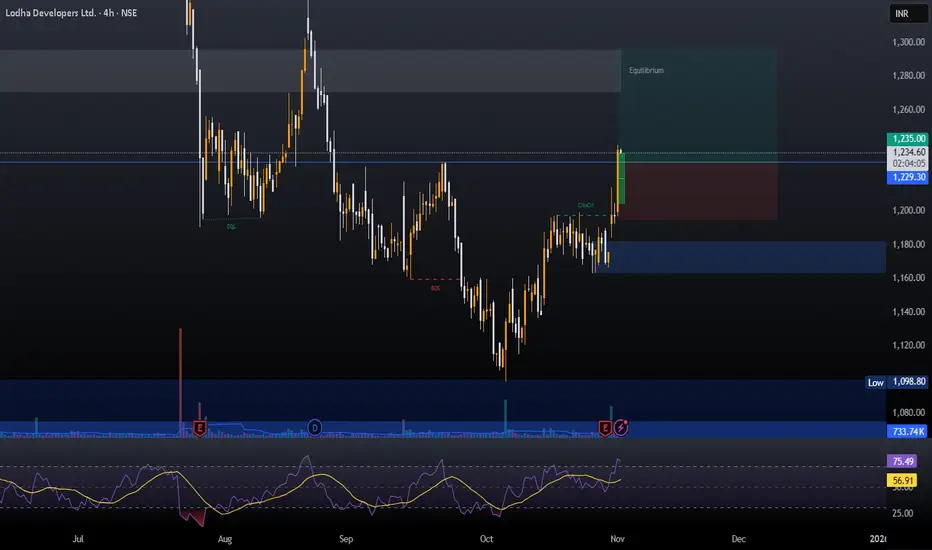
LODHAOne can look for long entry in LODHA here its giving a good breakout. The whole real estate sector is looking for a bull run.
Entry- 1229-1230.
Target 1280, 1300, 1320
Stoploss- 1190.
Disclaimer- This is just for educational purpose.
Jai Shree Ram.
Next report date
—
Report period
—
EPS estimate
—
Revenue estimate
—
33.40 INR
27.64 B INR
137.79 B INR
280.89 M
About Lodha Developers Ltd.
Sector
Industry
CEO
Abhishek Mangal P. Lodha
Website
Headquarters
Mumbai
Founded
1995
ISIN
INE670K01029
FIGI
BBG000V15YB0
IPO date
Apr 19, 2021
IPO offer price
6.50 USD
Lodha Developers Ltd. engages in the real estate development business. Its core business is residential real estate developments with a focus on affordable and mid-income housing. The company was founded on September 25, 1995 and is headquartered in Mumbai, India.
Related stocks
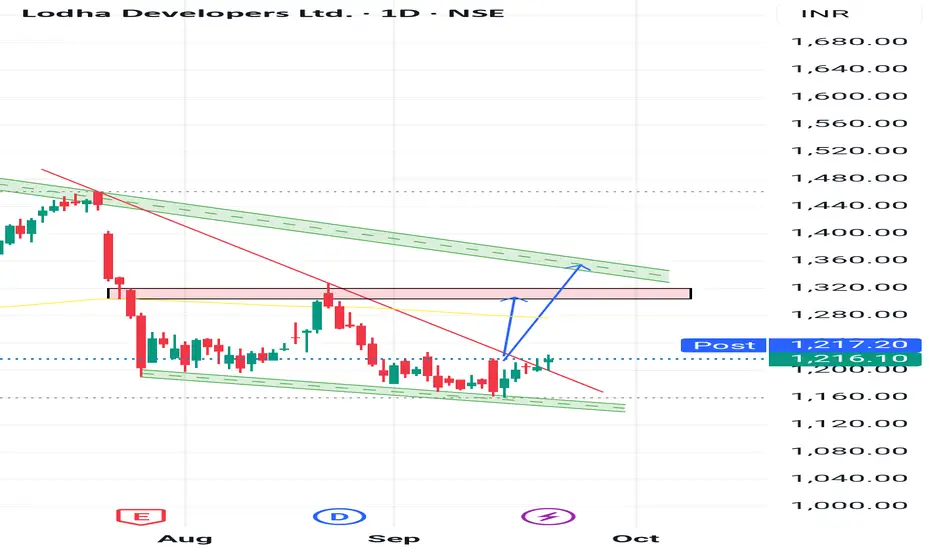
LODHADear friends,
Price near support area so possiblity that it will be moves upper side. Let see
This idea is for Educational purpose and paper trading only. Please consult your financial advisor before investing or making any position. Facts or Data given above may be slightly incorrect. We are n
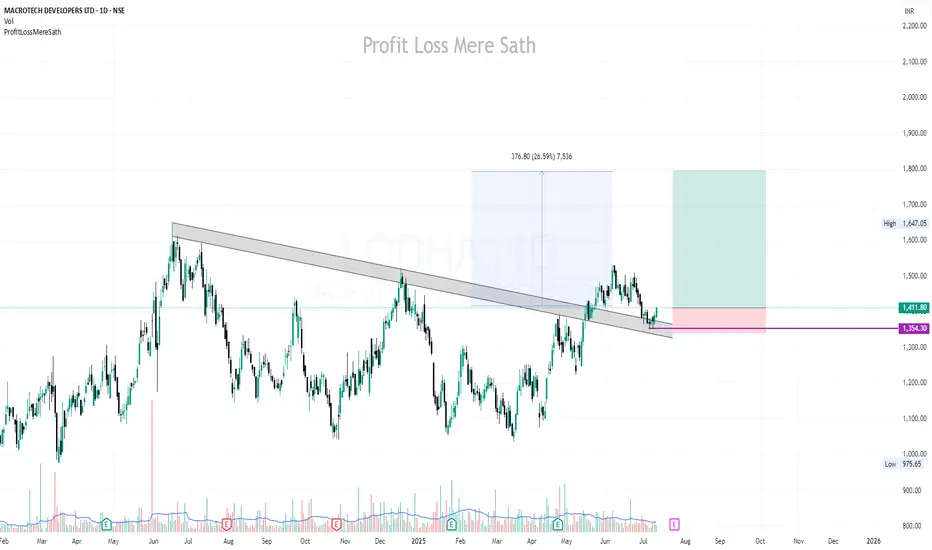
LODHA: Bullish DIVERGENCE in Daily AND Shorter TFLODHA: Bullish DIVERGENCE in Daily AND Shorter TF
DOUBLE Bottom Pattern. Possible Reversal.
^^^^^^^ Plot Levels Using 3 Min, 5 Min Time frame in your Chart for Better Analysis ^^^^^^^
L#1: If the candle crossed & stays above the “Buy Gen”, it is treated / considered as Bullish bias.
L#2: If

Review and plan for 12th September 2025Nifty future and banknifty future analysis and intraday plan.
stock ideas.
This video is for information/education purpose only. you are 100% responsible for any actions you take by reading/viewing this post.
please consult your financial advisor before taking any action.
----Vinaykumar hirem

elliot waves in LODHAElliott Wave Setup: Correction Nearing Completion, Impulse Loading
Verdict: Bullish bias intact—Wave 4 correction is maturing, Wave 5 impulse setup is in play.
What’s Good
Waves 0→1 and 2→3 show clean, unmitigated impulse structure—trend strength confirmed
Wave 4 is unfolding as a double flat, a c


LODHA | Buy @LTP | Small SL below 1550 | Target 1800Disclaimer:
This is not financial advice. Please do your own research or consult with a financial advisor before making any investment decisions. Investments in stocks can be risky and may result in loss of capital.
Keep an eye on Lodha (Macrotech Dev.)Lodha looks good for positional trading I am entering above 1535 for 1975. My SL is below 1375 WCB


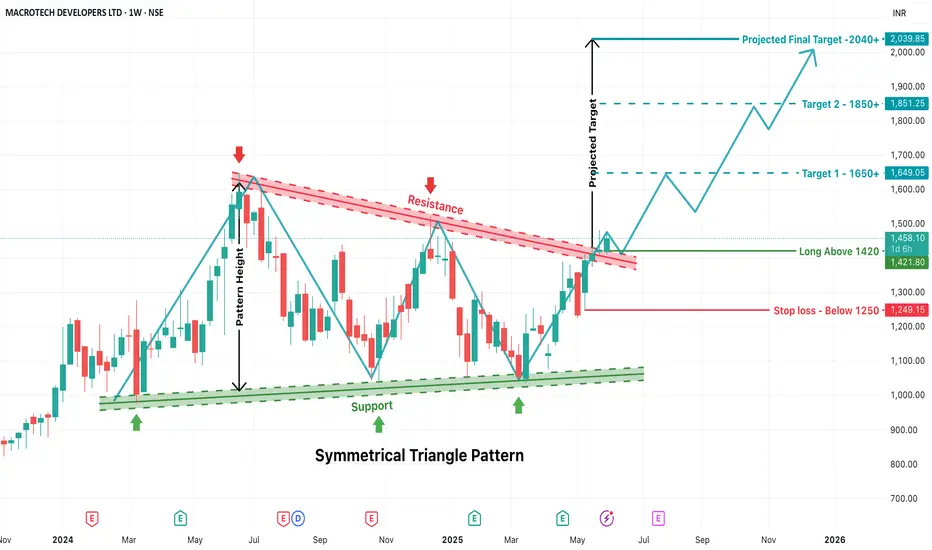
LODHA - Symmetrical Triangle Breakout Trade SetupAbout Pattern:
A Symmetrical Triangle Pattern is a continuation chart pattern formed when price action creates lower highs and higher lows, converging toward a point. It reflects indecision and compression in price before a breakout occurs. The breakout can be on either side, but here, a bullish br
See all ideas
Summarizing what the indicators are suggesting.
Neutral
SellBuy
Strong sellStrong buy
Strong sellSellNeutralBuyStrong buy
Neutral
SellBuy
Strong sellStrong buy
Strong sellSellNeutralBuyStrong buy
Neutral
SellBuy
Strong sellStrong buy
Strong sellSellNeutralBuyStrong buy
An aggregate view of professional's ratings.
Neutral
SellBuy
Strong sellStrong buy
Strong sellSellNeutralBuyStrong buy
Neutral
SellBuy
Strong sellStrong buy
Strong sellSellNeutralBuyStrong buy
Neutral
SellBuy
Strong sellStrong buy
Strong sellSellNeutralBuyStrong buy
Displays a symbol's price movements over previous years to identify recurring trends.
796LDL28
Lodha Developers Limited 7.96% 07-JUL-2028Yield to maturity
—
Maturity date
Jul 7, 2028
810LDL30
Lodha Developers Limited 8.1% 29-SEP-2030Yield to maturity
—
Maturity date
Sep 29, 2030
787LDL29.N0
Lodha Developers Limited 7.87% 15-SEP-2029Yield to maturity
—
Maturity date
Sep 15, 2029
860LDL27
Lodha Developers Limited 8.6% 10-DEC-2027Yield to maturity
—
Maturity date
Dec 10, 2027
814LDL28
Lodha Developers Limited 8.14% 05-JUN-2028Yield to maturity
—
Maturity date
Jun 5, 2028
LDL131125
Lodha Developers Limited FRN 13-NOV-2028Yield to maturity
—
Maturity date
Nov 13, 2028
LDL210725
Lodha Developers Limited FRN 21-JAN-2028Yield to maturity
—
Maturity date
Jan 21, 2028
See all LODHA bonds
EEDM
iShares IV PLC - iShares MSCI EM CTB Enhanced ESG UCITS ETF Unhedged USDWeight
0.16%
Market value
13.34 M
USD
EDM2
iShares IV PLC - iShares MSCI EM CTB Enhanced ESG UCITS ETF Accum Shs Unhedged USDWeight
0.16%
Market value
13.34 M
USD
Explore more ETFs
Frequently Asked Questions
The current price of LODHA is 1,109.50 INR — it has increased by 0.51% in the past 24 hours. Watch Lodha Developers Ltd. stock price performance more closely on the chart.
Depending on the exchange, the stock ticker may vary. For instance, on NSE exchange Lodha Developers Ltd. stocks are traded under the ticker LODHA.
LODHA stock has fallen by −4.98% compared to the previous week, the month change is a −10.67% fall, over the last year Lodha Developers Ltd. has showed a −14.65% decrease.
We've gathered analysts' opinions on Lodha Developers Ltd. future price: according to them, LODHA price has a max estimate of 1,888.00 INR and a min estimate of 1,000.00 INR. Watch LODHA chart and read a more detailed Lodha Developers Ltd. stock forecast: see what analysts think of Lodha Developers Ltd. and suggest that you do with its stocks.
LODHA reached its all-time high on Jun 18, 2024 with the price of 1,649.95 INR, and its all-time low was 211.30 INR and was reached on Apr 19, 2021. View more price dynamics on LODHA chart.
See other stocks reaching their highest and lowest prices.
See other stocks reaching their highest and lowest prices.
LODHA stock is 2.41% volatile and has beta coefficient of 1.98. Track Lodha Developers Ltd. stock price on the chart and check out the list of the most volatile stocks — is Lodha Developers Ltd. there?
Today Lodha Developers Ltd. has the market capitalization of 1.10 T, it has decreased by −1.06% over the last week.
Yes, you can track Lodha Developers Ltd. financials in yearly and quarterly reports right on TradingView.
Lodha Developers Ltd. is going to release the next earnings report on Jan 27, 2026. Keep track of upcoming events with our Earnings Calendar.
LODHA earnings for the last quarter are 7.87 INR per share, whereas the estimation was 9.05 INR resulting in a −13.04% surprise. The estimated earnings for the next quarter are 8.60 INR per share. See more details about Lodha Developers Ltd. earnings.
Lodha Developers Ltd. revenue for the last quarter amounts to 37.98 B INR, despite the estimated figure of 34.07 B INR. In the next quarter, revenue is expected to reach 50.71 B INR.
LODHA net income for the last quarter is 7.89 B INR, while the quarter before that showed 6.75 B INR of net income which accounts for 16.90% change. Track more Lodha Developers Ltd. financial stats to get the full picture.
Yes, LODHA dividends are paid annually. The last dividend per share was 4.25 INR. As of today, Dividend Yield (TTM)% is 0.39%. Tracking Lodha Developers Ltd. dividends might help you take more informed decisions.
Lodha Developers Ltd. dividend yield was 0.36% in 2024, and payout ratio reached 15.31%. The year before the numbers were 0.20% and 14.03% correspondingly. See high-dividend stocks and find more opportunities for your portfolio.
As of Dec 5, 2025, the company has 18.63 K employees. See our rating of the largest employees — is Lodha Developers Ltd. on this list?
EBITDA measures a company's operating performance, its growth signifies an improvement in the efficiency of a company. Lodha Developers Ltd. EBITDA is 46.20 B INR, and current EBITDA margin is 29.79%. See more stats in Lodha Developers Ltd. financial statements.
Like other stocks, LODHA shares are traded on stock exchanges, e.g. Nasdaq, Nyse, Euronext, and the easiest way to buy them is through an online stock broker. To do this, you need to open an account and follow a broker's procedures, then start trading. You can trade Lodha Developers Ltd. stock right from TradingView charts — choose your broker and connect to your account.
Investing in stocks requires a comprehensive research: you should carefully study all the available data, e.g. company's financials, related news, and its technical analysis. So Lodha Developers Ltd. technincal analysis shows the sell today, and its 1 week rating is sell. Since market conditions are prone to changes, it's worth looking a bit further into the future — according to the 1 month rating Lodha Developers Ltd. stock shows the neutral signal. See more of Lodha Developers Ltd. technicals for a more comprehensive analysis.
If you're still not sure, try looking for inspiration in our curated watchlists.
If you're still not sure, try looking for inspiration in our curated watchlists.